PWM Controlled Fan Load using DC motor
Aim: -
To model a circuit of DC motor with fan type load controlled by a Controlled PWM Voltage and H - Bridge in MATLAB / Simulink and analyse the simulation results.
Theory: -
The primary emphasis of this work is to model a DC motor driven by an input signal that approximates a pulse-width modulated signal. These signals are fed to the motor using an H bridge circuit. Further, we focus on the implementation of speed control of a fan at the motor output. We assume that the change of operating speed of the fan is through stepwise modulation through a fan regulator.
Pulse Width Modulation
Pulse width modulation (PWM) is a modulation technique that generates variable - width pulses to represent the amplitude of an analogue input signal. Digital control creates a square wave, a signal switched between on and off. This on-off pattern can simulate voltages in between full-on and off by changing the portion of the time the signal spends on versus the time that the signal spends the duration of "on time" is called the pulse width. To get varying analogue values, we change or modulate, that pulse width. The length of time that a pulse is in a given state (high / low) is the "width" of a pulse wave.
Duty Cycle:
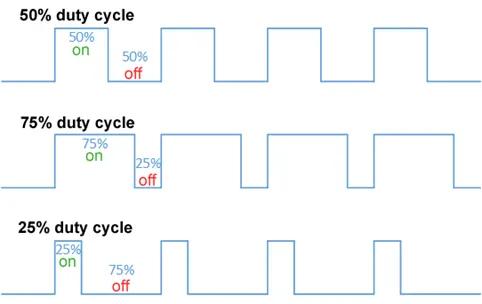
The term duty cycle describes the proportion of 'on' time to the regular interval or 'period' of time; a low duty cycle corresponds to low power, because the power is off for most of the time. Duty cycle is expressed in percent, 100% being fully on. When a digital signal is on half of the time and off the other half of the time, the digital signal has a duty cycle of 50% and resembles a "square" wave. When a digital signal spends more time in the on state than the off state, it has a duty cycle of >50%. When a digital signal spends more time in the off state than the on state, it has a duty cycle of <50%. Here is a pictorial that illustrates these three scenarios:
H-Bridge
An H-bridge is a simple circuit that control a DC motor to go backward or forward.
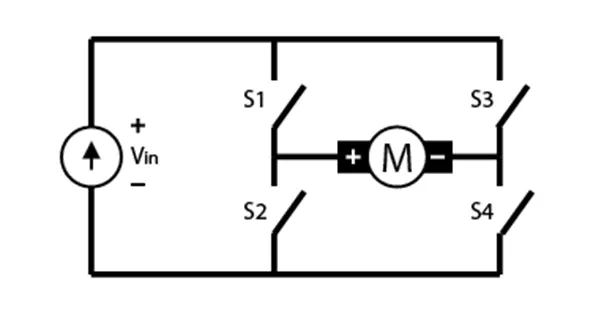
An H-bridge is built of four switches that control the flow of current to a load. In the image above, the load is the M connecting the two sets of switches. Using one current source, we can drive current in two directions by closing two switches. If Switch 1 and 4 are closed, then the current will flow from the left to right on this image:
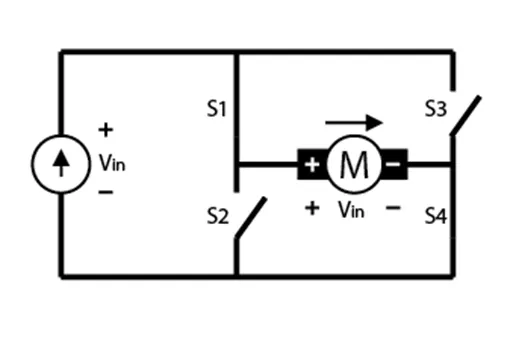
If we close switch 1 and switch 4, the current will flow from the source, through switch 1, and then through the load, then through switch 4, and then back to the load.
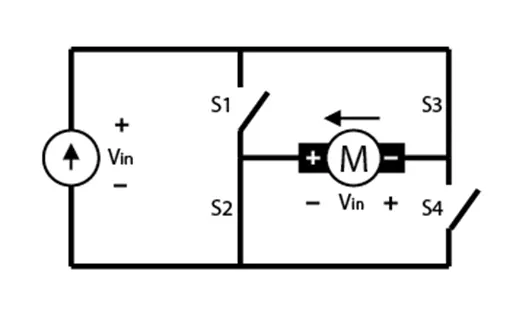
In the image above, the circuit has Switch 2 and switch 3 closed. This will cause the current to flow from the source, through switch 3, and then through the load, then through switch 2, then back to the load.
One thing we have to be very cautious about when working with H-bridges is to not create a short circuit. If we create a short circuit, that’s a sure way to burn out H-bridge. If we drive current and close two switches in series, for example, switch 3 and 4 in the image below, will cause a short and burn out the H-bridge
Simulink Blocks Used: -
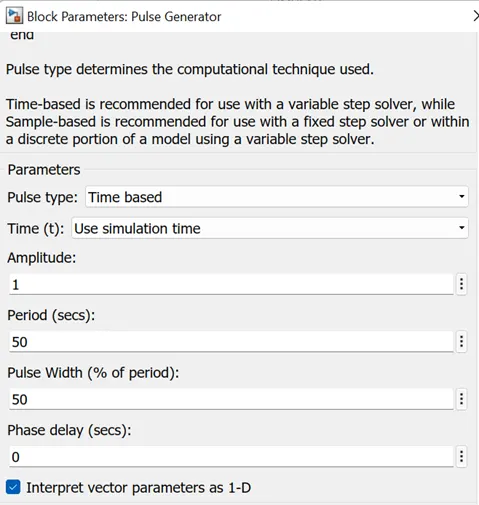
- Pulse Generator: It generates the pulse to drive/input to the controlled voltage source.
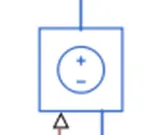
- Controlled Voltage Source: It converts the pulses from pulse generator into an equivalent voltage source
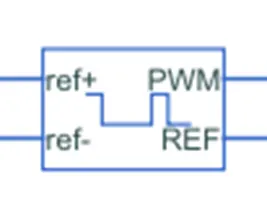
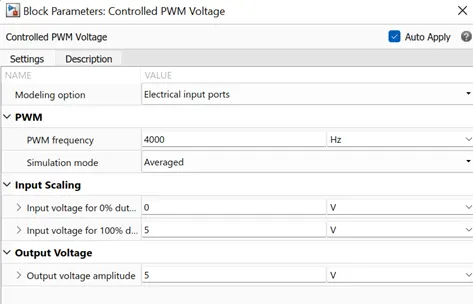
- Controlled PWM Voltage: This block creates a Pulse-Width Modulated (PWM) voltage across the PWM and REF ports. The output voltage is zero when the pulse is low, and is equal to the Output voltage amplitude parameter when high. Duty cycle is set by the input value.
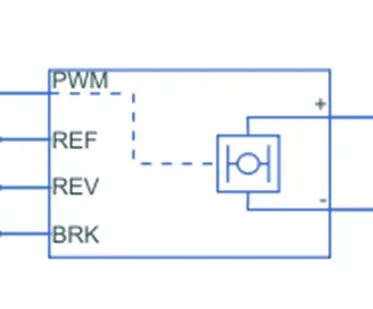
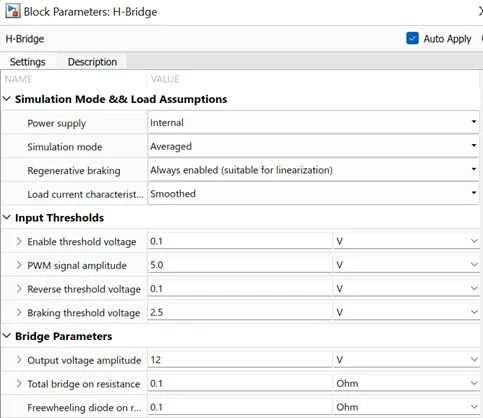
- H-Bridge: This block represents an H-bridge motor drive. The block can be driven by the Controlled PWM Voltage block in PWM or Averaged mode. In PWM mode, the motor is powered if the PWM port voltage is above the Enable threshold voltage. In Averaged mode, the PWM port voltage divided by the PWM signal amplitude parameter defines the ratio of the on-time to the PWM period. Using this ratio and assumptions about the load, the block applies an average voltage to the load that achieves the correct average load current. The Simulation mode parameter value must be the same for the Controlled PWM Voltage and H-Bridge blocks. If the REV port voltage is greater than the Reverse threshold voltage, then the output voltage polarity is reversed. If the BRK port voltage is greater than the Braking threshold voltage, then the output terminals are short circuited via one bridge arm in series with the parallel combination of a second bridge arm and a freewheeling diode. Voltages at ports PWM, REV and BRK are defined relative to the REF port.
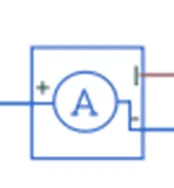
- Current Sensor: To measure the current.
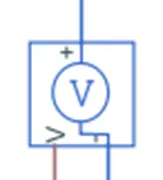
- Voltage Sensor: To measure the voltage.
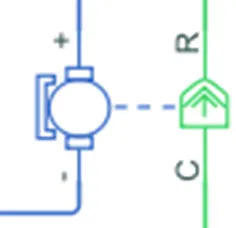
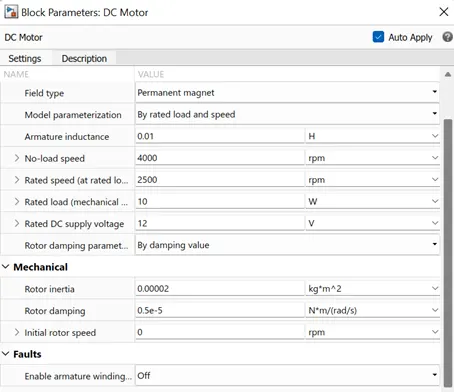
- DC Motor: This block represents the electrical and torque characteristics of a DC motor. It has 2 sides; blue colour represents the electrical side and green colour represents the mechanical side.
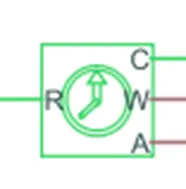
- Ideal Rotational Motion Sensor: This block measures angular velocity or angle in a mechanical rotational network. The sensor is ideal since it does not account for inertia, friction, delays, energy consumption, and so on. The physical signal ports W and A report the angular velocity and angle, respectively, of port R relative to port C. The measured angular velocity is positive when the angular velocity at port R is greater than the angular velocity at port C.
- Ideal Torque Source: The block represents an ideal source of torque that generates torque at its terminals proportional to the input physical signal.
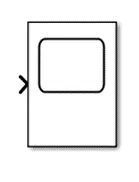
- Scope: To view the result. It shows the change in values with respect to time.
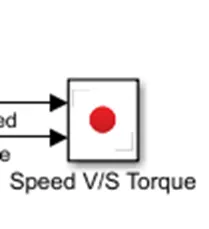
- XY Graph: To view the speed vs torque characteristics of motor.
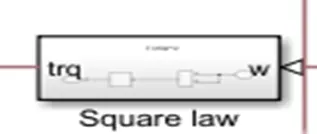
Fan Load Subsystem (Square Law)
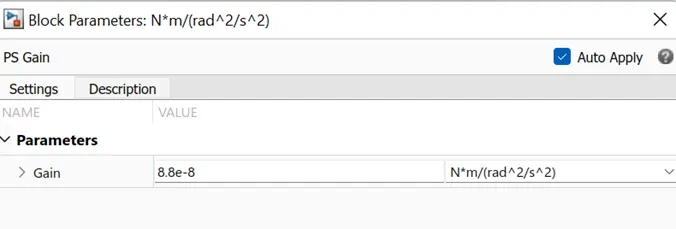
To implement the fan load we created a subsystem by using PS Gain block and PS Product block.
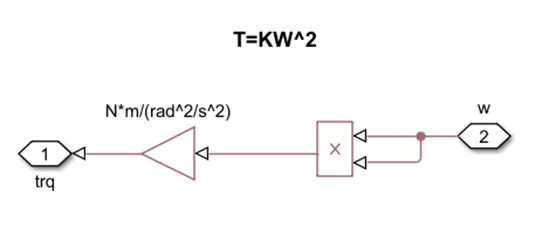
Simulink Model: -
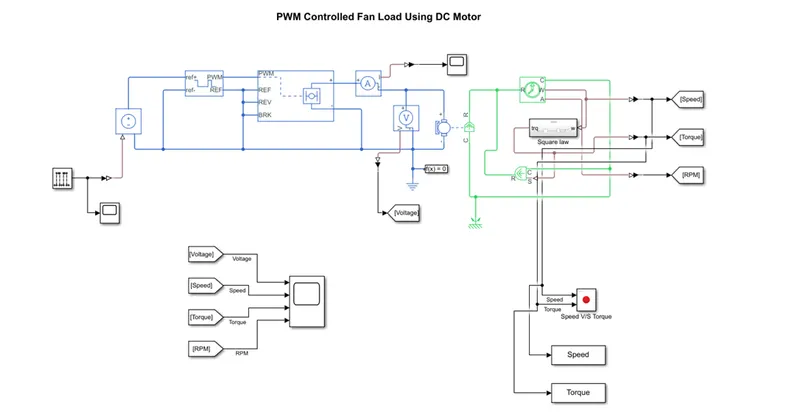
After connecting all the blocks we can run the simulation for 50 seconds
Observations: -
After all the connections we run the simulation for 50 seconds, then we can see the following results;
PWM Signal
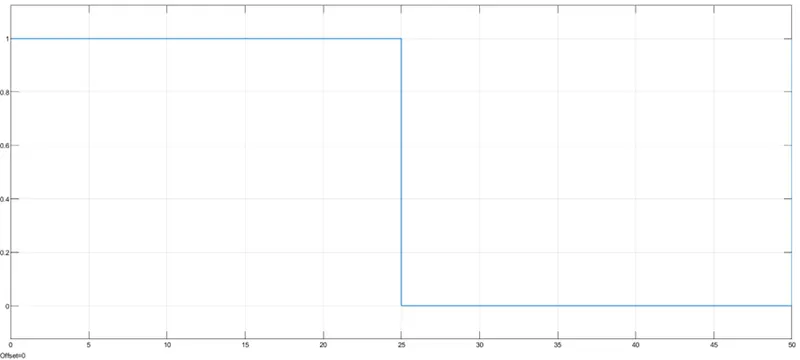
From the plot we can understand that; input will be like the switch is on for 25 seconds and off for 25 to 50 seconds.
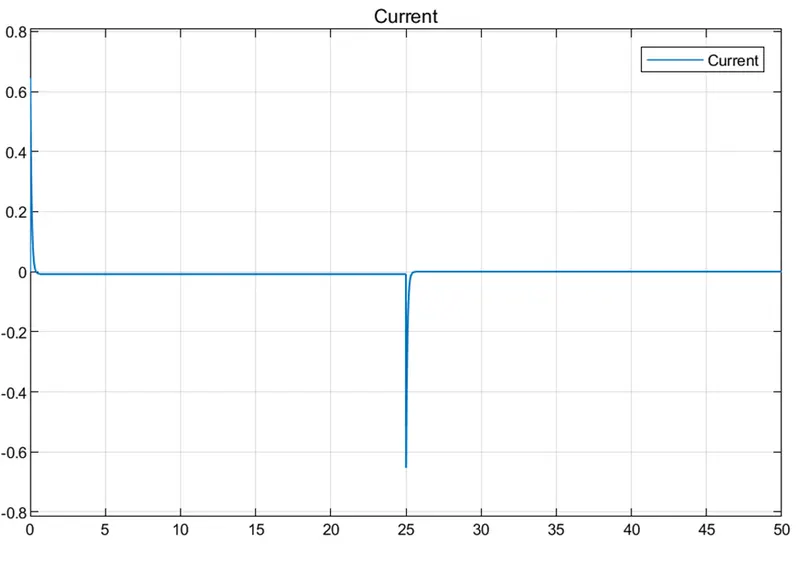
Current
Voltage, Torque, Speed & RPM
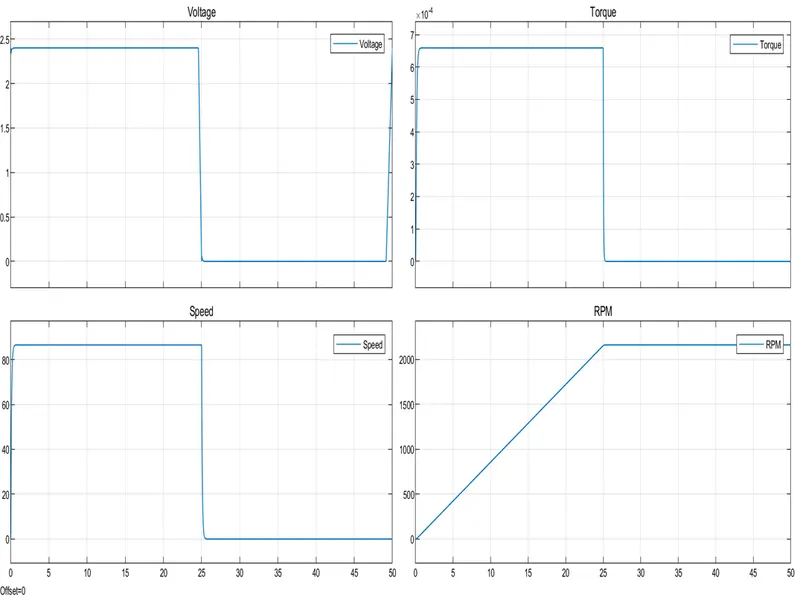
By observing the graphs, we can understand how the current, voltage, speed, rpm, and torque is changing with respect to the on and off state (time). They completely following the input we are given.
In the case of current; there is a small amount of current while switching between on and off. While switching on the current will be in positive direction and if it is off current will be in negative direction, but the magnitudes (0.65A) are same in the 2 situations.
Voltage plot gives a clear image that, when the switch is on (0 to 25 seconds) condition there will be a voltage of 2.4V and when it is off (25 to 50 seconds) the voltage is 0. Like voltage the torque and speed showing some values (Torque = 6.5*10^-4 Nm, Speed = 86 mph) in the on mode and 0 for the off mode.
If we look on the RPM; the motor achieves an RPM of 2162.5 linearly from 0 t0 25 seconds and keeping it steady from 25 to 50 seconds.
Speed Torque Characteristics
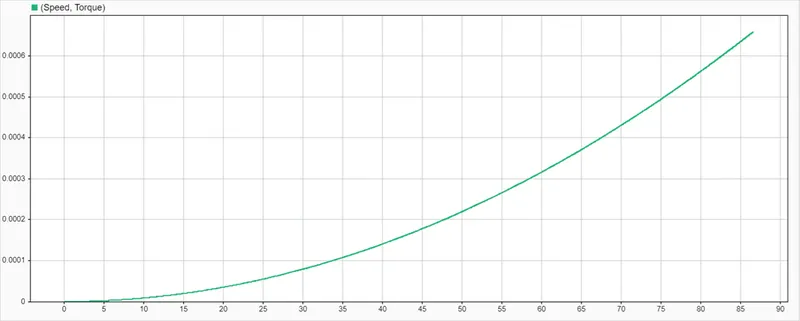
The torque speed curve showing its torque requirement on the y-axis versus the speed on the x-axis. It’s the torque requirement of the load from zero speed to full speed. This is same as the speed torque characteristics of a DC motor.
Conclusion: -
A PWM controlled DC motor using an H bridge circuit was modelled in Simulink and results were analysed. The output plots justified the theory discussed. The load torque characteristics of a fan is obtained. The full speed was observed for a full voltage of 12V from DC motor.