Week-4 Challenge WOT Condition Part-2
1. What is the difference between mapped and dynamic model of engine, motor and generator? How can you change model type?
Mapped And Dynamic Model Motor And Generator
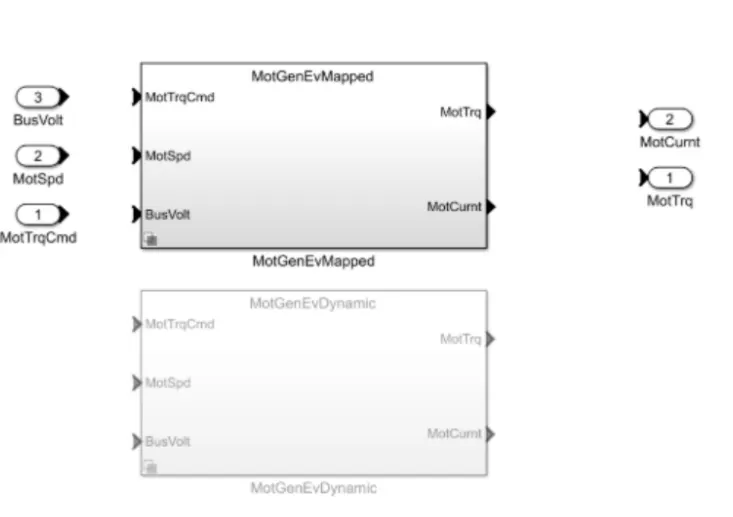
Mapped Mode:
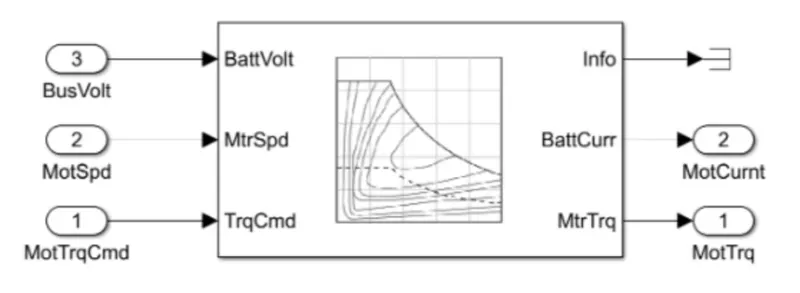
1) In mapped model data points are pre - assigned in lookup table which would be configured with the operational parts and the analysis would be formed.
2) Model uses a set of steady - state lookup tables to characterize engine performance.
3) Output values are stored for the given corresponding input values of the motor , generator and engine.
4) The accuracy is low for this system.
5) Run time simulation takes less time , because it dose not run with real time simulation.
Dynamic Model:
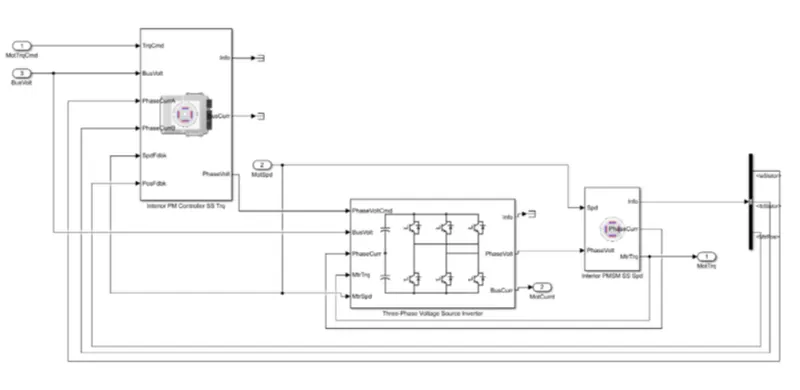
1) Dynamic model runs by real time simulator.
2) Dynamic model uses the combination of output from various subsystems to generate output.
3) The accuracy of dynamic model is very high.
4) Run time simulation takes more time.
Steps To Change The Model Type:
1) Select vehicle type in powertrain blockset model.
2) Go to the passenger block in the simulink model of Electrical Vehicle motor / Generator.
3) Right click on block and go to variance label mode active choice MotorGenEV Mapped or Dynamic.
2. How does the model calculate miles per gallon? Which factors are considered to model fuel flow?
In electrical vehicle miles per gallon tells that energy which is equivalent that of an engine powered car to propel the car through a distance.
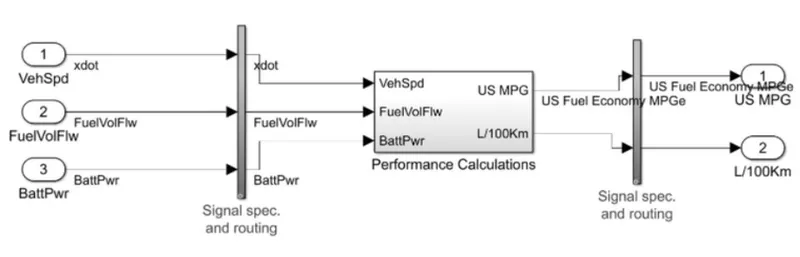
This is the model that do the performance calculation of fuel flow.
Miles per gallon expressed as the amount of fuel required to move a engine powered car through a distance is determined and the it is compared to the equivalent amount of electric energy required to move the car through the same distance. It has the inputs;
- Vehicle speed
- Battery power
- Fuel flow
Calculation of miles per gallon in ' EV Reference Application model:
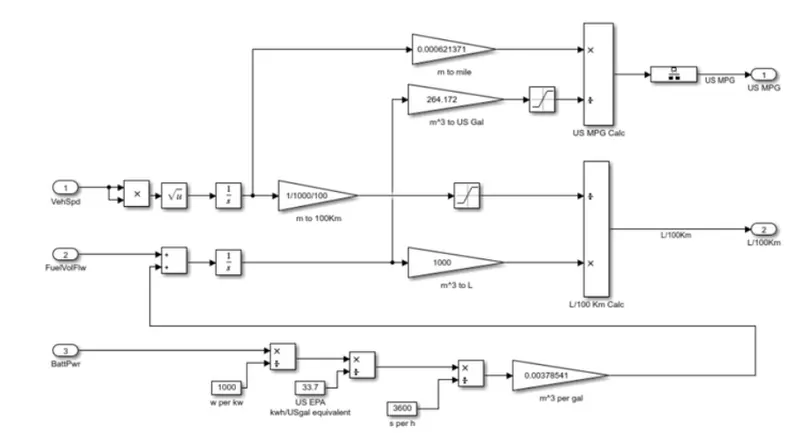
1) Open Evreference application model in MATLAB and inside the visualisation block we can see the blocks which are used for calculation of MPG.
2) Now open the performance calculation block as shown in the figure.
3) Here vehicle speed (x) is multiplied itself and then square rooted. The value is then integrated (1 / s) and converted into meters (m). Then the meters (m) is converted into miles in the block (m to mile) then it is divided by US Gal to get US MPG.
4) For US Gallon we need to divide battery power dided by 1000 and then divide by 33.7. Now it is converted from sec to hours by dividing with 3600 then it is converted to m^3 per gal.
5) The value is finally converted into Gallon and used as MPG after dividing miles with gallon.
Factors considered in model fuel flow:
- Battery power Capacity should be high and vehicle power consumption should be low for higher MPGe (Miles Per Gallon equivalent).
- Vehicle speed
3. Run the HEV ReferenceApplication with WOT drive cycle. Change the grade and wind velocity in the environment block. Comment on the results.
HEV ReferenceApplication with WOT drive cycle
The hybrid electric vehicle reference application represents a full multimode hybrid electric vehicle (HEV) model with an internal combustion engine, transmission , battery , motor , generator , and associated powertrain control algorithms. Use the reference application for powertrain matching analysis and component selection , control and diagnostic algorithm design , and hardware - in - the - loop (HIL) testing.
By default , the HEV multimode reference application is configured with:
- Mapped motor and generator
- 1.5 - L spark - ignition (SI) dynamic engine
This diagram shows the powertrain configuration;
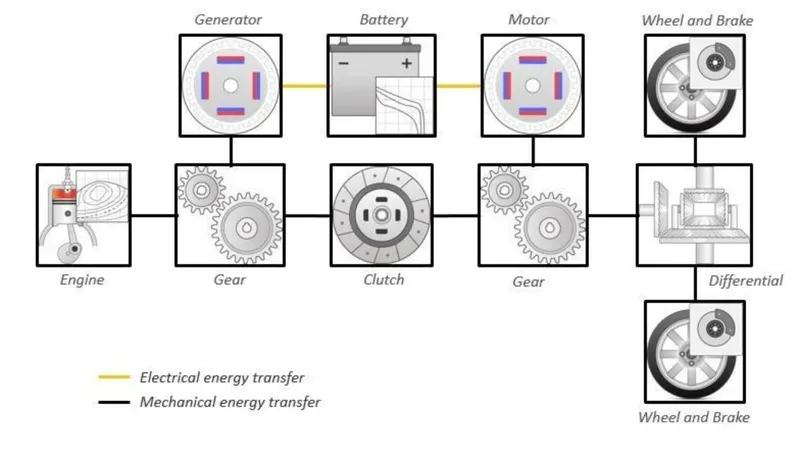
HEV Reference Application Model
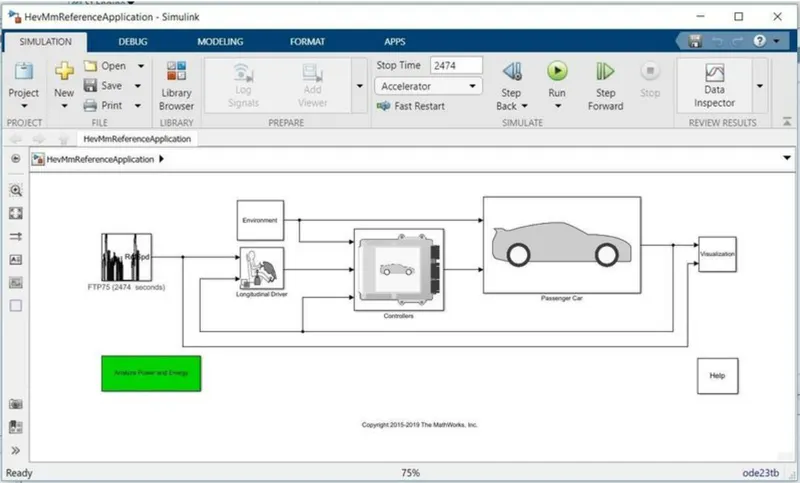
Case-1
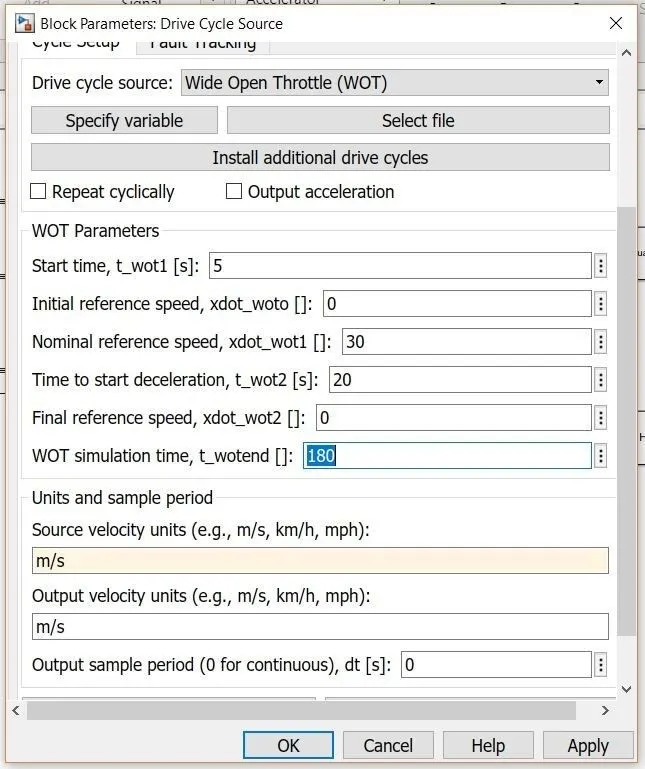
The default drive cycle is FTP75 with 2474 sec . Now change it to WOT drive cycle as below with WOT simulation time as 180 sec and click on OK.
Result:
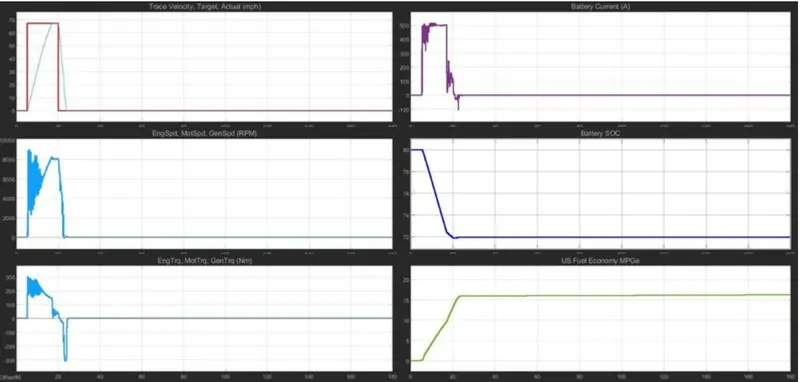
- The target velocity actual was able to achieve 67.1 mph.The battery current was increased upto 500 Amp and maintained for a duration of 14 sec.
- Engine speed is able to achieve 8000 RPM and battery State of Charge ( SOC ) was decrease from 80 to 72.
- Engine torque increases intially and goes to negitive after 20th second and the peak torque achieve was around 275 Nm. The fuel economy was increased from 0 to 16 and remains constant
Case-2
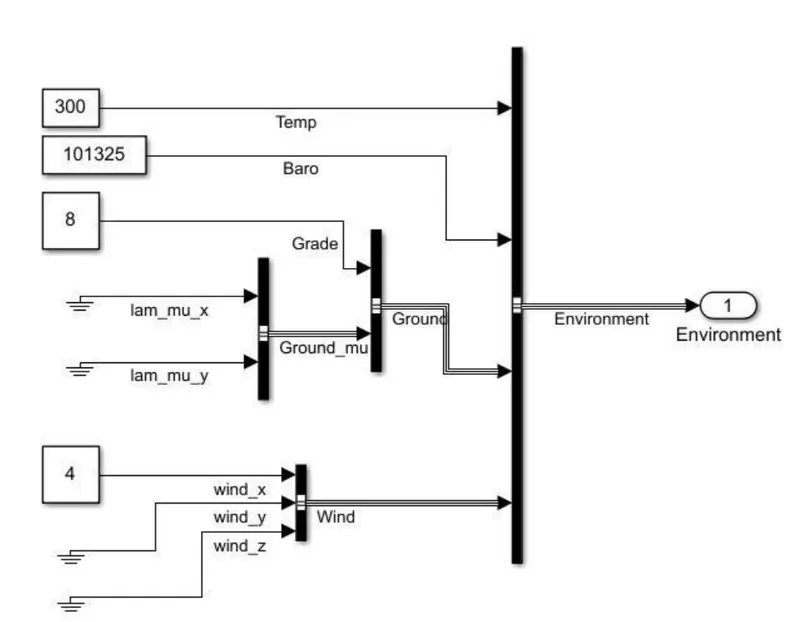
Now changing the Environment sub - system in casel specification of HEV reference application . The grade was now changed from 0 to 8 and wind velocity from 0 to 4.
Result:
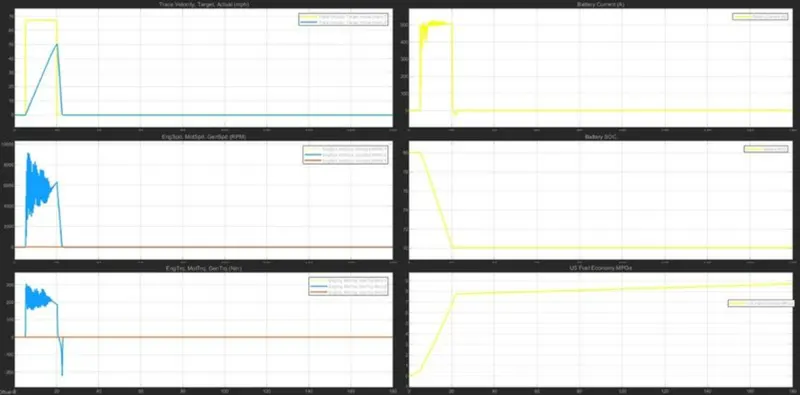
- The target velocity actual was only able to achieve 50.4 mph.The battery current was increased upto 500 Amp and maintained for a duration of 14 sec.
- Engine speed was able to achieve 8000 RPM but for a small duration of time and battery State of Charge (SOC) was decrease from 80 to 70.
- Engine torque increases intially and goes to negitive after 20th second and the peak torque achieve was around 275 Nm. The fuel economy was increased from 0 to 8.7 and remains constant.
4. Keeping all other parameters same, compare the simulated results of hybrid and pure electric powertrains.
HEV Multimode Reference Application
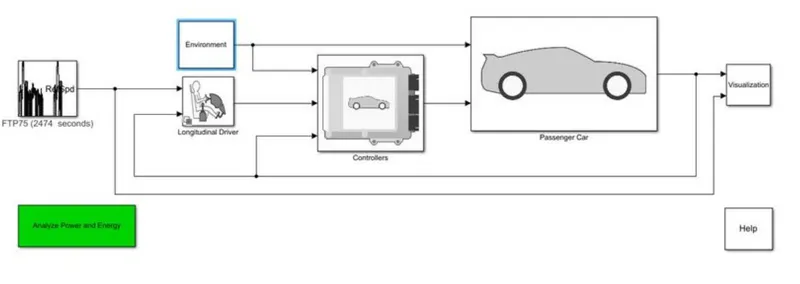
- Open Hev Reference Application model in MATLAB.
- The model consist of Environment , Drive cycle , Longitudinal Driver passenger and visualisation Subsystem.
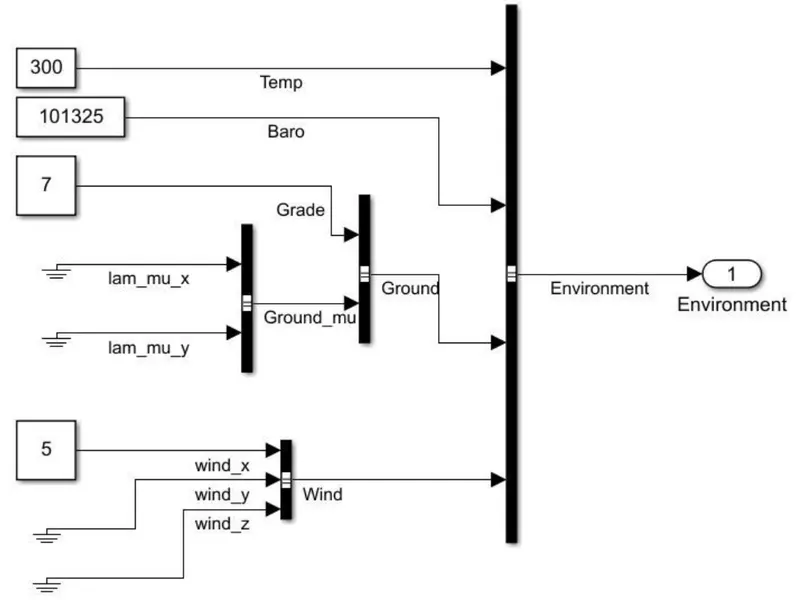
- open the environment block and change the grade value to 7 and wind velocity to 5.
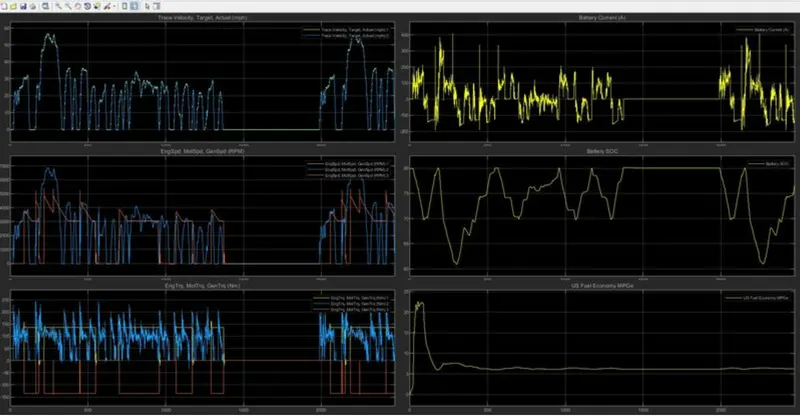
- Now run the simulation with 2474 seconds and go to visualisation to see the graph.
 \
\
Result Graph:
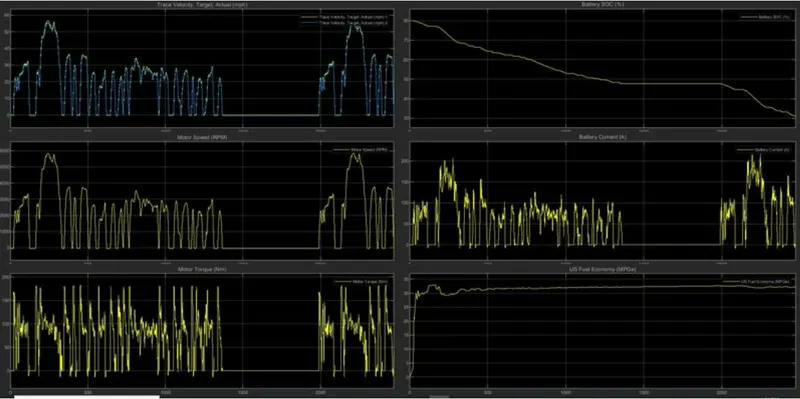
EV Reference Application Model
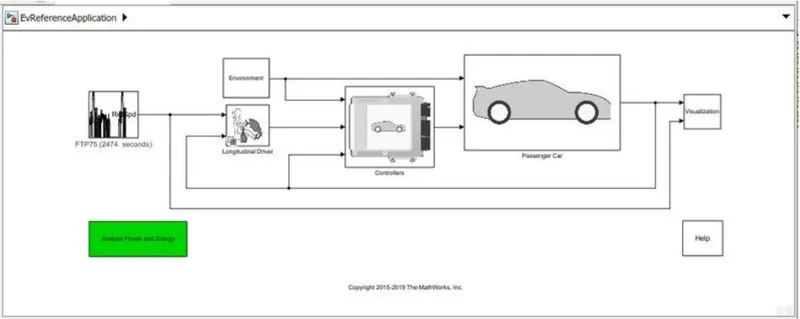
- Open Electric Vehicle Reference Application model in MATLAB.
- The model consist of Environment , Drive cycle , Longitudinal Driver passenger and visualisation Subsystem as similar to HEV but as it is a pure electric vehicle the complexity in the model is less and the rendering time is less.
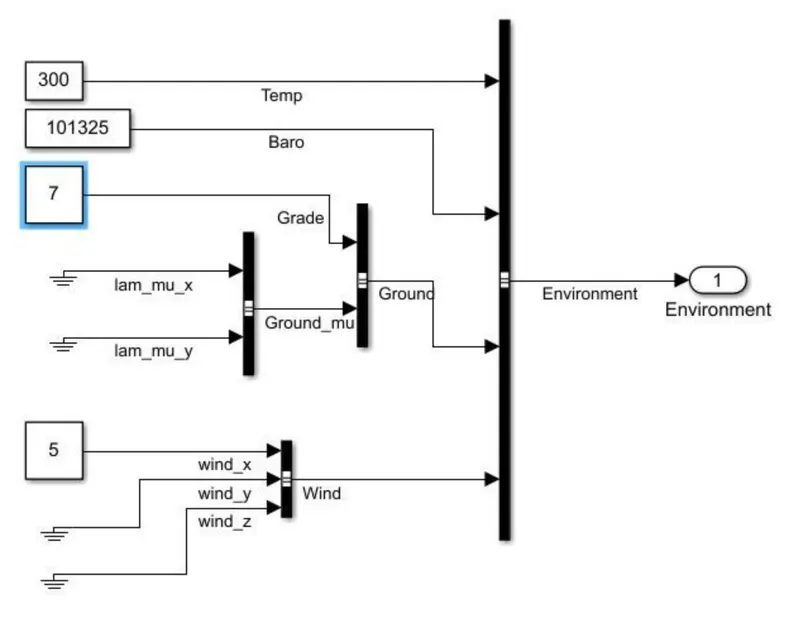
- open the environment block and change the grade value to 7 and wind velocity to 5.
- Now run the simulation with 2474 seconds and go to visualisation to see the graph.
Result Graph:
Conclusion:
1) Battery current is continuesly changing in HEV due to charging and discharging while in pure EV the battery current is consistanty dropping.
2) The US fuel economy is high in EV compared to HEV , traveling cost is less for EV.
3) The motor speed ( RPM ) is high for HEV compared to EV.