Modelling and simulation of flow through a flowbench
Aim: To perform flow simulation through Flowbench
Objective:
To model a flowbench and perform grid dependece test to find the optimal mesh size and to perform flow simulation to find effect of valve lift on mass flowrate.
Theory:
An flow bench is a device used for testing the internal aerodynamic qualities of an engine component and is related to the more familiar wind tunnel. It is used primarily for testing the intake and exhaust ports of cylinder heads of internal combustion engines. It is also used to test the flow capabilities of any component such as air filters, carburetors, manifolds or any other part that is required to flow gas. 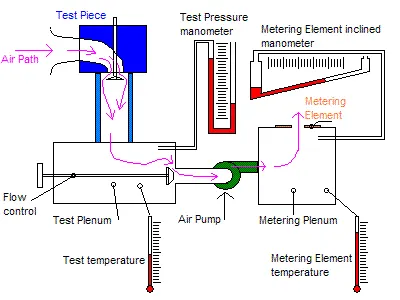
Flowbench model is modelled in solidworks using approximate dimensions as shown below,
Analysis Setup:
To make closed solid geometery for flow simulation lids are created at the inlet of the port and at the bottom of the cyclinder.
A flow simuation is created for base run using flow simulation wizard. A steady state internal flow is setuped. The boundary condition applied are as follows:
1. Total pressure of 5bar to the inlet of port.
2. Static pressure of 1atm to the outlet(i.e. bottom of the cylinder)
Mass flow rate is setuped as a surface goal for bottom face lid of the cylinder and simulation is performed. A cutplot is inserted to check the results.
Grid Dependence Test:
The grid dependence test is performing simulation on a model for different mesh size. With finer mesh the results are accurate but it takes longer to complete the study while with coarse mesh size, the study takes very less time to complete but the results are not that accurate. Therefore, it is required to find an optimal mesh size such that the study gives good results and completes in relativley less time.
A parametric study is defined to find results for mesh size level of 5, 6 and 7. The results are shown below:
Design Point 1:
Design Point 2:
Design Point 3:
From figure and result table, it can be seen that the results are more accurate for mesh size of 7, but it took reasonably large time to complete the study and it won't be practical to run multiple simulation with this mesh size. Therefore, as a trade off between time and result accuracy, mesh size level 6 is selected as optimal mesh size level. The results are good enough with this mesh size. The results for mass flow rate are negative, this beacause the flow is leaving the boundary.
Simulation study for different valve lift:
To find relation between between valve lift and mass flow rate, a new parametric study is defined. The valve dimension which controls valve lift is choosen as input to the study and input values are defined between the range 0.02mm to 0.04mm for 10 values.This range corresponds to a valve lift of 0 to 2mm. The mesh size level 6 is used for the study. The goals are setuped and study is performed.
The results are as shown below,
The results for mass flow rate are negative, this is because flow is leaving the boundary from that surface(i.e. bottom of the cylinder)
Conclusion:
It can be seen from the results that with increase in valve lift, mass flow rate increase. The change in mass flow rate is large for initial valve lift but then after a point the chnage is very small. From the result, for first valve lift(i.e. Design point 1 to 2), the mass flow rate is increased by 0.0058kg/s and that for the last valve lift(i.e. Design point 9 to 10) is 0.0006kg/s.