Foward Kinematics of a 2R Robotic arm using Python
AIM: To simulate the foward kinematics of a 2R robotic arm using Python
OBJECTIVE:
- To generate plots for each angular position of the 2R robotic arm
- To combine the plots and develop an animation depicting the working area of the robotic arm
INTRODUCTION
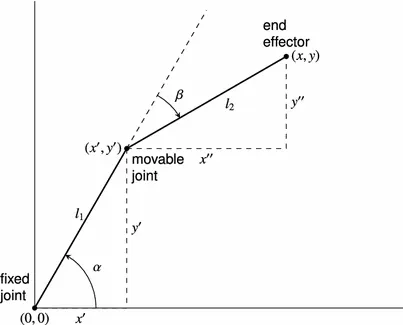
A robotic arm is a programmable electro-mechanical limb, with similar functions to a human arm. The links of a robotic arm are connected by joints allowing either rotational or translatory motion. The links of the manipulator can be considered to form a kinematic chain. The end of the kinematic chain of the manipulator is called the end effector and plays the role that the hand plays in a biological arm.
Robotic arms are posed to play an even greater role in the industrial scene, with the advent of Industry 5.0.
APPLICATIONS
- Thermal spraying
- Material Handling
- Painting
- Drilling
- Welding
- Assembling in assembly lines
- Servicing nuclear powerplants
- Repairing pipelines
- Remote servicing of utility piowerlines
FORMULA USED
- x1 = l1*math.cos(t1)
y1 = l1*math.sin(t1) - x2 = x1+l2*math.cos(t2)
y2 = y1+l2*math.sin(t2)
where
- x1,y1=end point of link 1
- x2,y2=end point of link 2
- l1=length of link 1
- l2=length of link 2
- t1=angle made by link 1 wrt horizontal
- t2=angle made by link 2 wrt horizontal
PROGRAM CODE AND PROCEDURE
Refer comments in the program
import math #importing math module
import matplotlib.pyplot as p #importing module for plotting graphs
import numpy #importing numpy module for using linspace function

n=10 #no of angular positions
start=0 #initial angle
end=math.pi/2 #final angle

theta=numpy.linspace(start,end,n) #a list of 10 angles between the range
print(theta)
ct=1 #counter variable to count and name each plot
for t1 in theta:
	for t2 in theta:
		#Input
		l1 = 1 #length of link 1
		l2 = 0.5 #length of link 2
		#Position coordinates of the Base
		x0 = 0
		y0 =0
		#Position coordinates of the Connector
		x1 = l1*math.cos(t1)
		y1 = l1*math.sin(t1)

		#Position coordinates of the Manipulator
		x2 = x1+l2*math.cos(t2)
		y2 = y1+l2*math.sin(t2)
		filename ="fowkin%01d.png" % ct #naming each subsequent plot

		ct=ct+1 #incrementing the counter variable

		p.figure() #for creating separate plots for each subsequent angle
		p.title("Foward Kinematics of a 2R Robotic arm")#title of the plots

		#plotting points
		p.plot([x0,x1],[y0,y1])
		p.plot([x1,x2],[y1,y2])

		#axis limits for uniformity of all the plots
		p.xlim([0,2])
		p.ylim([0,2])

		p.savefig(filename)#saving each plot
RESULTS AND DISCUSSION
- Hence, using the code given above, we were able to generate plots for each respective angle like the one given below.
- The 100 plots generated, were considered as frames and combined to form a video depicting the working area and foward kinematics of the robotic arm.
***No errors were encountered***
CONCLUSION
A detailed animation, depicting the working of a 2R robotic arm was succesfully, using the program code mentioned above.