FLOW SIMULATION OVER A CYLINDER
AIM: To simulate the flow over a cylinder by calculating the baseline case Reynolds number and then increasing the Reynolds number by a factor of 20%, 40%, and 100%, then run the transient flow simulation.
PROCEDURE:
- Calculate the Reynolds number for baseline simulation using formula
REYNOLDS NUMBER, R = ρVD/μ
ρ = Density of fluid
V = Velocity of fluid
D = Diameter of cylinder
μ = Dynamic viscosity of fluid
Here we have,
ρair = 1.184 kg/m3
Vair = 10 m/s
D = 0.10 m
μair=1.85 *10 -5 kg/m-s
Substituting these values in Reynolds formula we get R = 64000.
- Calculate % increase of baseline Reynolds number and their respective velocities using Reynolds number.
|
% INCREASE |
REYNOLDS NUMBER FOR % INCREASE |
VELOCITY (m/s) |
|
20% |
76800 |
12 |
|
40% |
89600 |
14 |
|
100% |
128000 |
20 |
- Make a sketch of a circle with diameter 0.10 m and extrude it to 0.10 m.
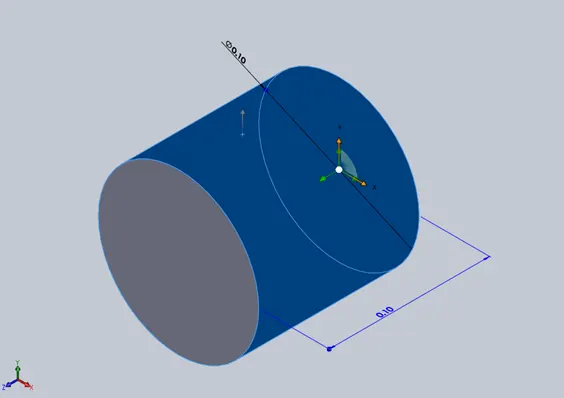
CYLINDER
- Go to Wizard in flow simulation. Select Air as default fluid. Select external in analysis type and select Time-dependent in physical features. Enter Total analysis time by dividing length of computational domain in X-direction (since fluid flow is in X-direction) by velocity and then multiply it by 2. Now enter Output Time Step. Output Time Step denotes the time interval for which the simulation will progress between each step. For example if the length of computational domain is 0.90 m and velocity of fluid is 10 m/s, then Total analysis time is equal to 0.18 seconds and if we divide the Total Analysis Time by 10, Output Time Step is equal to 0.018 seconds.
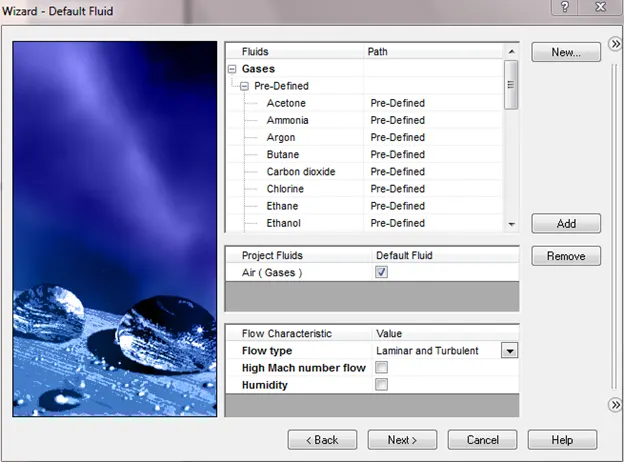
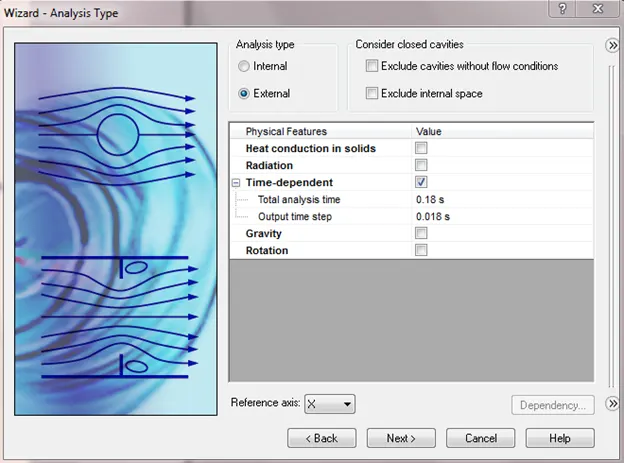
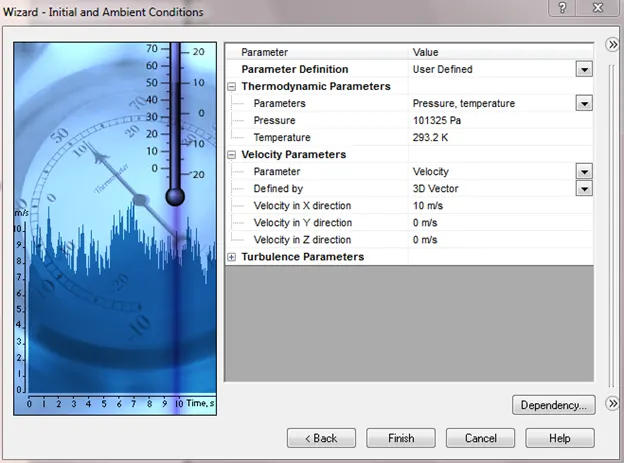
- In Initial Conditions enter the value of velocity of fluid in X-direction equal to 10 m/s and click on finish.
- Generate mesh for the computational domain using global mesh option. Check Advanced Channel Refinement box.
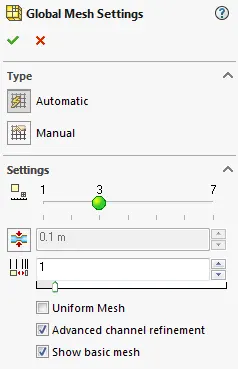
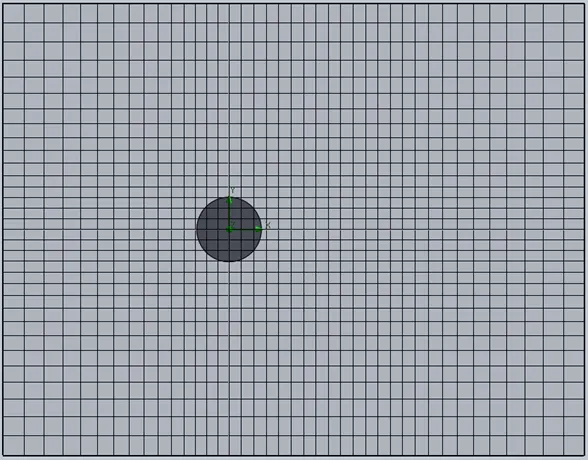
GENERATED MESH
- After meshing run the simulation.
- Make Pressure and Velocity cut plots using cut plots option in the results.
- Use XY plane option and place a plane at an offset distance of 0.05 m i.e. in the center of cylinder. Select Pressure in contours option to make pressure cut plot. Similarly make a velocity cut plot.
- Insert animations using animation option in results.
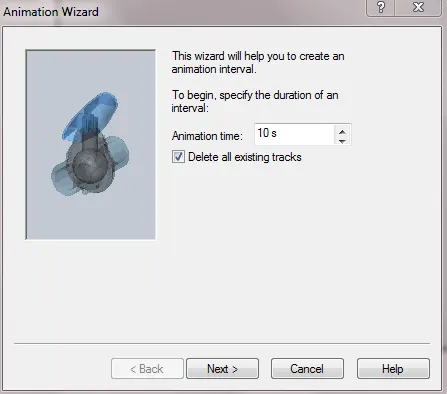
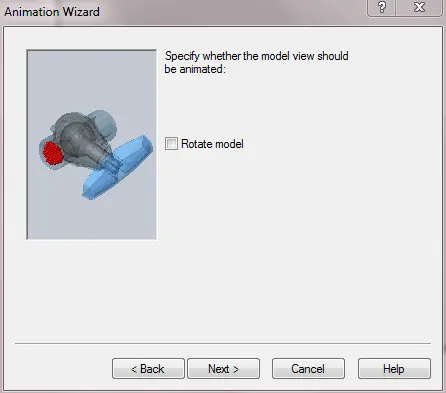
- Click on animation wizard in animation window, enter animation time, and check Delete all Existing Tracks Option to delete all existing control points, uncheck rotate model option, and click on finish. Play the animation.
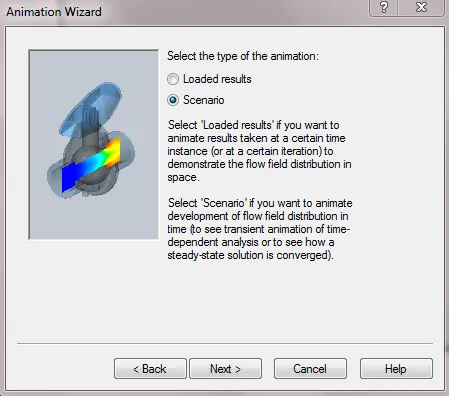
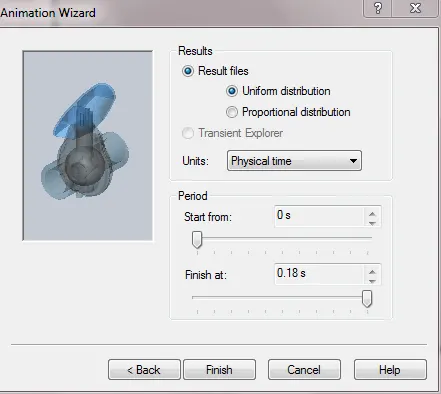
- Repeat the procedure for Reynolds number with 20%, 40%, 100% increase by changing Total Analysis Time, Output time step, and velocity in X-direction.
|
REYNOLDS NUMBER |
VELOCITY (m/s) |
FLOW THROUGH TIME (seconds) |
TOTAL ANALYSIS TIME (seconds) |
|
64000 |
10 |
0.09 |
0.18 |
|
76800 |
12 |
0.075 |
0.15 |
|
89600 |
14 |
0.064 |
0.128 |
|
128000 |
20 |
0.045 |
0.09 |
FLOW THROUGH TIME: It is the time taken by the flow to pass through the domain.
CUT PLOTS:-
- FOR BASELINE CASE,INLET VELOCITY=10ms-1,REYNOLDS NUMBER=64000
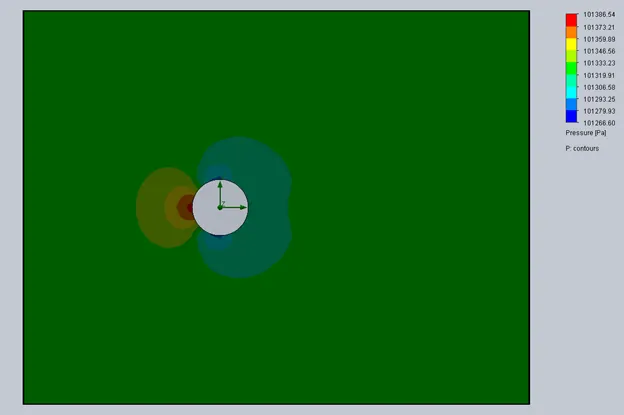
PRESSURE
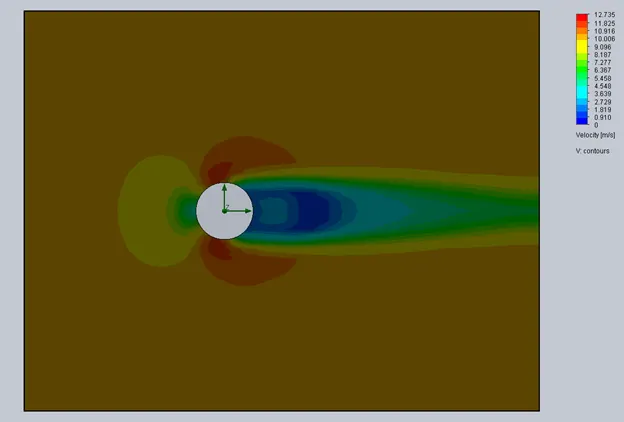
VELOCITY
- FOR 20% INCREASE IN REYNOLDS NUMBER,INLET VELOCITY=12ms-1,REYNOLDS NUMBER=76800
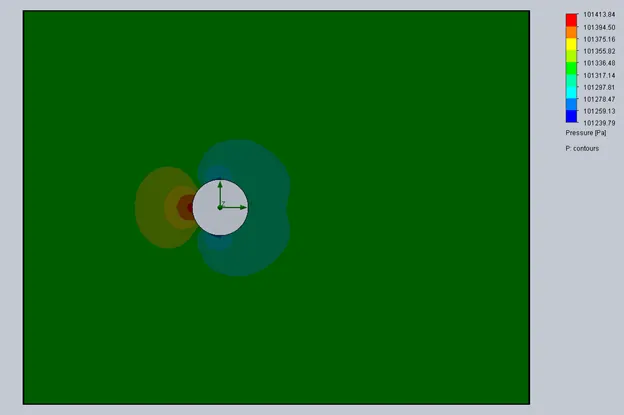
PRESSURE
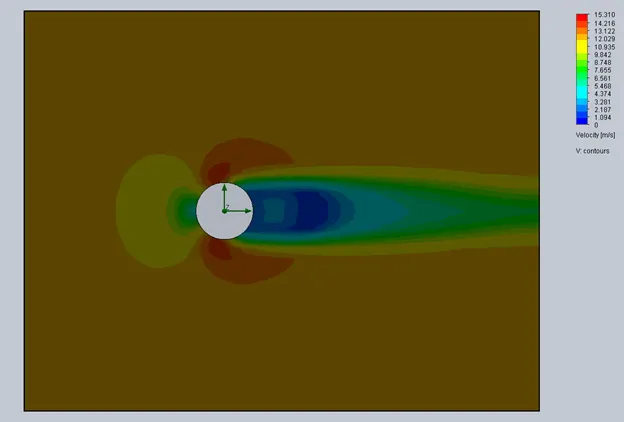
VELOCITY
VELOCITY CUT PLOT ANIMATION
PRESSURE CUT PLOT ANIMATION
- FOR 40% INCREASE IN REYNOLDS NUMBER,INLET VELOCITY=14ms-1,REYNOLDS NUMBER=89600
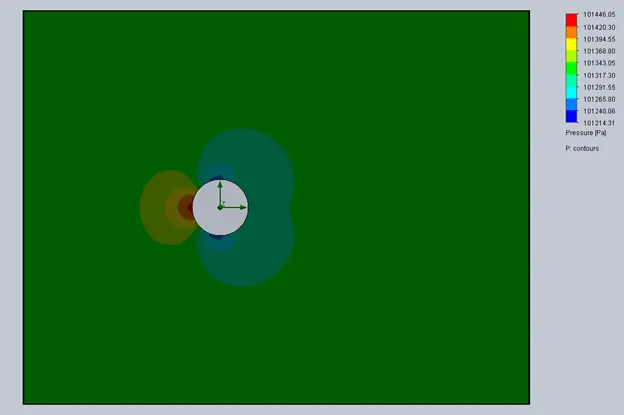
PRESSURE
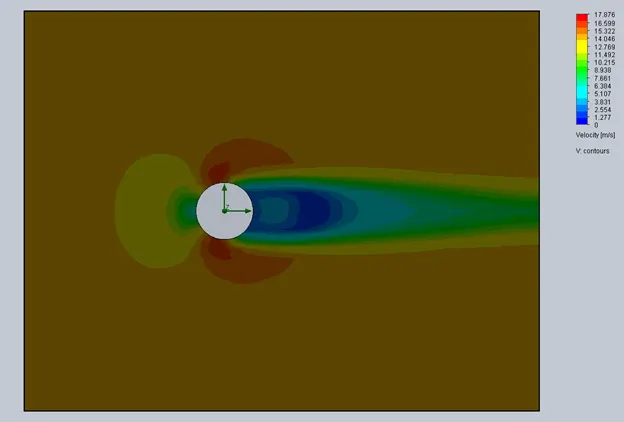
VELOCITY
VELOCITY CUT PLOT ANIMATION
PRESSURE CUT PLOT ANIMATION
- FOR 100% INCREASE IN REYNOLDS NUMBER,INLET VELOCITY=20ms-1,REYNOLDS NUMBER=128000
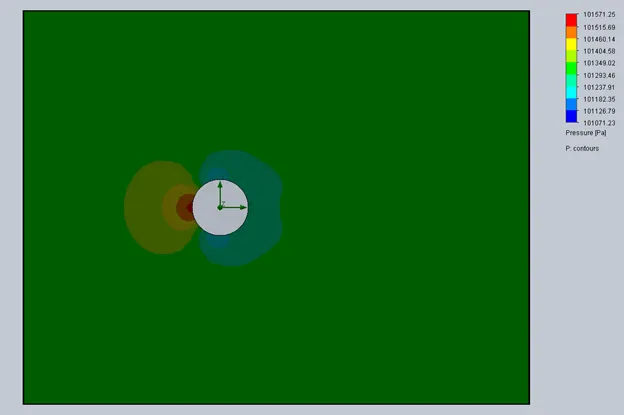
PRESSURE
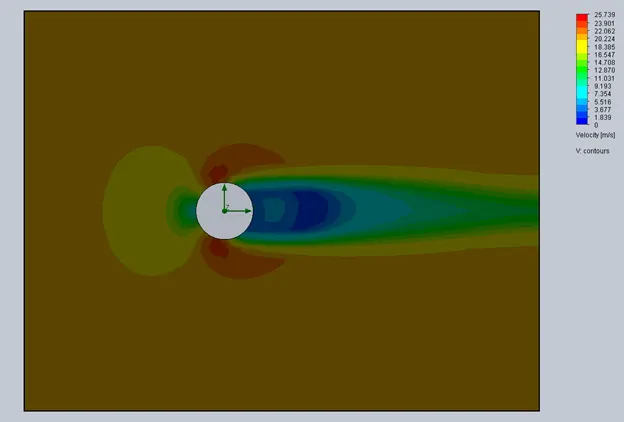
VELOCITY
VELOCITY CUT PLOT ANIMATION
PRESSURE CUT PLOT ANIMATION
CONCLUSION: The above Velocity plots show that as we increase the Reynolds number the Velocity of fluid also increases. The Pressure plots show that pressure decreases as fluid moves in the X-direction of the cylinder i.e. in the direction of flow of fluid whereas the velocity is increasing in the Y-direction of the cylinder.