FLOW OVER AN AIRFOIL
AIM: To model the flow over an airfoil. For the angle of attacks 0,2,4,6,8,10 compare the drag and lift forces.
AIRFOIL: An airfoil or aerofoil is the cross-sectional shape of a wing, blade (of a propeller, rotor or turbine), or sail.
NACA AIRFOIL: The NACA airfoils are airfoil shapes for aircraft wings developed by the National Advisory Committee for Aeronautics (NACA). The shape of the NACA airfoils is described using a series of digits following the word "NACA".
The NACA four-digit wing sections define the profile by:
- First digit describing maximum camber as percentage of the chord.
- Second digit describing the distance of maximum camber from the airfoil leading edge in tenths of the chord.
- Last two digits describing maximum thickness of the airfoil as percent of the chord.
For example, the NACA 2412 airfoil has a maximum camber of 2% located 40% (0.4 chords) from the leading edge with a maximum thickness of 12% of the chord.
The NACA 0015 airfoil is symmetrical, the 00 indicating that it has no camber. The 15 indicates that the airfoil has a 15% thickness to chord length ratio: it is 15% as thick as it is long.
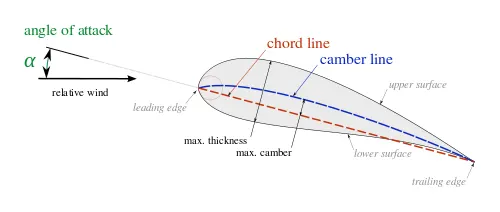
ANGLE OF ATTACK: Angle of Attack is the angle between a reference line on a body (often chord line of the airfoil) and the vector representing the relative motion between the body and the fluid through which it is moving. Since a wing can have twist, a chord line of the whole wing may not be definable, so an alternate reference line is simply defined. Often the chord line of the root of the wing is chosen as the reference line.
CAMBER: Camber is the asymmetry between the two acting surfaces of an airfoil, with the top surface of a wing commonly being more convex. An airfoil that is not cambered is called a symmetric airfoil.
CHORD LENGTH: The chord length is the distance between the trailing edge and the point where the chord intersects the leading edge.
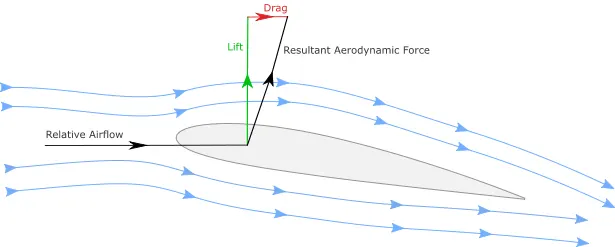
DRAG FORCE: Drag force is the component of the force parallel to the flow direction.
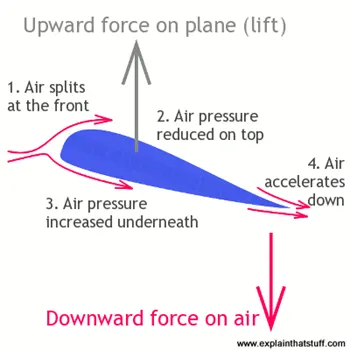
LIFT FORCE: Lift force is the component of the force perpendicular to the flow direction.
PROCEDURE:-
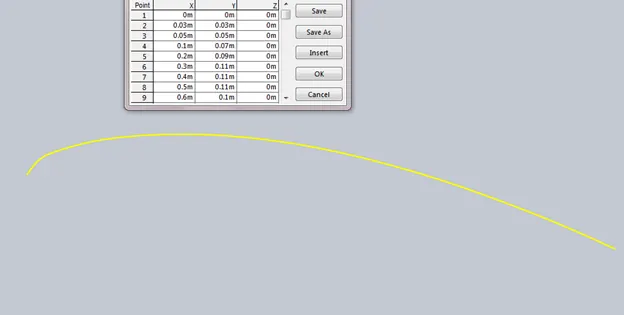
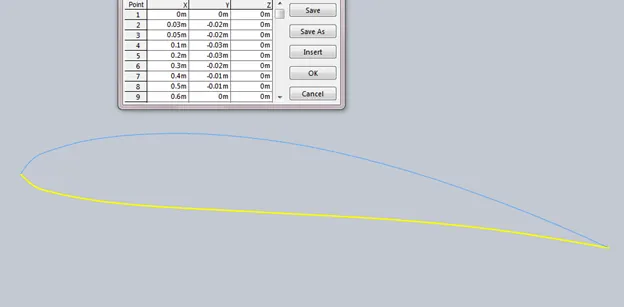
- An airfoil RAF32 is selected from the Airfoil Database. Its first 13 data points are copied and saved to a notepad file. Then the next 13 data points are copied and saved to another notepad file. Enter zero next to ‘Y-axis’ points for Z-axis.

RAF32 AIRFOIL
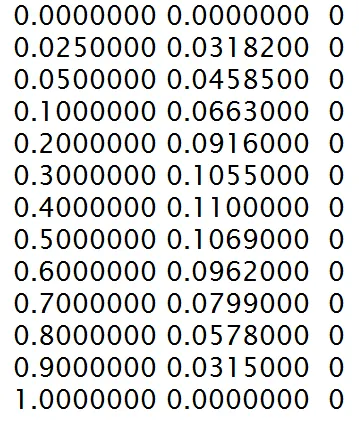
XYZ POINTS OF UPPER SURFACE OF AIRFOIL
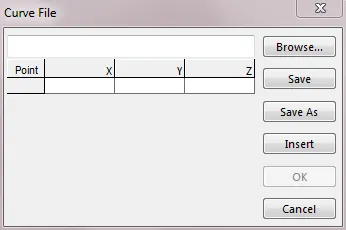
- Open Curve through XYZ points in Solidworks. Click browse and open the saved notepad file. The data points are copied to the curve file. Click OK.
- Repeat step (2) for next 13 XYZ points.
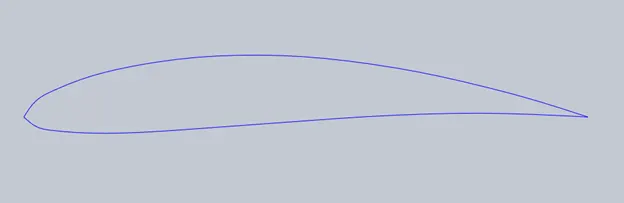
- Convert the curve into a 2D sketch using convert entities option.
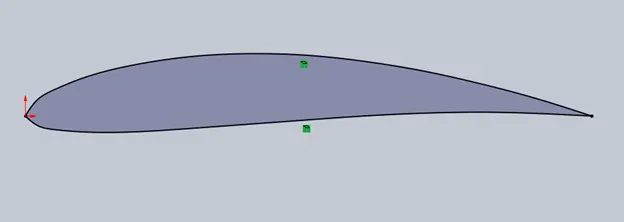
- Go to rotate entities to change the angle of attacks (if any).
- Extrude it to 0.2 m.
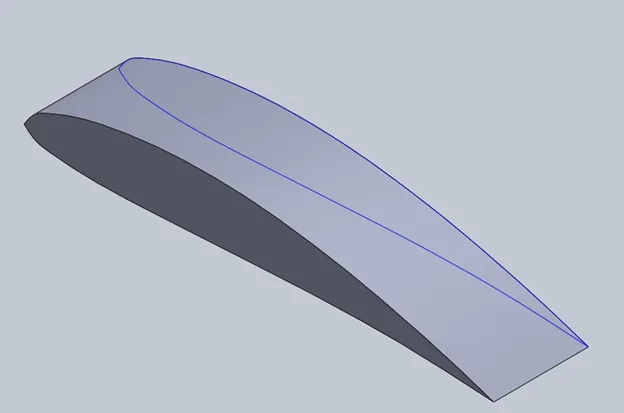
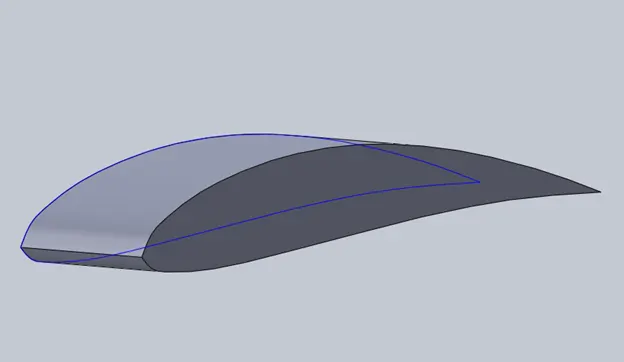
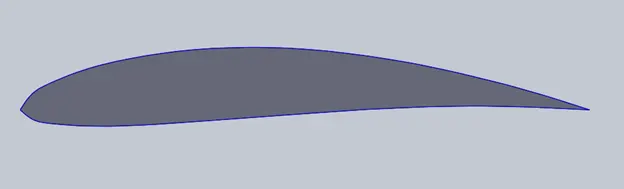
AIRFOIL AT ZERO ANGLE OF ATTACK
- Go to flow simulation wizard, select air as default fluid, and enter total analysis time and step time.
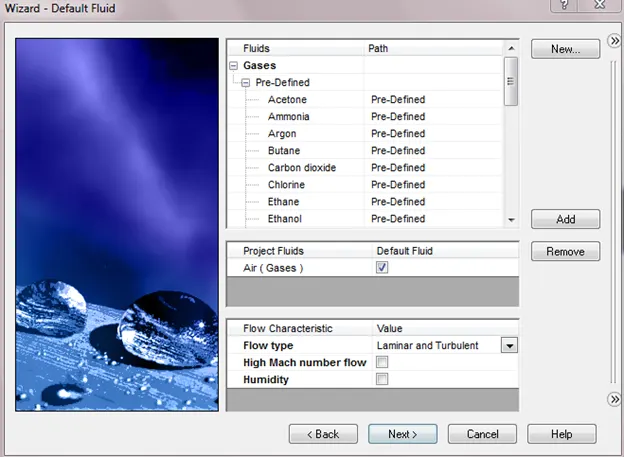
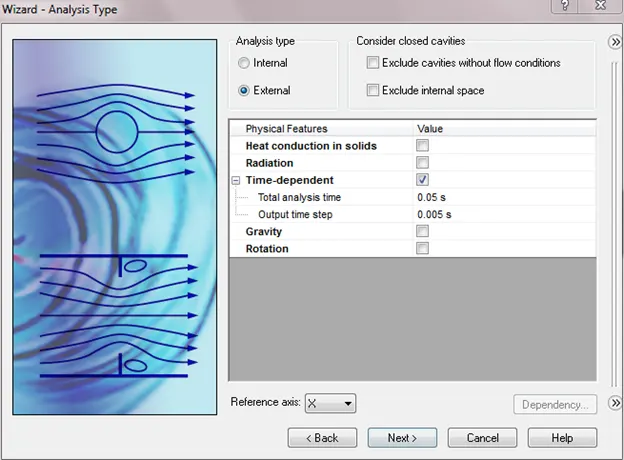
- Here total analysis time 0.05 seconds which is calculated using formula (computational domain length/velocity of fluid)*2.End time is 0.005 seconds (total analysis time divided into 10 parts).
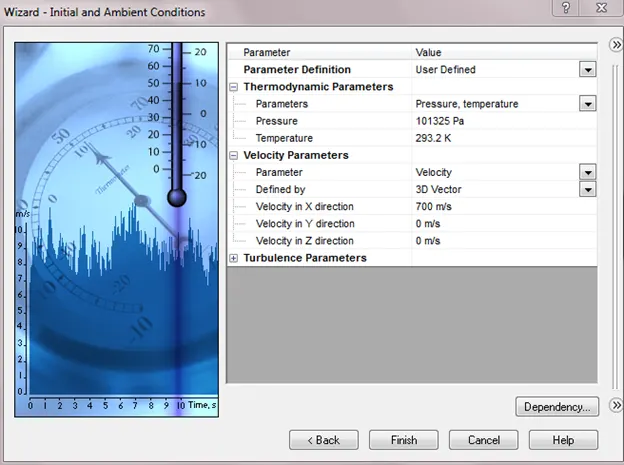
- Enter the velocity in X-direction.
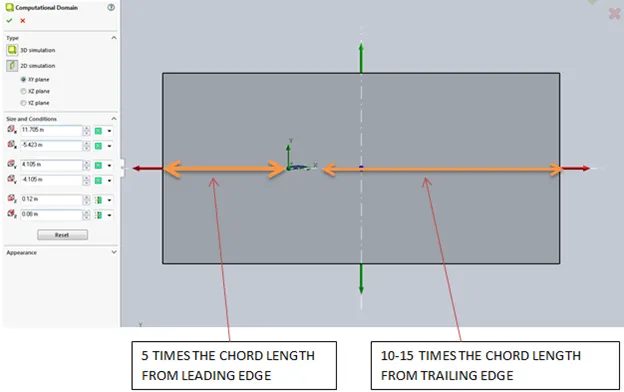
- Edit the computational domain. Set computational domain type to 2D.Select XY plane. Increase the size of computational domain in X and Y axes. The inflow for the airfoil should be 5 times the chord length and outflow should be 10-15 times the chord length.
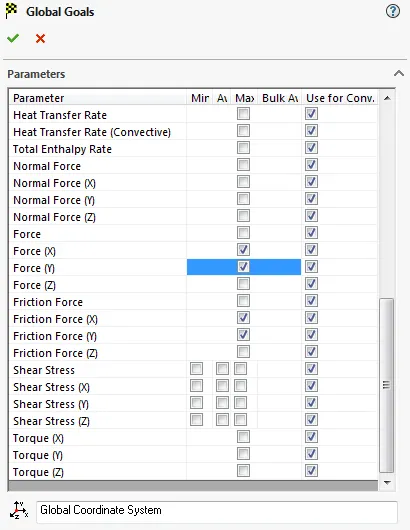
- Insert global goals by checking boxes of average Force(X) and Force(Y).Also check friction forces X and Y.
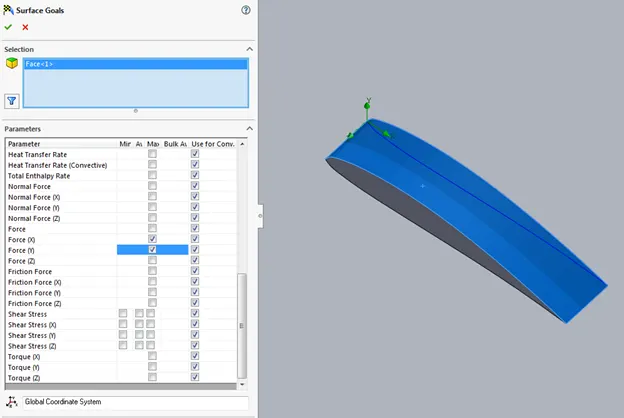
- Insert surface goals by selecting the surface of airfoil and Forces in X and Y direction.
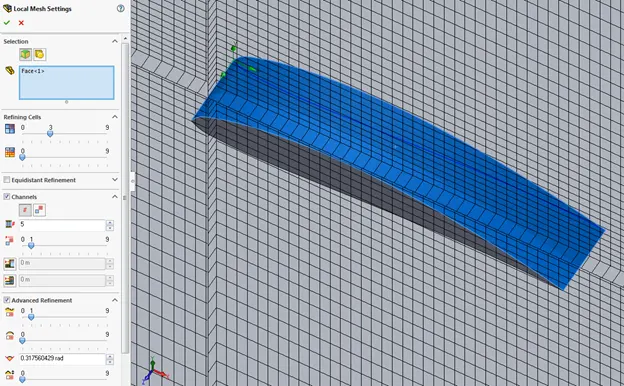
- Insert local mesh in addition to global mesh by clicking on insert local mesh option. Select airfoil surface and refine the level of fluid cells.
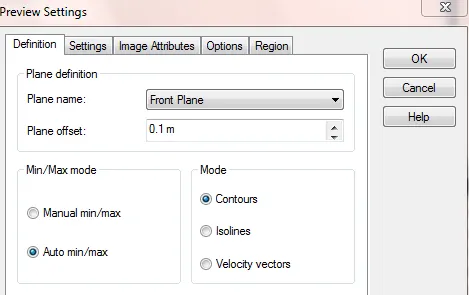
- Run the simulation. In the solver go to insert. Click preview. Select contours and click OK to view Pressure dialog box.
- Go to goal plot in insert. Select surface goal force Y (SG Force Y 1).Click OK to view SG Force in Y direction or lift force plot.
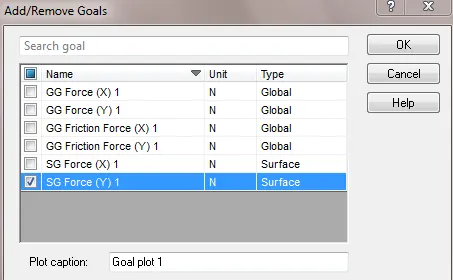
- Run the simulation until the there is no change in lift force or progress reaches 100%.Stop the simulation when there is no change in lift force or progress reaches 100% and save the results.
- Go to cut plots to insert cut plots of pressure and velocity.
- Use goal plots to show plots for forces in X and Y directions.
- Repeat the same procedure till step (18) for angle of attack at 2, 4, 6, 8, 10 degrees.
RESULTS
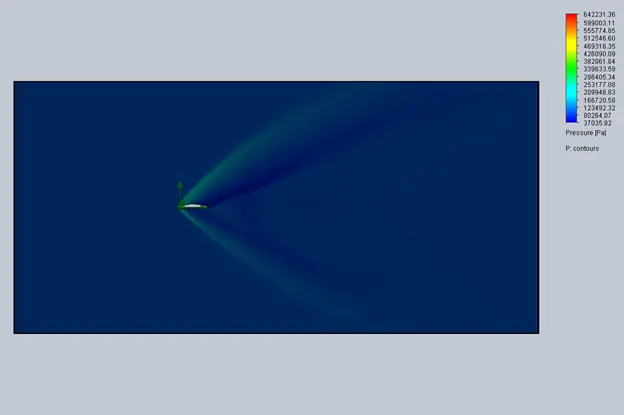
PRESSURE CUT PLOT OF AIRFOIL AT 0 ⁰ AoA
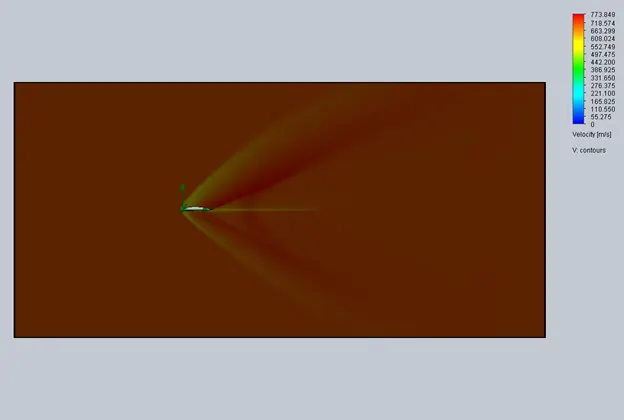
VELOCITY CUT PLOT OF AIRFOIL AT 0 ⁰ AoA
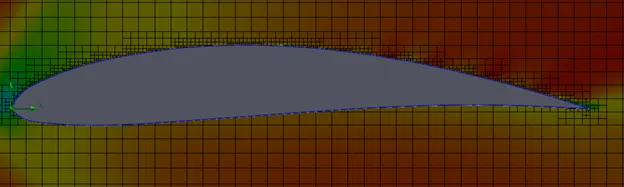
LOCAL MESH ALONG THE SURFACE OF AIRFOIL AT ZERO ANGLE OF ATTACK

DRAG FORCE AND LIFT FORCE VALUES OF AIRFOIL AT ZERO ANGLE OF ATTACK
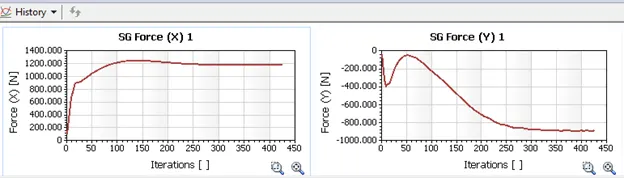
DRAG FORCE (X) AND LIFT FORCE (Y) v/s ITERATIONS PLOT OF AIRFOIL AT ZERO ANGLE OF ATTACK
OBSERVATIONS: The above plots show that the drag force increases to a maximum value of 1251 N at iteration no. 136 and then becomes constant at 1180 N after iteration no. 350.Similarly the lift force has a value of about 888 N. The Lift force first decreases to -400 N, then increases to -54.55 N at iteration no. 48.The lift force again starts decreasing till it becomes constant at -888 N.
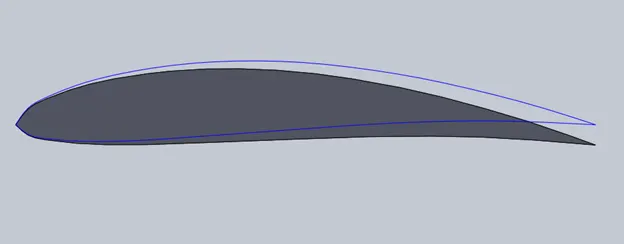
AIRFOIL AT 2 ⁰ ANGLE OF ATTACK
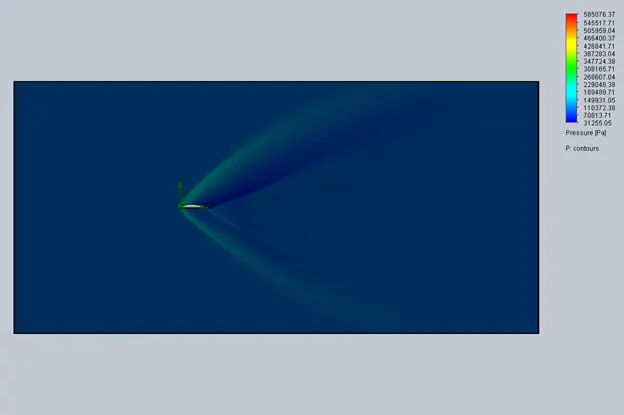
PRESSURE CUT PLOT AT 2 ⁰ AoA
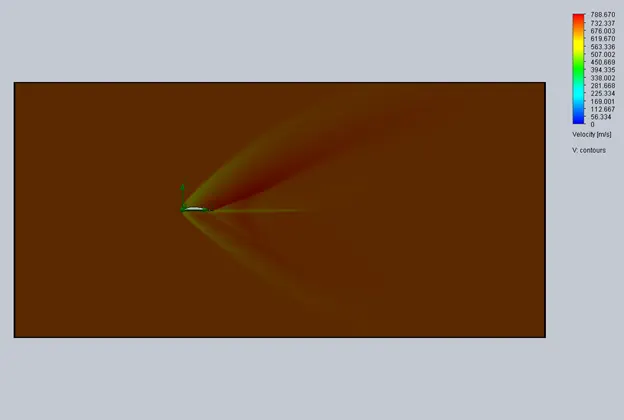
VELOCITY CUT PLOT AT 2 ⁰ AoA

DRAG FORCE AND LIFT FORCE VALUES OF AIRFOIL AT 2 ⁰ ANGLE OF ATTACK
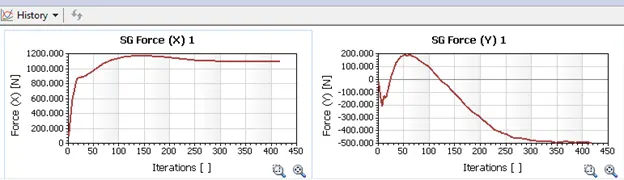
DRAG FORCE (X) AND LIFT FORCE (Y) v/s ITERATIONS PLOT OF AIRFOIL AT 2 ⁰ ANGLE OF ATTACK
OBSERVATIONS: In this case the drag force is 1100 N. The curve follows the same path as in case of zero angle of attack. But the lift force (492.76 N) has increased as compared to lift force values at zero angle of attack which was 888 N approximately.
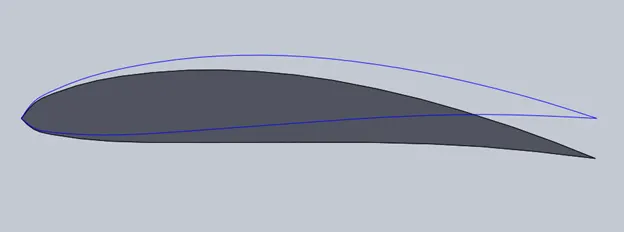
AIRFOIL AT 4 ⁰ ANGLE OF ATTACK
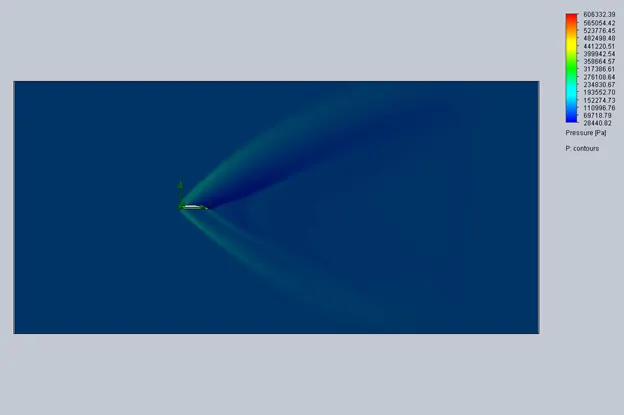
PRESSURE CUT PLOT OF AIRFOIL AT 4 ⁰ ANGLE OF ATTACK
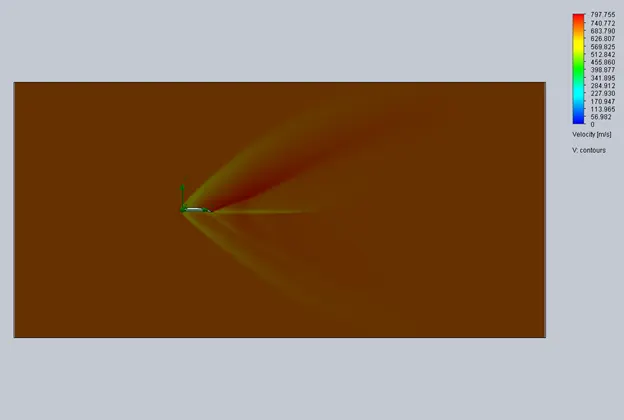
VELOCITY CUT PLOT OF AIRFOIL AT 4 ⁰ ANGLE OF ATTACK

DRAG FORCE AND LIFT FORCE VALUES OF AIRFOIL AT 4 ⁰ ANGLE OF ATTACK
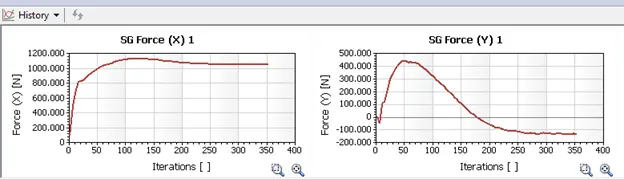
DRAG FORCE (X) AND LIFT FORCE (Y) v/s ITERATIONS PLOT OF AIRFOIL AT 4 ⁰ ANGLE OF ATTACK
OBSERVATIONS: Here the drag force has decreased from 1100 N to 1058.66 N.The lift force decreases to the value -41.7 N at iteration no. 7 but after that it increases to a value of 442.56 N at iteration no. 47.It starts decreasing and becomes constant at -130 N approx. after iteration no. 330.
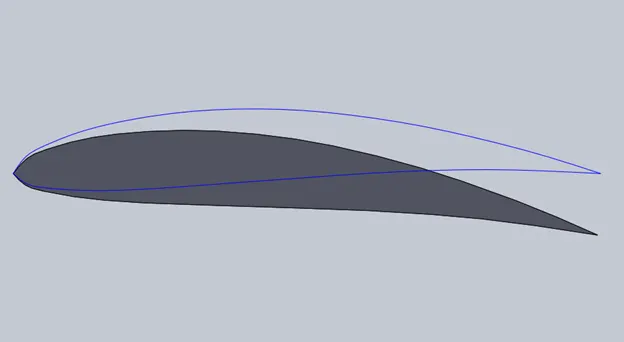
AIRFOIL AT 6 ⁰ ANGLE OF ATTACK
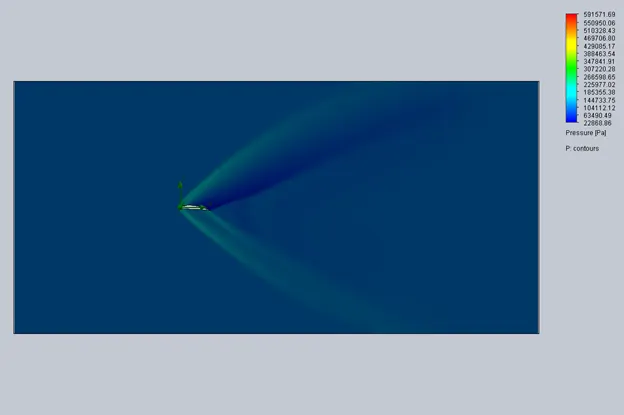
PRESSURE CUT PLOT OF AIRFOIL AT 6 ⁰ ANGLE OF ATTACK
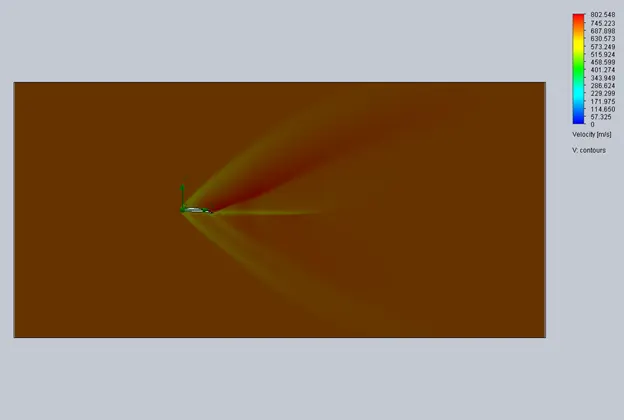
VELOCITY CUT PLOT OF AIRFOIL AT 6 ⁰ ANGLE OF ATTACK

DRAG FORCE AND LIFT FORCE VALUES OF AIRFOIL AT 6 ⁰ ANGLE OF ATTACK
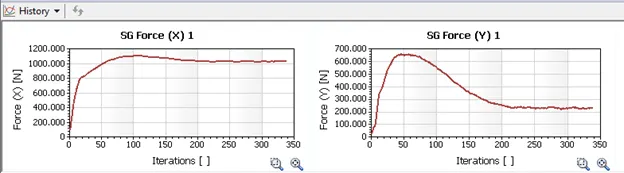
DRAG FORCE (X) AND LIFT FORCE (Y) v/s ITERATIONS PLOT OF AIRFOIL AT 6 ⁰ ANGLE OF ATTACK
OBSERVATIONS: In this case the drag force decreases to a average value of 1030.9 N from 1058.66 N.The lift force starts increasing from the first iteration (23.31 N) and increases up to a value of 661.34 N. It starts decreasing after that and becomes constant at 248 no. iteration with a value of 230.94 N.
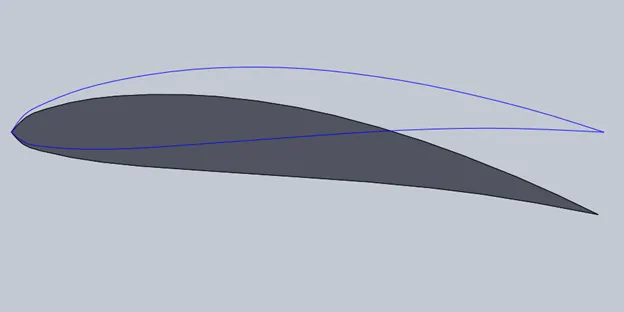
AIRFOIL AT 8 ⁰ ANGLE OF ATTACK
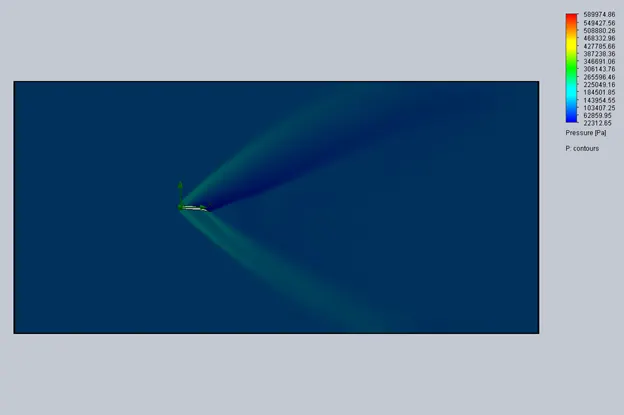
PRESSURE CUT PLOT OF AIRFOIL AT 8 ⁰ ANGLE OF ATTACK
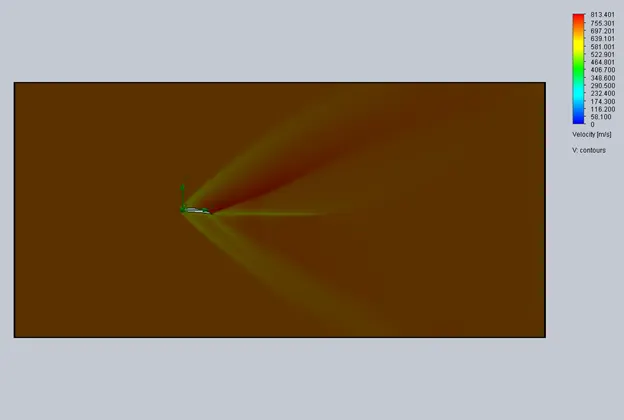
VELOCITY CUT PLOT OF AIRFOIL AT 8 ⁰ ANGLE OF ATTACK

DRAG FORCE AND LIFT FORCE VALUES OF AIRFOIL AT 8 ⁰ ANGLE OF ATTACK
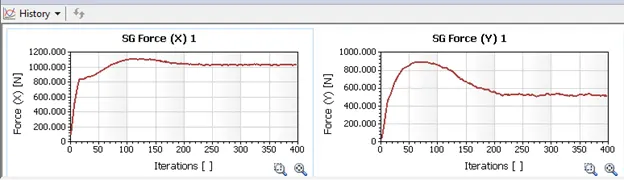
DRAG FORCE (X) AND LIFT FORCE (Y) v/s ITERATIONS PLOT OF AIRFOIL AT 8 ⁰ ANGLE OF ATTACK
OBSERVATIONS: Here the drag force increases as compared to angle of attack 6 ⁰ from avg. value of 1030.9 N to 1034.07 N. Maximum value of lift force is at iteration no. 75 with a value of 894.27 N. The lift force becomes almost constant at iteration no. 397 with a value of 512.39 N.
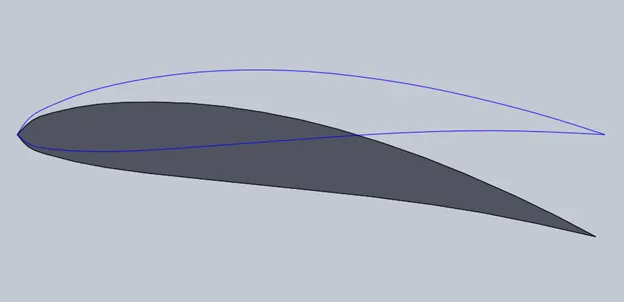
AIRFOIL AT 10 ⁰ ANGLE OF ATTACK
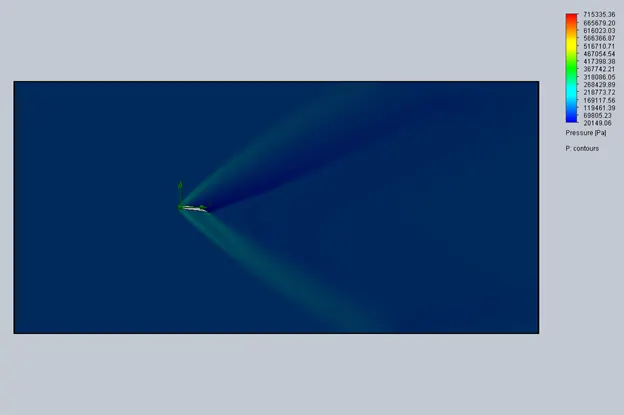
PRESSURE CUT PLOT OF AIRFOIL AT 10 ⁰ ANGLE OF ATTACK
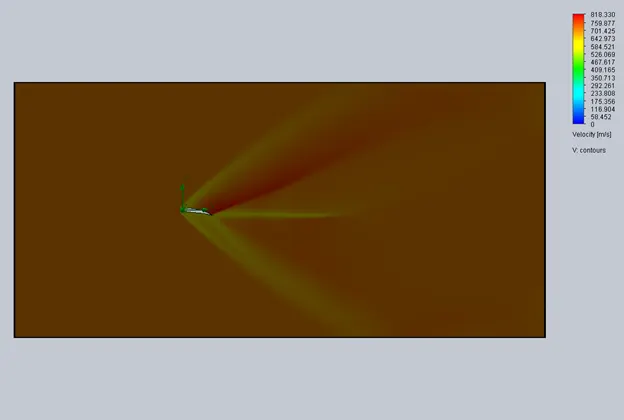
VELOCITY CUT PLOT OF AIRFOIL AT 10 ⁰ ANGLE OF ATTACK

DRAG FORCE AND LIFT FORCE VALUES OF AIRFOIL AT 10 ⁰ ANGLE OF ATTACK
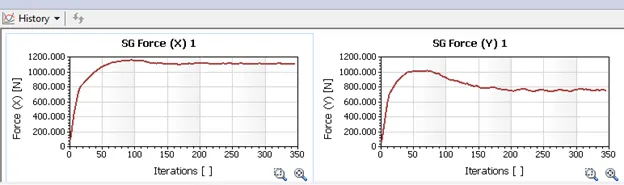
DRAG FORCE (X) AND LIFT FORCE (Y) v/s ITERATIONS PLOT OF AIRFOIL AT 10 ⁰ ANGLE OF ATTACK
OBSERVATIONS: Here the drag force increase to an avg. value of 1114.418 N by increasing the angle of attack to 10 ⁰. Maximum lift force is gained at iteration no. 72 with a value of 1019.17N. The lift force becomes almost constant after iteration no. 330 with a value between 760 N to 757 N.
CONCLUSION: -
The pressure below the airfoil is increasing as the angle of attack of airfoil increases from 0⁰ to 10⁰. The velocity above the airfoil is more as compared to velocity below the airfoil with increasing angle of attack.The region of velocity behind trailing edge is getting thicker and longer as the angle of attack increases.
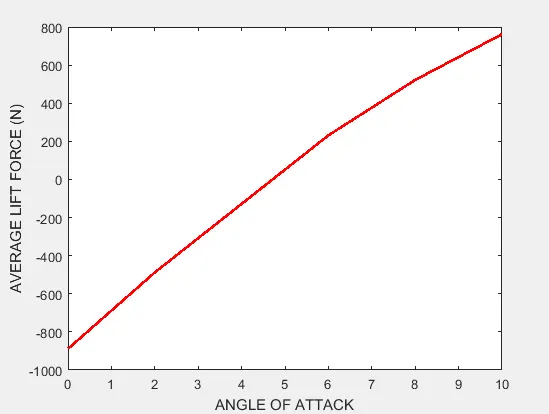
The avg. lift force increases with the increase in angle of attack from 0⁰ to 10⁰ in RAF32 airfoil.
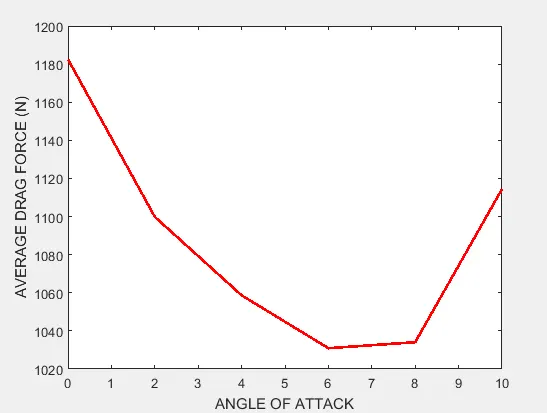
The above plot shows that the avg. drag force decreases till the airfoil reaches 6⁰ angle of attack. The avg. drag force starts increasing after 6⁰ attack angle and increases sharply after 8⁰ attack angle.
REFERENCES:-
1) Wikipedia
2) Google images