PIPE FLOW SIMULATION
AIM : To run a pipe flow simulation with Reynolds number 100,1000,10000 and compare velocity profiles by placing line probes at 95%,90% and 85% of the pipe length.
PROCEDURE : First of all calculate the velocity of fluid in pipe with Reynolds number 100,1000,10000 respectively.
|
FLOW CONDITION |
REYNOLDS NUMBER FOR PIPE FLOW |
|
LAMINAR FLOW |
Reynolds number Less than or equal to 2000 |
|
TRANSITIONAL FLOW |
2000< Reynolds number <4000 |
|
TURBULENT FLOW |
Reynolds number>4000 |
REYNOLDS NUMBER, R = ρVD/μ
ρ = Density of fluid
V = Velocity of fluid
D = Internal diameter of pipe
μ=Dynamic viscosity
Here we have,
ρ = 997 kg/mᶟ
D = 0.05 m
μ = 8.9*10‐ᶾ N-sec/m²
CALCULATING VELOCITY FOR DIFFERENT REYNOLDS NUMBER :-
|
REYNOLDS NUMBER |
VELOCITY |
|
100 |
0.0017 m/s |
|
1000 |
0.0178 m/s |
|
10000 |
0.178 m/s |
Now, make a circle of dia. 0.05 m using sketch command and extrude it to 1 m.Use shell command to make a pipe of thickness 0.001 m.
Place line probes at at 95%, 90% and 85% of the pipe length as shown in the images.
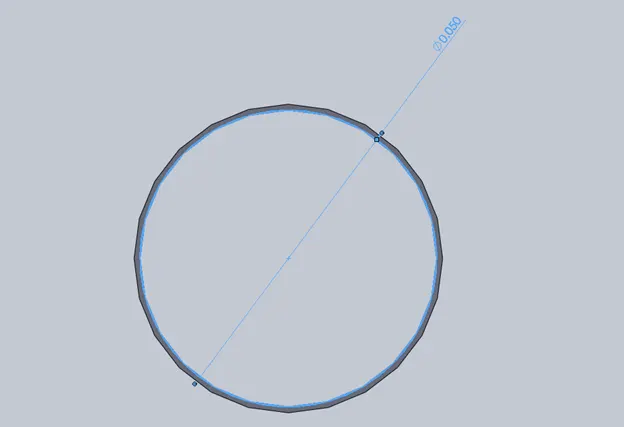
PIPE WITH INTERNAL DIA. 0.05 m
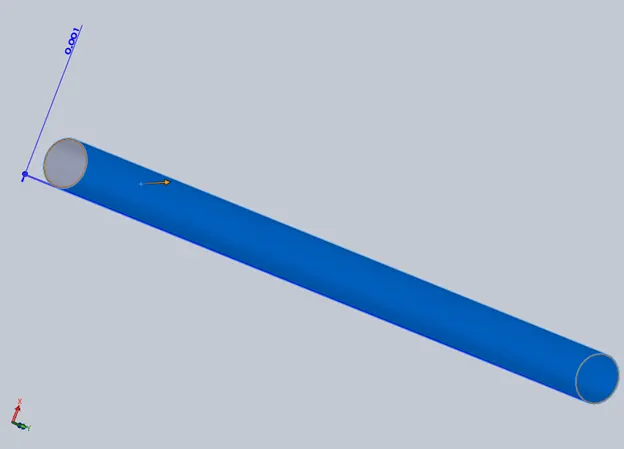
PIPE THICKNESS 0.001 m
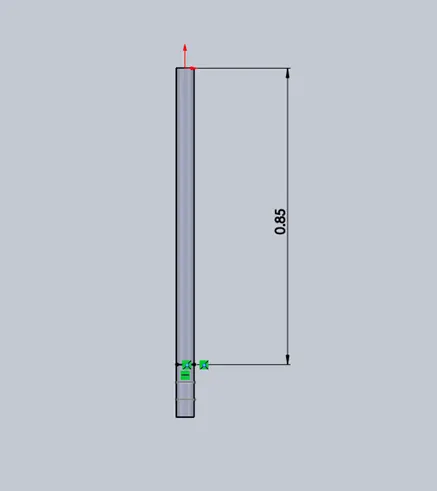
LINE PROBE PLACED AT 85% OF TOTAL LENGTH OF PIPE
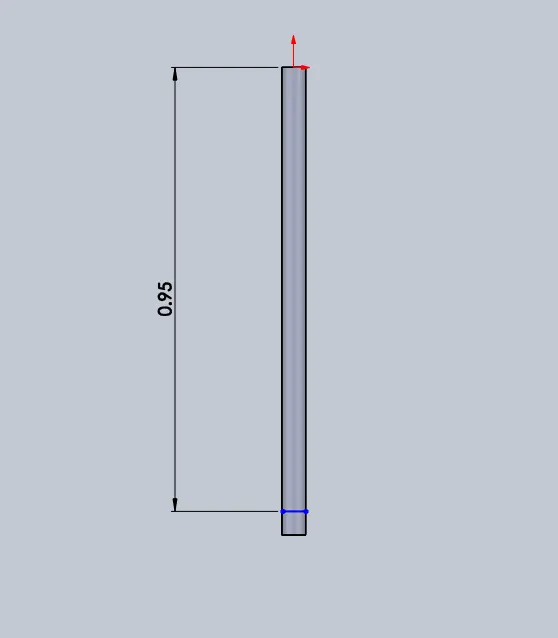
LINE PROBE PLACED AT 95% OF TOTAL LENGTH OF PIPE
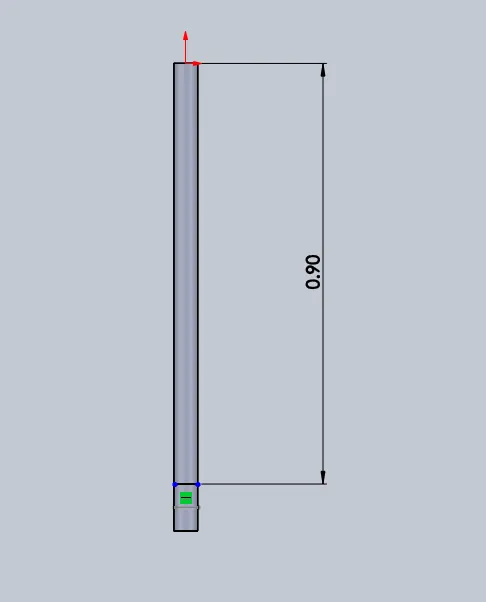
LINE PROBE PLACED AT 90% OF TOTAL LENGTH OF PIPE
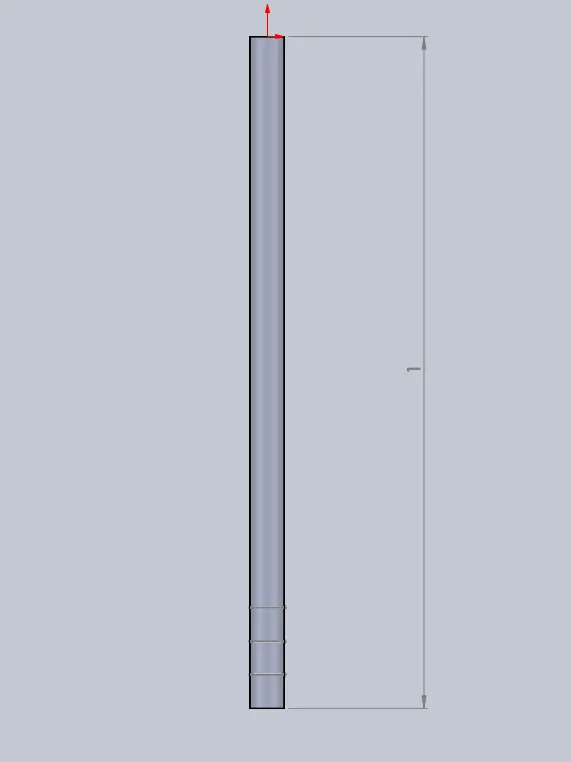
TOTAL LENGTH OF PIPE 1m
Now go to the flow simulation option to run a pipe flow simulation.First of all create lids on both ends of pipe because solidworks calculates internal volume of pipe.So by using ‘create lids’ option create lids on the both ends of pipe.
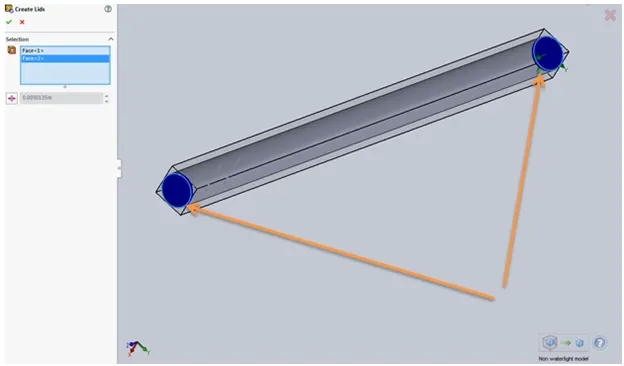
BLUE COLOUR SHOWS LIDS ON BOTH ENDS OF PIPE
Then go to the wizard option to select the default fluid properties. In this case default fluid is water.
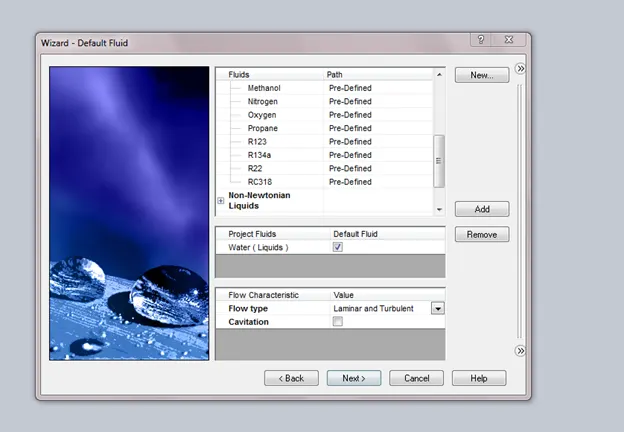
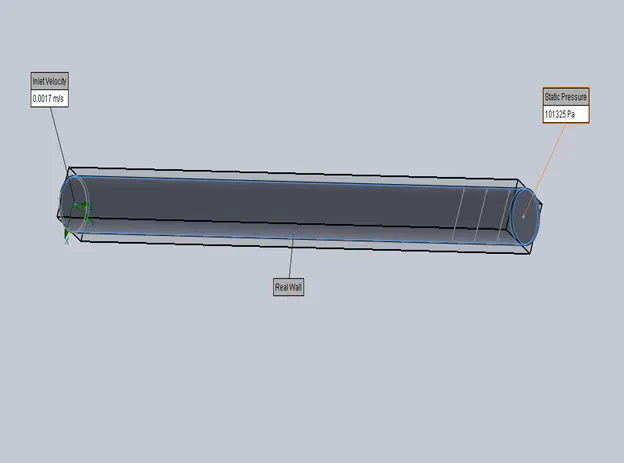
Now, in input data go to boundary conditions and click insert. Select the face for inlet velocity and enter the inlet velocity i.e. 0.0017 m/s and click OK.Similarly select the faces for real wall and static pressure.
In the next step, go to the global mesh option and set mesh settings according to mesh type i.e. automatic or manual.In manual type user can set mesh in X,Y,Z directions.
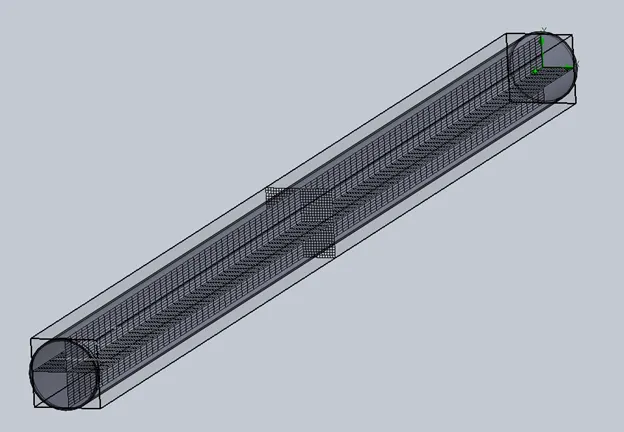
MESH
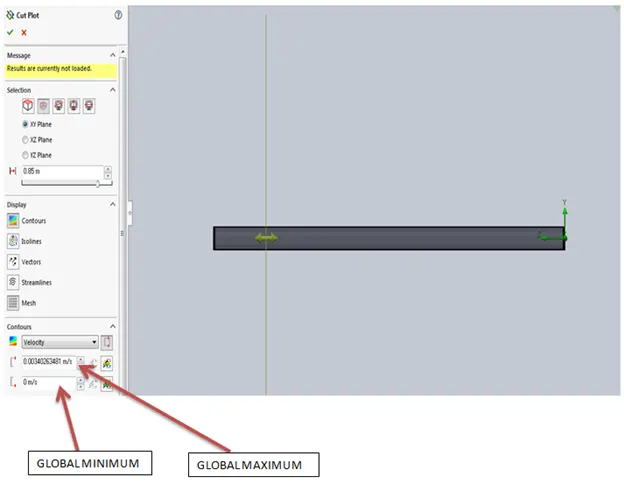
After mesh setup use cut plots option in the results to place planes at 95%, 90% and 85% of the pipe length. Also select global max. and global min. for velocity in contours. Similarly create cut plots at 95% and 90% of pipe length.
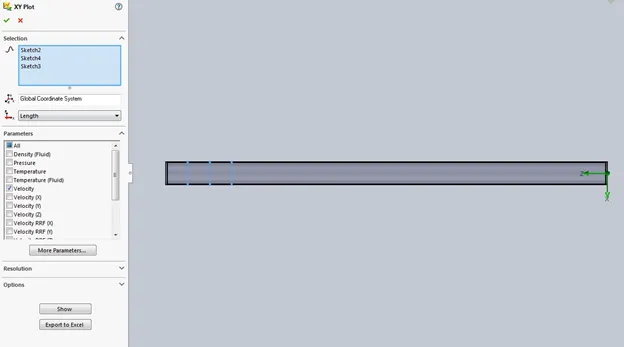
To make XY Plots select the sketches for comparing velocity or any other parameter from the given parameters and click OK.
PARAMETRIC STUDY
Now go to new parametric study option by right clicking on the the project name. Add simulation parameter(s) like velocity normal to face,static pressure from input variables, add results like cut plots and XY plots from output parameters. Click on scenario to for design points and enter values for design points (velocity in this case).Run the parametric study. Results will be displayed after calculations.
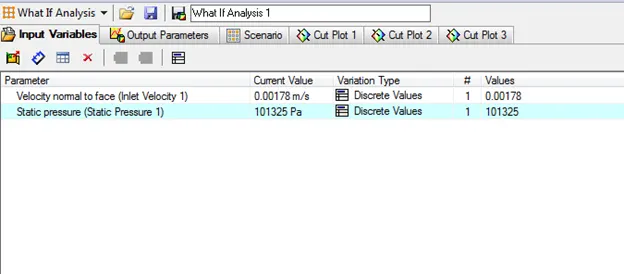
RESULTS OF PARAMETRIC STUDY:-
a. CUT PLOTS
1. AT Re=100 & VELOCITY=0.0017 m/s
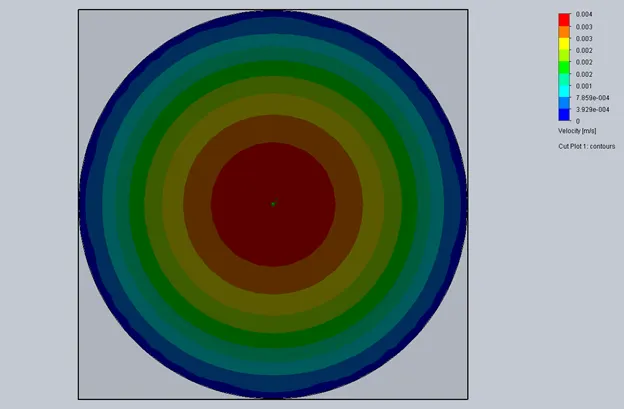
VELOCITY AT 85% OF PIPE LENGTH
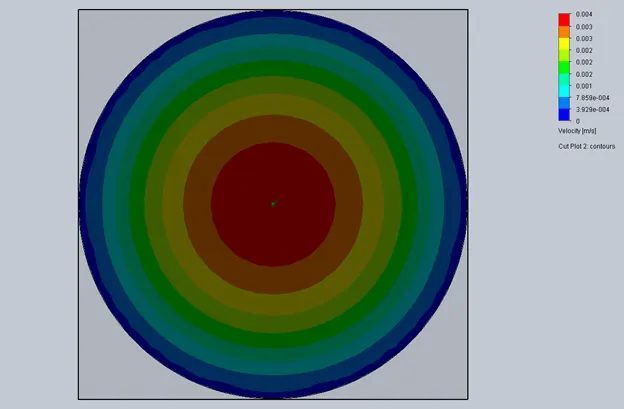
VELOCITY AT 90% OF PIPE LENGTH
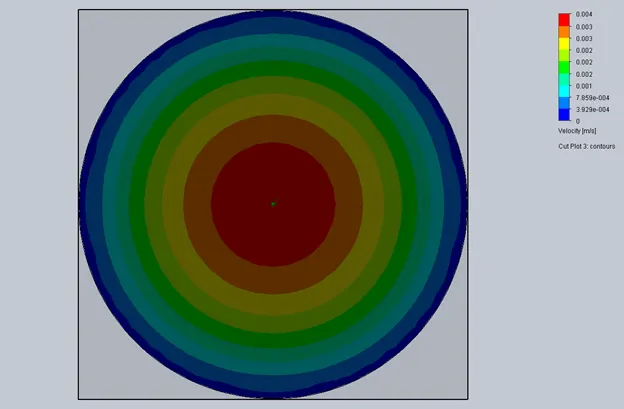
VELOCITY AT 95% OF PIPE LENGTH
2. AT Re=1000 & VELOCITY=0.0178 m/s
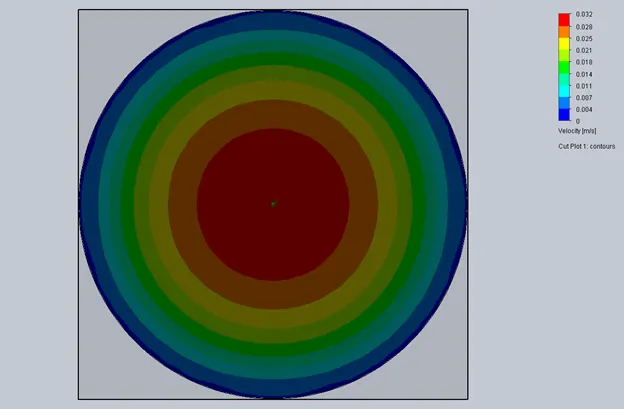
VELOCITY AT 85% OF PIPE LENGTH
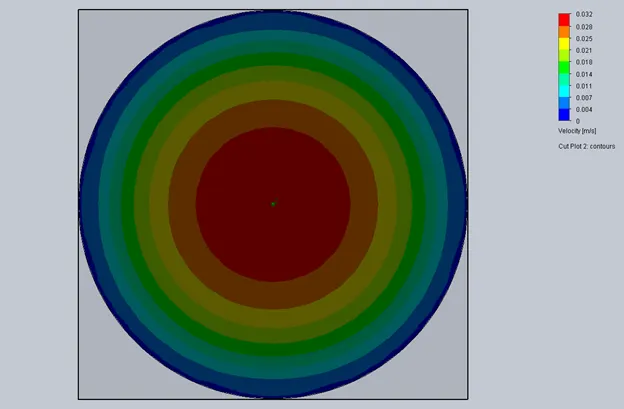
VELOCITY AT 90% OF PIPE LENGTH
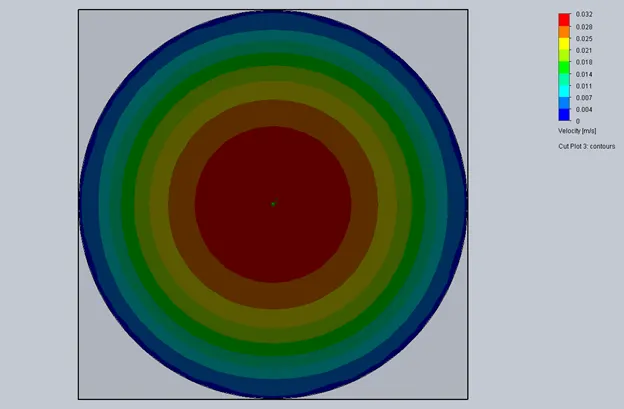
VELOCITY AT 95% OF PIPE LENGTH
3. AT Re=10000 & VELOCITY=0.178 m/s
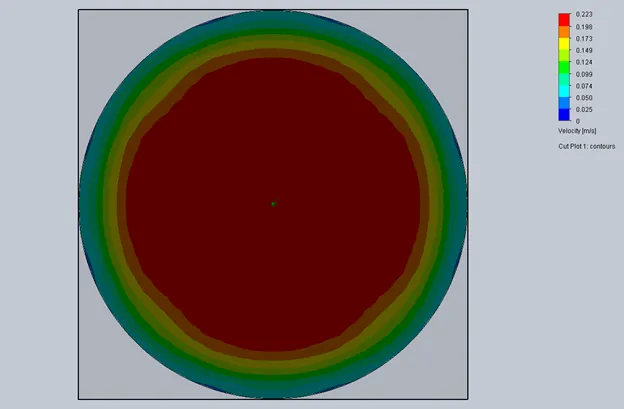
VELOCITY AT 85% OF PIPE LENGTH
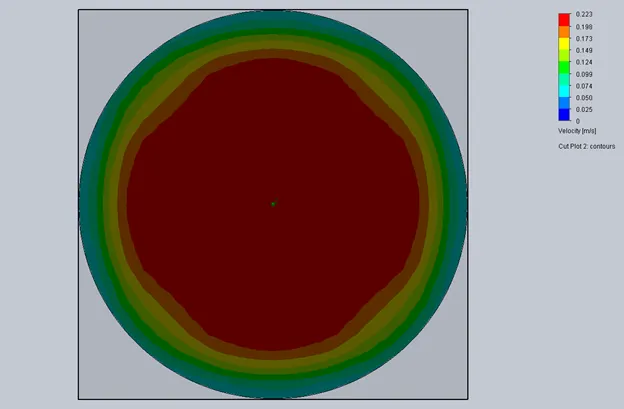
VELOCITY AT 90% OF PIPE LENGTH
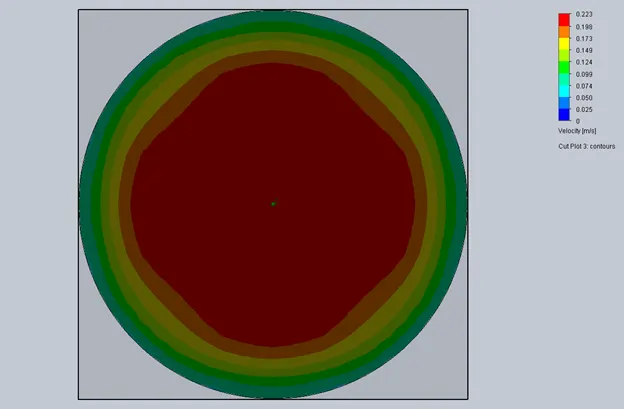
VELOCITY AT 95% OF PIPE LENGTH
b. XY PLOT
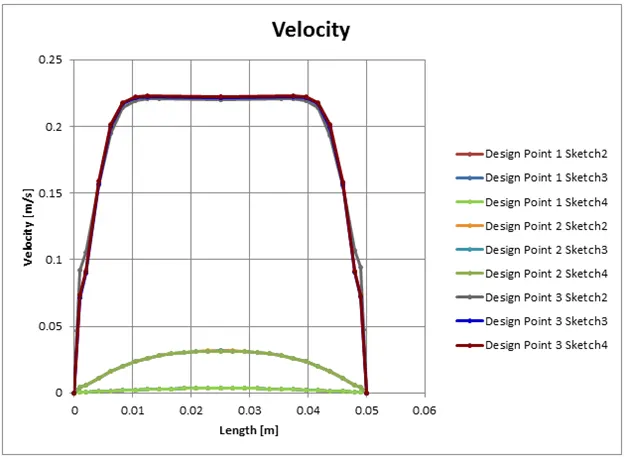
XY PLOT WITH VELOCITY COMPARISON OF LINE PROBES PLACED AT DIFFERENT LENGTHS OF PIPE
- LEGEND DESCRIPTION
- Sketch2 is at 0.95m of the length of pipe
- Sketch4 is at 0.90m of the length of pipe
- Sketch3 is at 0.85m of the length of pipe
- DESIGN POINTS
- Design point 1 is the point where the inlet velocity is equal to 0.00178 m/s.
- Design point 2 is the point where the inlet velocity is equal to 0.0178 m/s.
- Design point 3 is the point where the inlet velocity is equal to 0.178 m/s.

OBSERVATION:-
The above XY PLOT shows that when boundary condition i.e. the inlet velocity is 0.178 m/s, the max. velocity is approx. 0.222 m/s at 0.025 m pipe length for design point 3 whereas in case of design point 1 & design point 2 the max. velocity is 0.0312 m/s at 0.025 m pipe length.
CONCLUSION:-
In the above cut plots we can see that as the Reynolds number is increasing, which also has an effect on velocity of fluid, difference in velocities can be seen.In pipe flow the fluid particles in the layer in contact with the wall of of the pipe become stationary.This layer also causes the fluid particles in adjacent layers to slow down gradually as a result of friction.To make up for the velocity reduction near the pipe wall, the velocity of the fluid at the mid-section of the pipe has to increase to keep the mass flow rate through the pipe constant.As a result, a velocity gradient develops along the pipe.The velocity profile in case of turbulent flow is much flatter. The velocity profile becomes more flat at higher Reynolds number as we can see from XY PLOT.The velocity profile in the fully developed region is parabolic in laminar flow and much flatter in turbulent flow due to more vigorous mixing in the radial direction.
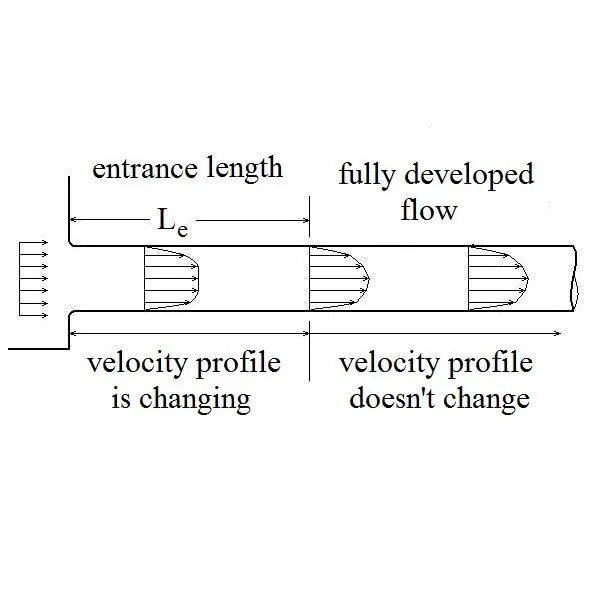
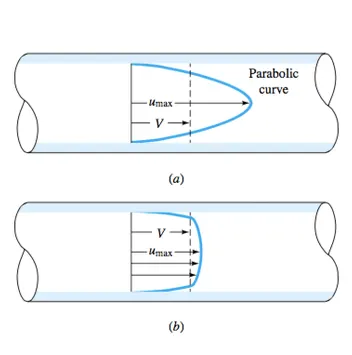
COMPARISON OF LAMINAR AND TURBULENT PIPE-FLOW VELOCITY PROFILES FOR THE SAME VOLUME FLOW (a) LAMINAR FLOW (b) TURBULENT FLOW