Centrifugal pump design and analysis using SolidWorks
Centrifugal pump design and analysis
AIM :
Create a basic model of Centrifugal Pump, and a parametric study is made with different velocity conditions to obtain the Performance diagram. Obtain the relationship between Pressure Ratio and mass flow rate.
THEORY :
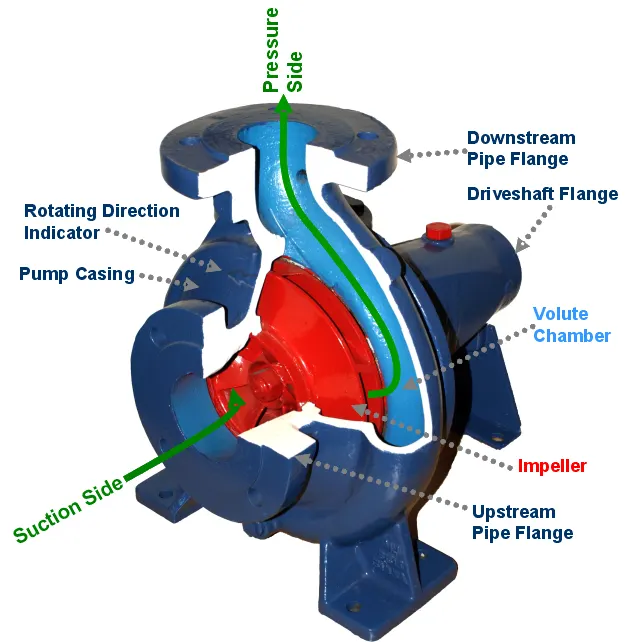
Centrifugal pumps are used to transport fluids by the conversion of rotational kinetic energy to the hydrodynamic energy of the fluid flow. The rotational energy typically comes from an engine or electric motor. They are a sub-class of dynamic axisymmetric work-absorbing turbomachinery. The fluid enters the pump impeller along or near to the rotating axis and is accelerated by the impeller, flowing radially outward into a diffuser or volute casing from which it exits.
Like most pumps, a centrifugal pump converts rotational energy, often from a motor, to energy in a moving fluid. A portion of the energy goes into kinetic energy of the fluid. Fluid enters axially through eye of the casing, is caught up in the impeller blades, and is whirled tangentially and radially outward until it leaves through all circumferential parts of the impeller into the diffuser part of the casing. The fluid gains both velocity and pressure while passing through the impeller. The doughnut-shaped diffuser, or scroll, section of the casing decelerates the flow and further increases the pressure.
Pressure Ratio = Outlet total pressure/Inlet total pressure
PROCEDURE :
- Basic design of a Centrifugal pump is sketched with appropriate dimensions. Total number of blades is 7.
- Using the combine feature, the inlet and oulet pipe are combined with the impeller casing.
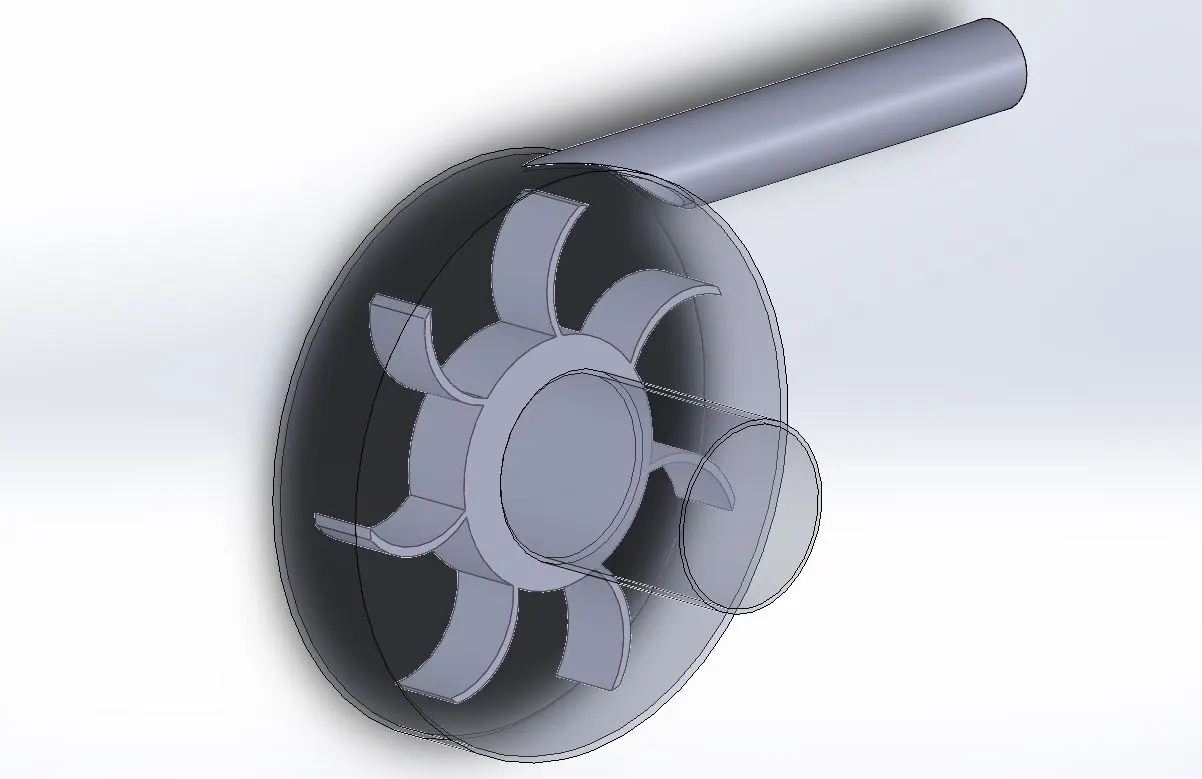
- Create lids at the inlet and outlet faces and do the wizard in flow simulation. The fluid used is water.
- Insert boundary contions :
Inlet - Enviromental Pressure = 101325`Pa`
Outlet - Velocity = 20m/s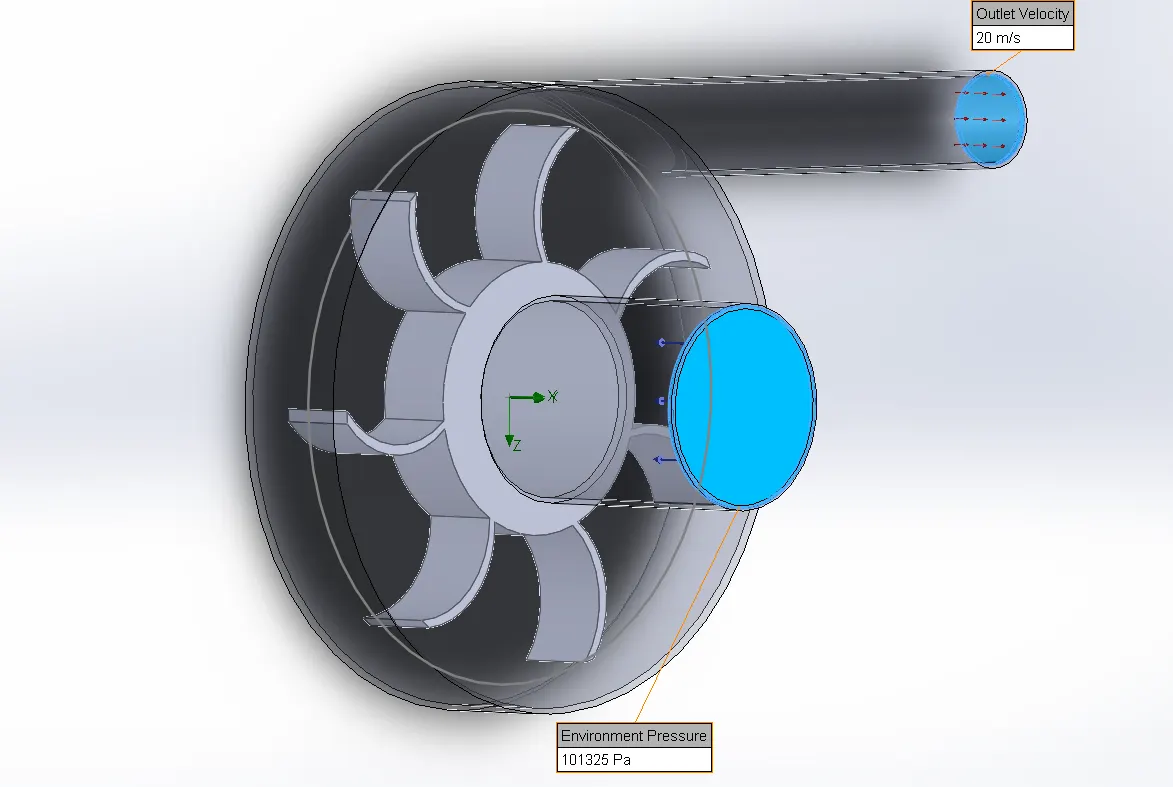
- Define the rotating region and select the propeller domain, and put RPM = 1000 rad/s.
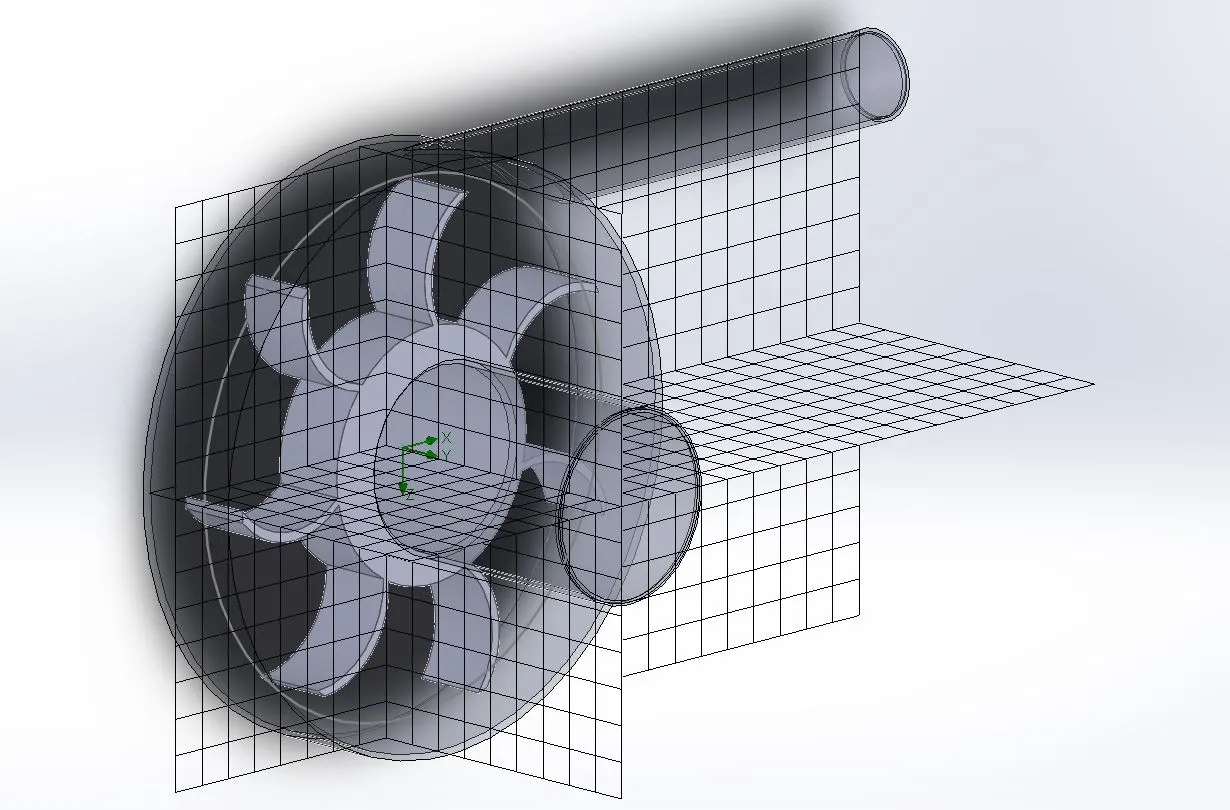
- Global Mesh and Computational Domain :
- Now insert Surface goals at the inlet and outlet. At the inlet Average Total Pressure is selected and at the outlet Average Total Pressure along with Mass Flow Rate is selected.
- Run a baseline simulation by selection the desired number of iterations to be done.
- Then a parametric study using input parameter as the Outlet Velocity and selecting the output parameters as the goals and results.
RESULTS :
The Performance diagram is obtained by varying the Outlet Velocity :
| OUTPUT VELOCITY (m/s) | VELOCITY PLOT | PRESSURE PLOT |
| 20m/s | 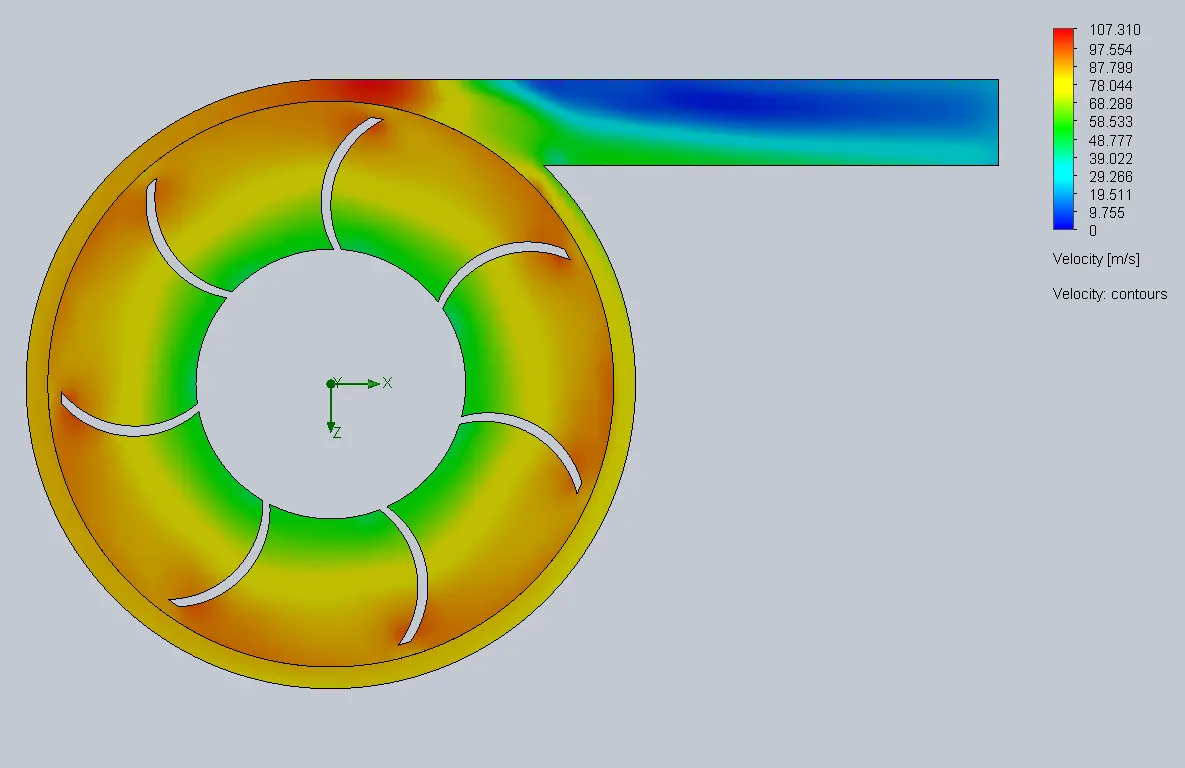 |
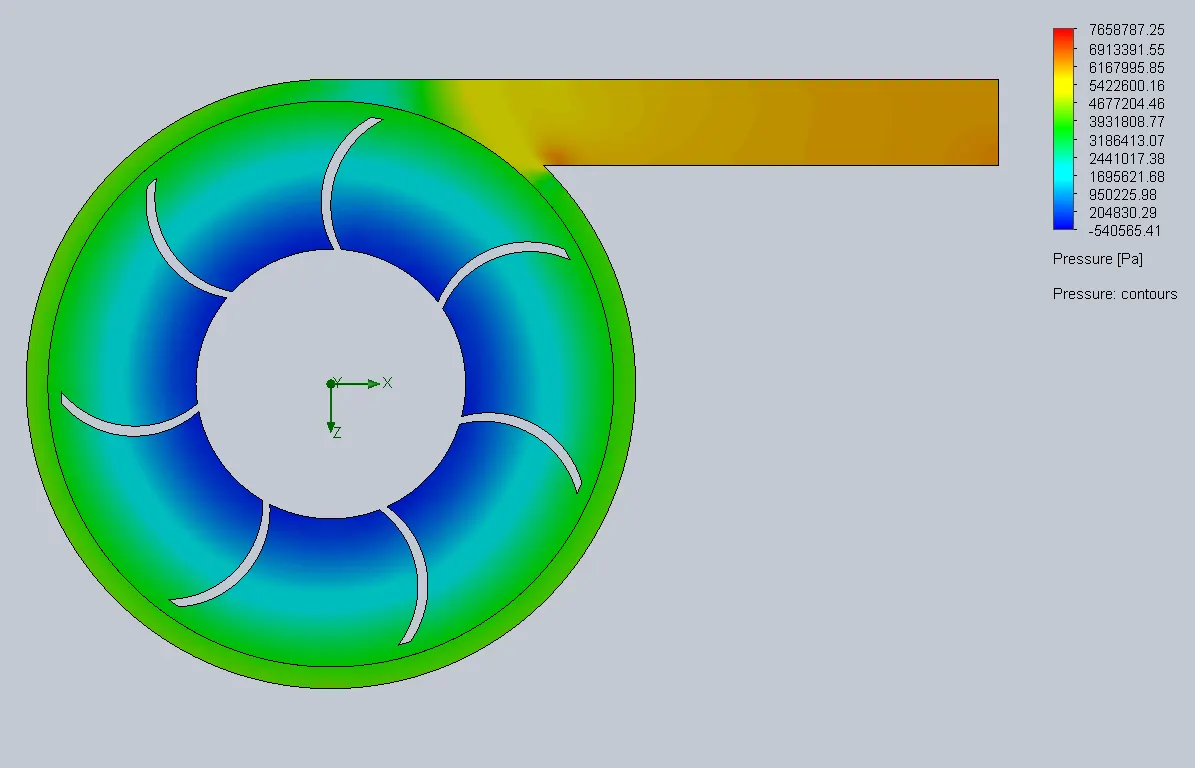 |
| 25m/s | 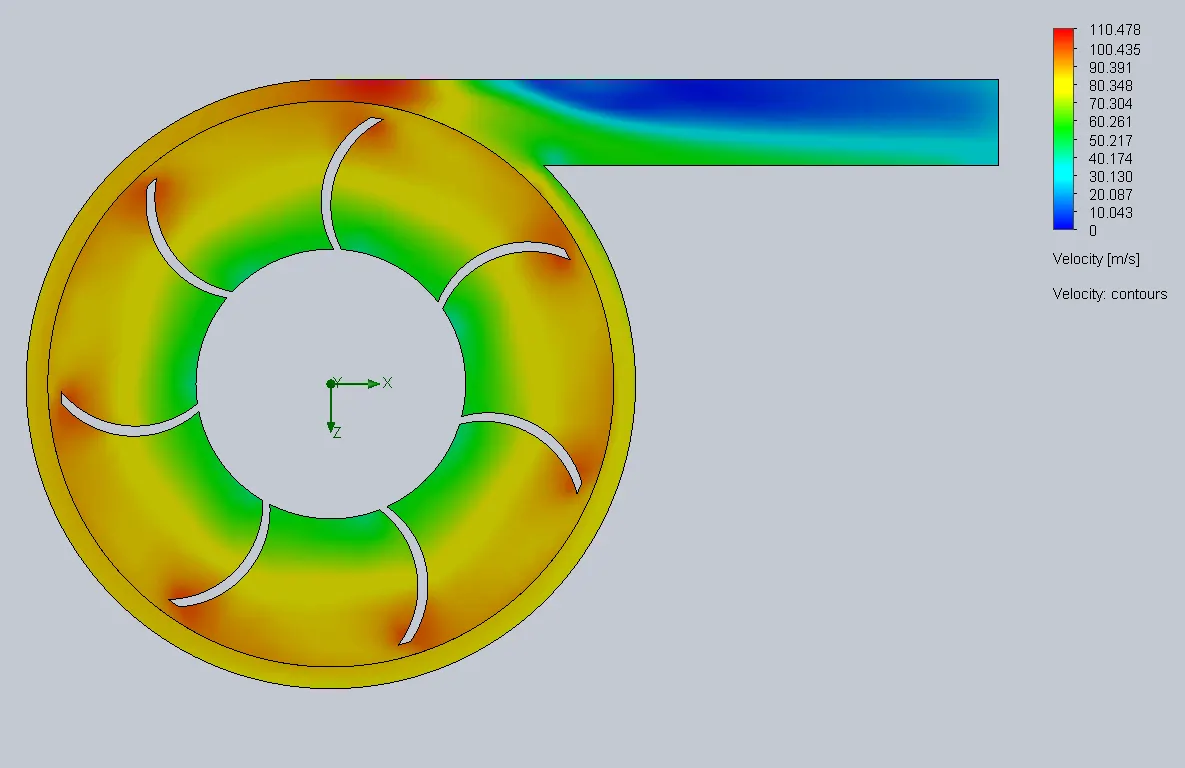 |
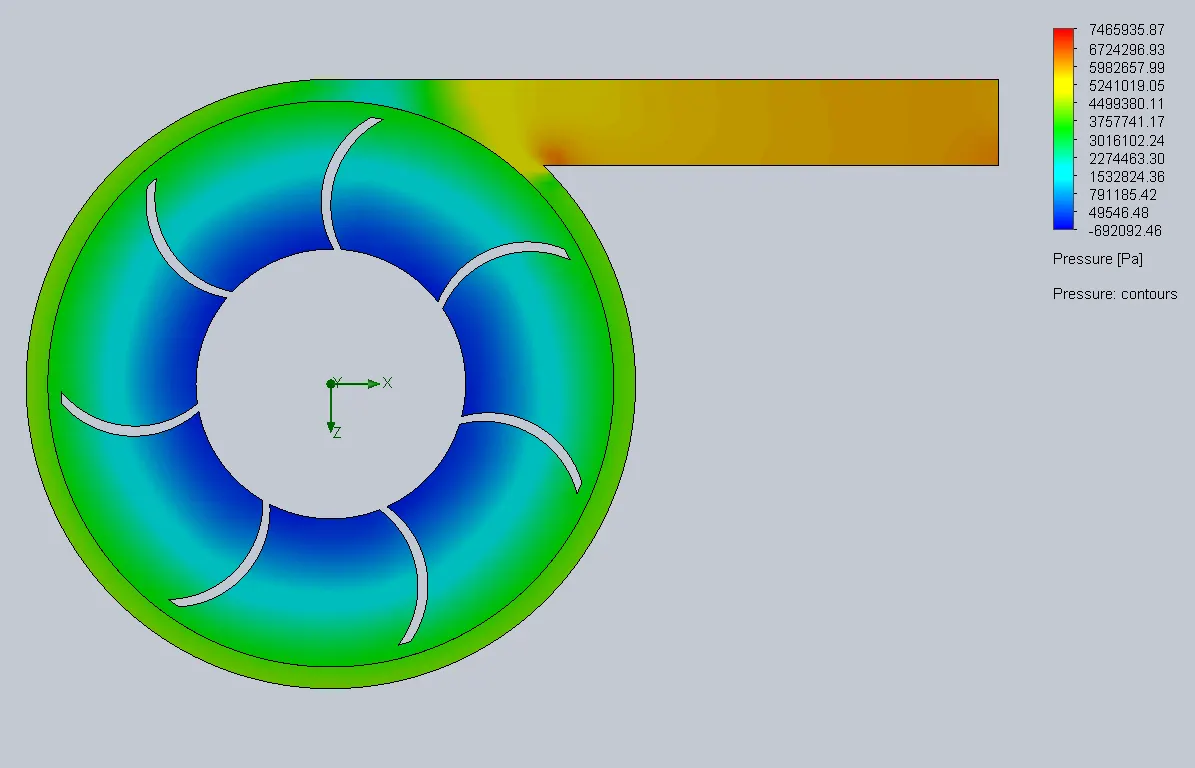 |
| 30m/s | 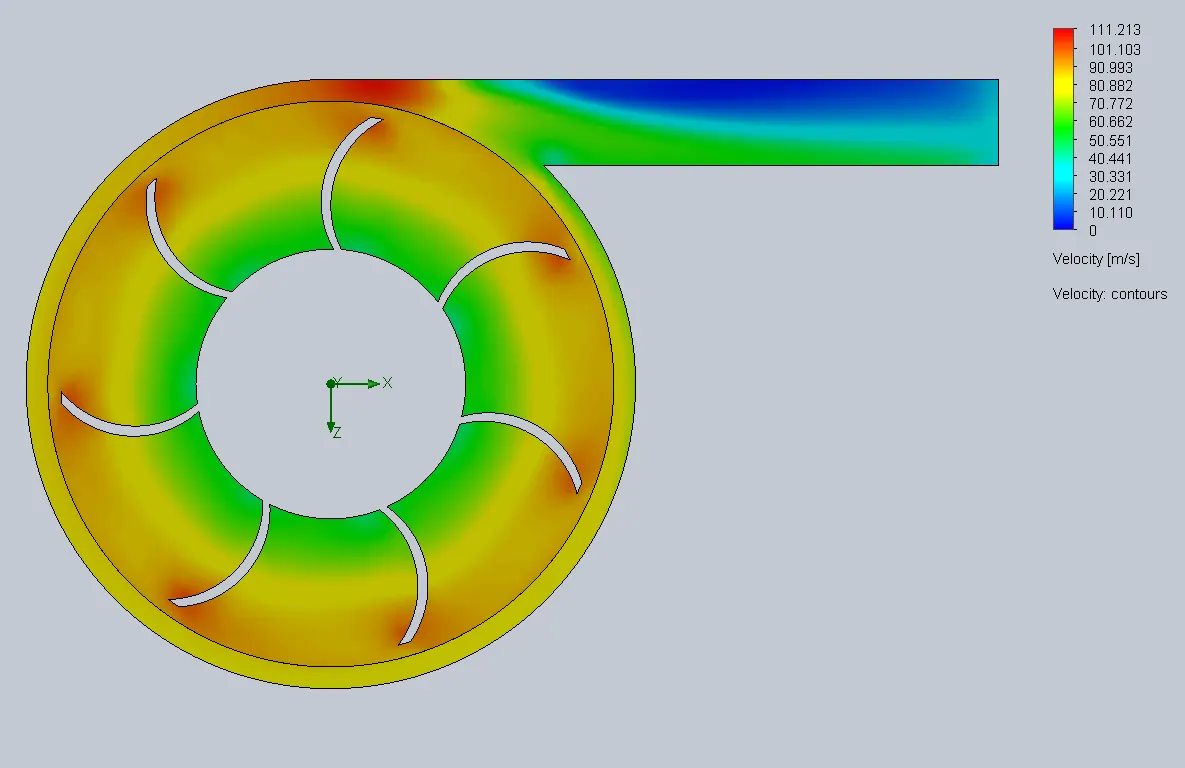 |
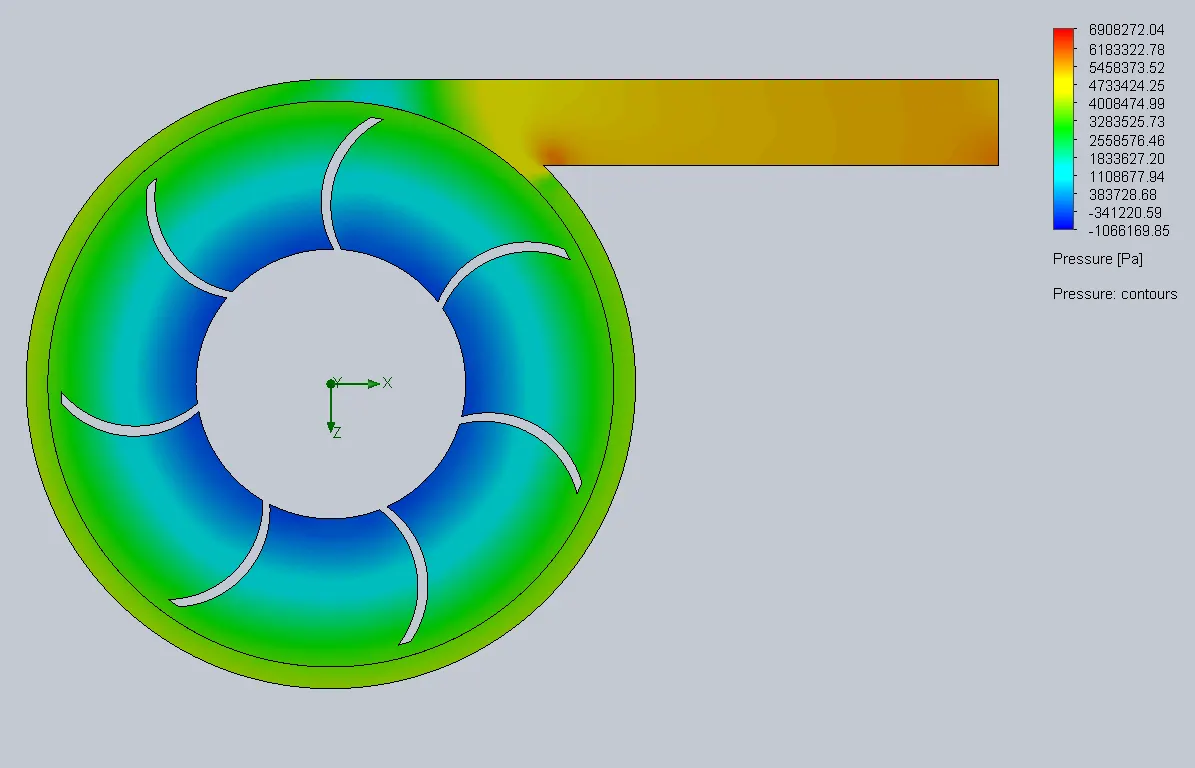 |
| 35m/s | 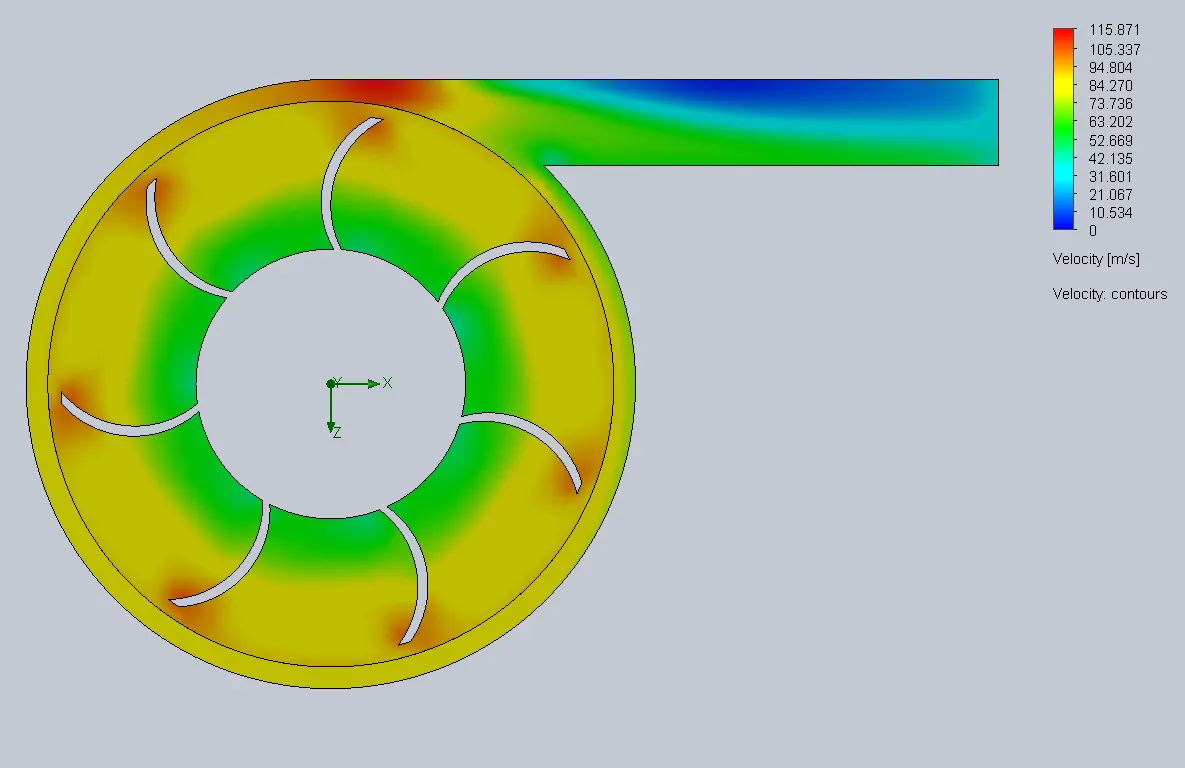 |
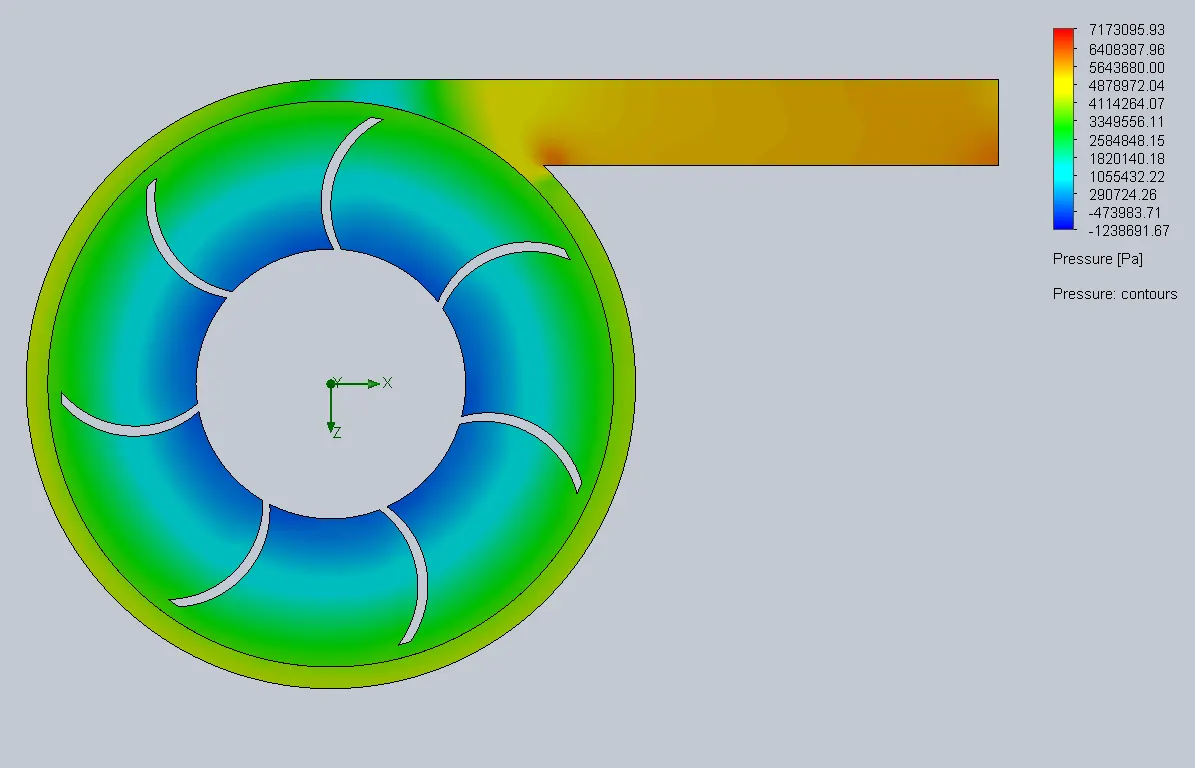 |
| 40m/s | 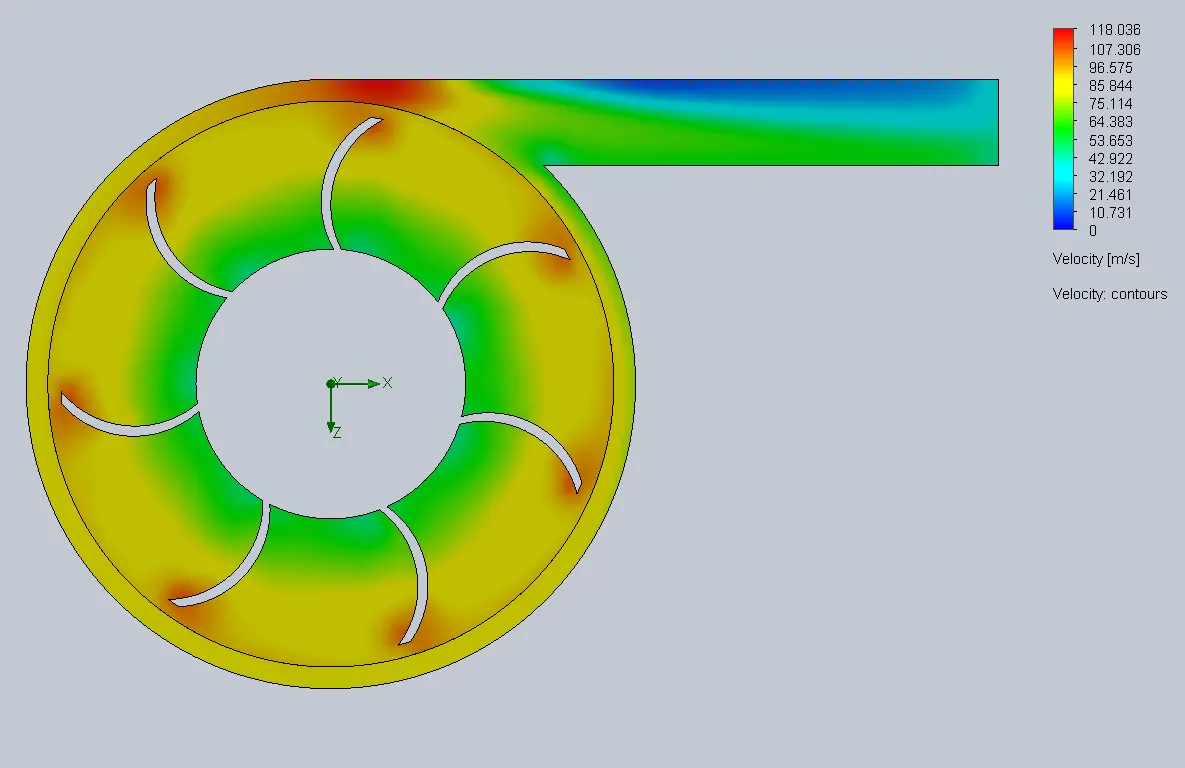 |
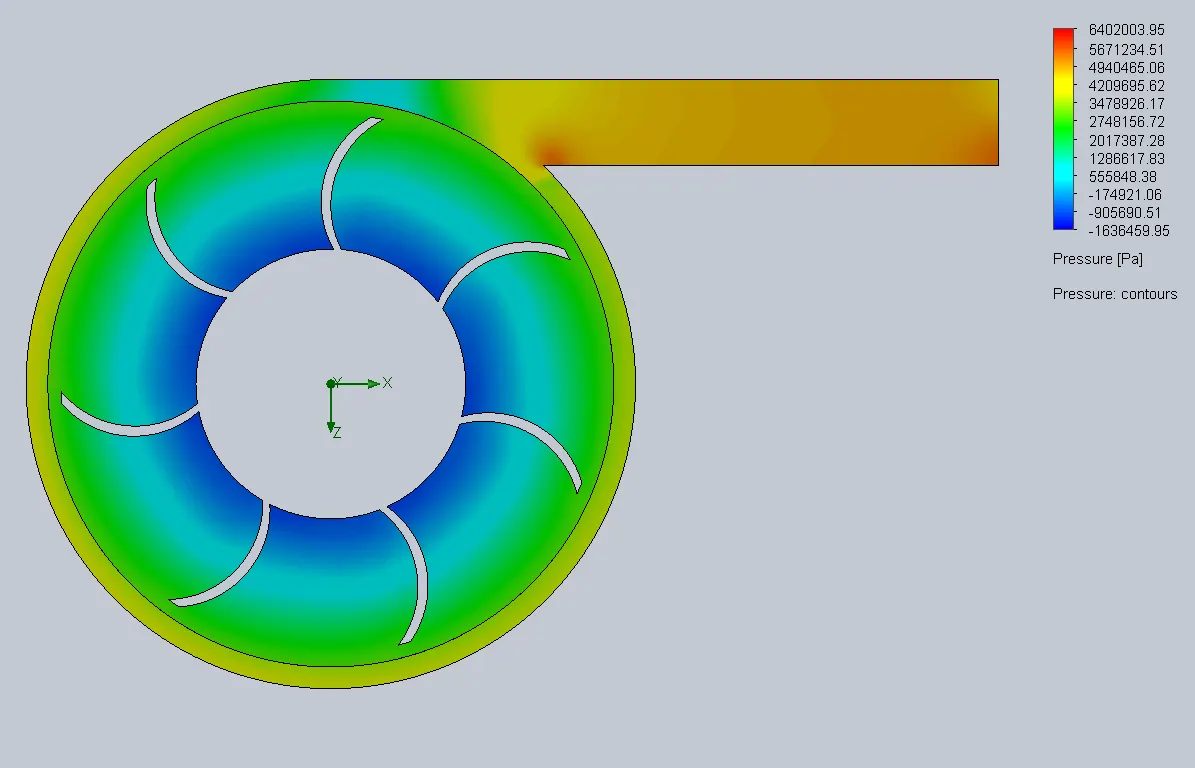 |
FLOW TRAJECTORY (VELOCITY AND PRESSURE) :
| OUTPUT VELOCITY (m/s) | VELOCITY TRAJECTORY | PRESSURE TRAJECTORY |
| 20m/s | ||
| 25m/s | ||
| 30m/s | ||
| 35m/s | ||
| 40m/s |
GRAPHS AND COMPARISON :
Inlet and Outlet Pressure with varying Velocity :

PERFORMANCE CHARACTERISTICS :
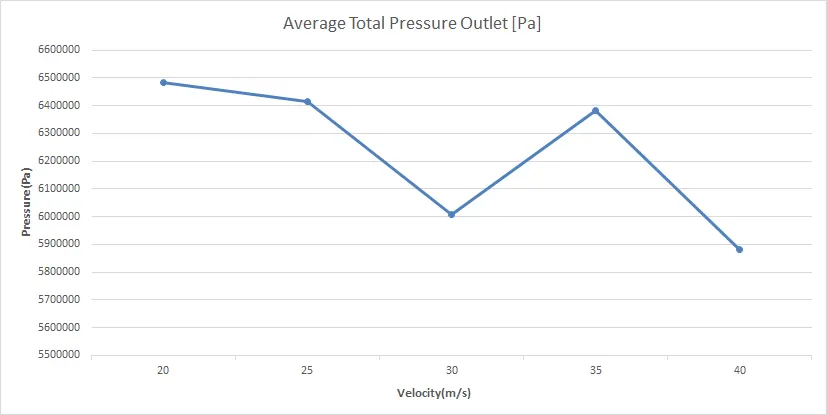
Velocity vs Outlet Avg Total Pressure :
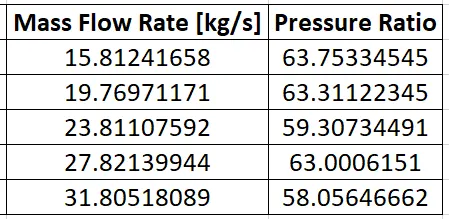
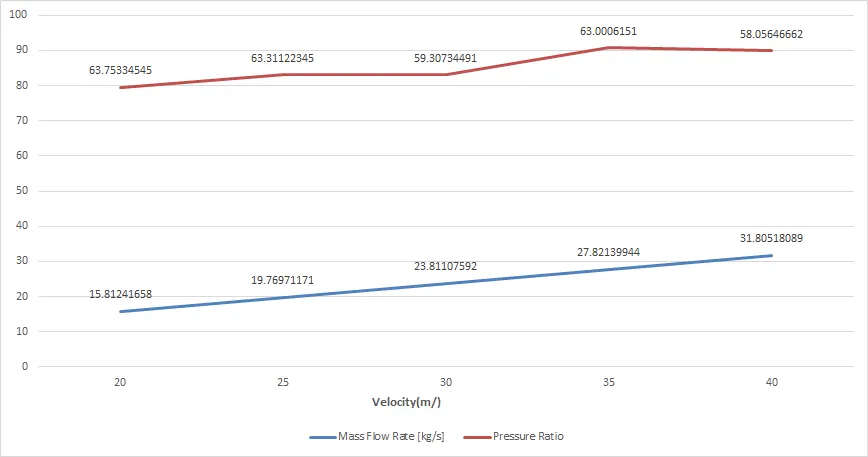
Pressure Ratio vs Mass Flow Rate :
CONCLUSION :
- Increasing the Outlet Velocity, increases the mass flow rate of the fluid.
- Increase in the Outlet Velocity decreases the Average Total Pressure at the outlet.
- There is a linear increase in the Mass Flow Rate.
- There is a fluctuation in the Pressure Ratio which depends on the pump model.