Centrifugal pump design and analysis
Introduction:
A centrifugal pump essentially consists of an impeller rotating in a casing called volute. Fluid enters the eye (center) of the impeller and exits through the space between the impeller blades to the space between the impeller and casing walls. The velocity of fluid elements is in both tangential and radial directions, as the impeller rotates. The velocity and pressure both increase as the fluid flows through the impeller. Since the rotational mechanical energy is transferred to the fluid, at the discharge side of the impeller, both the pressure and kinetic energy of the water will rise. At the suction side, water is getting displaced, so a negative pressure will be induced at the eye. This low pressure helps to suck a freshwater stream into the system again, and this process continues.
Objective:
Performance diagram: Obtain the relationship between Pressure ratio and mass flow rate.
Procedure:
1. Creating the simple centrifugal pump using the solid works and creating lids.
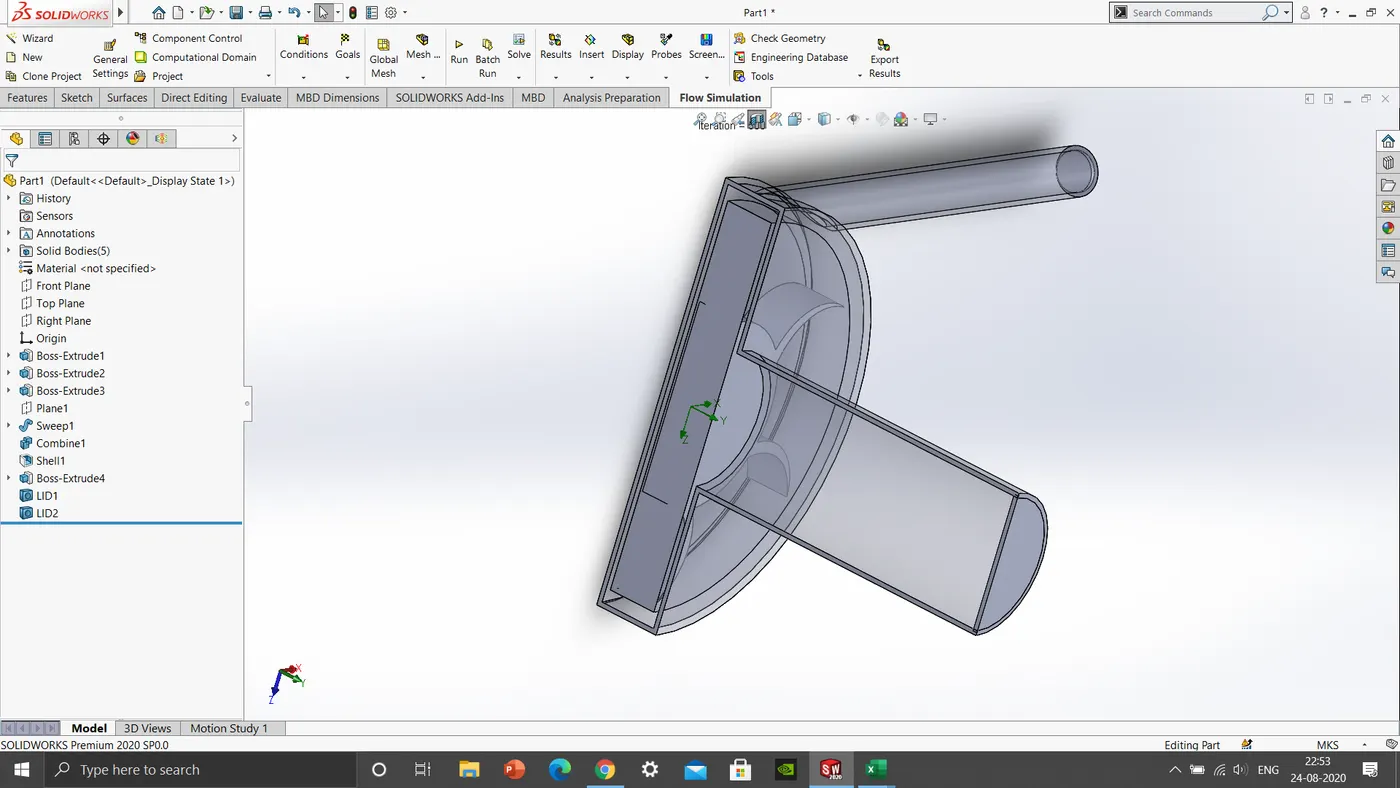
2. Starting flow simulation:
Through wizard gving inputs
remove the unwanted components for simulation using component control command
Giving proper computational domain
selecting rotating part and giving its value rad/sec
Giving boundary conditions: outlet velocity= 10m/s
Setting goals
creating mesh
By choosing the calculation control option to selecct no of iterations for the simulation
Run the simulation.
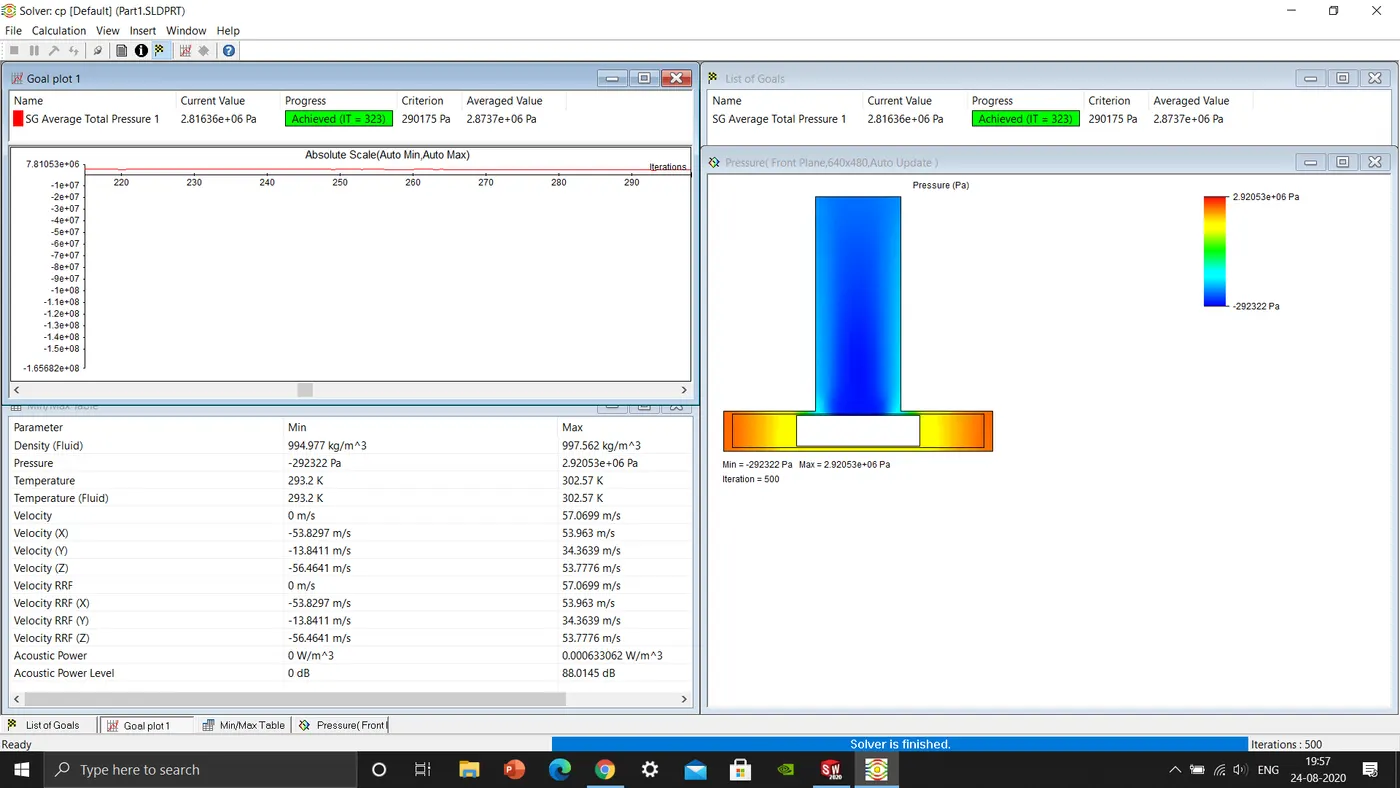
Results:
Goals:
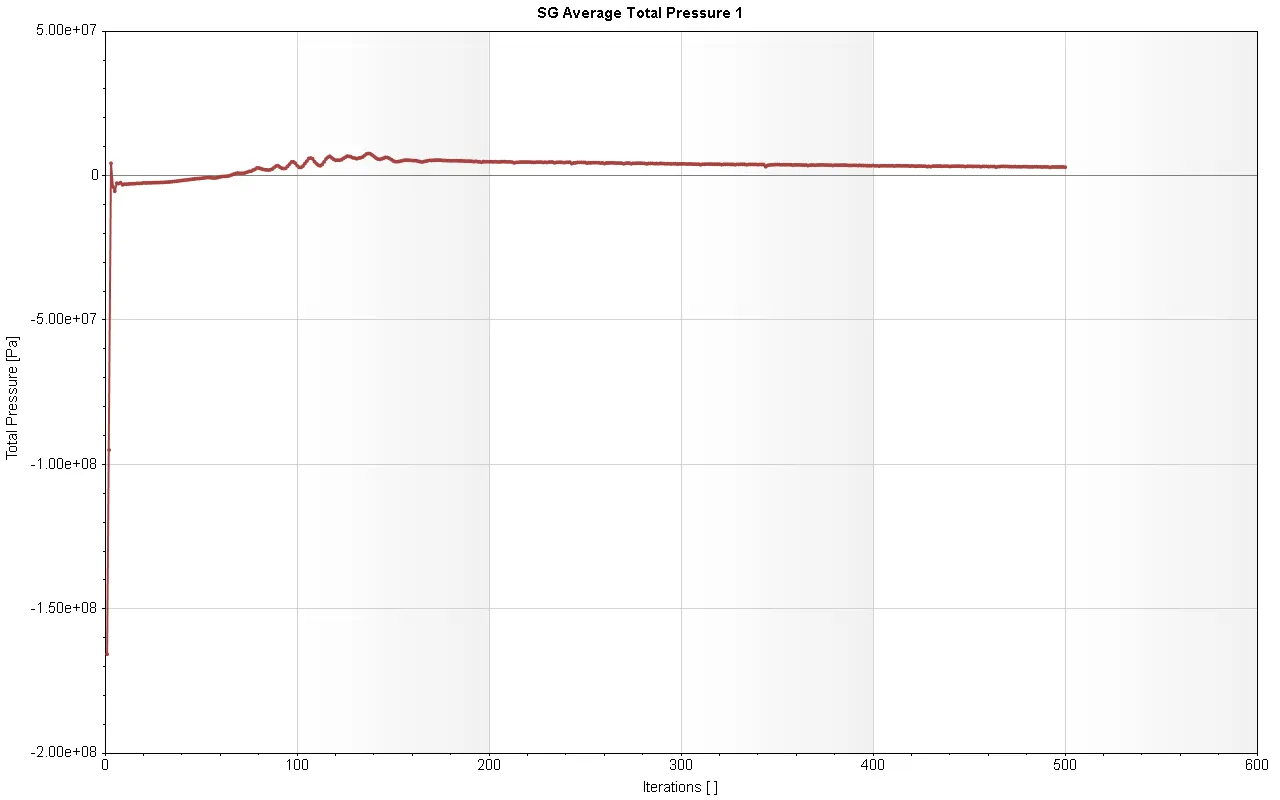
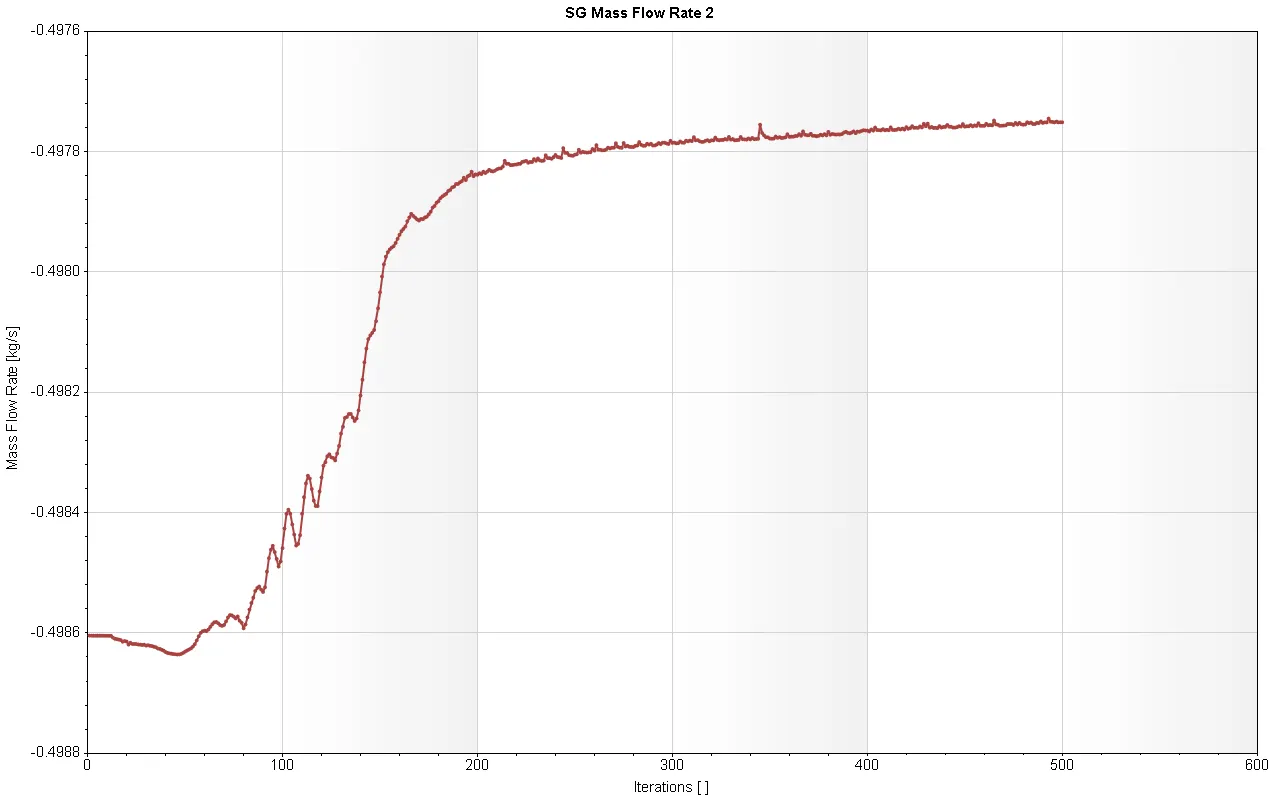
Flow trajectories: https://youtu.be/USTkl5jee1M
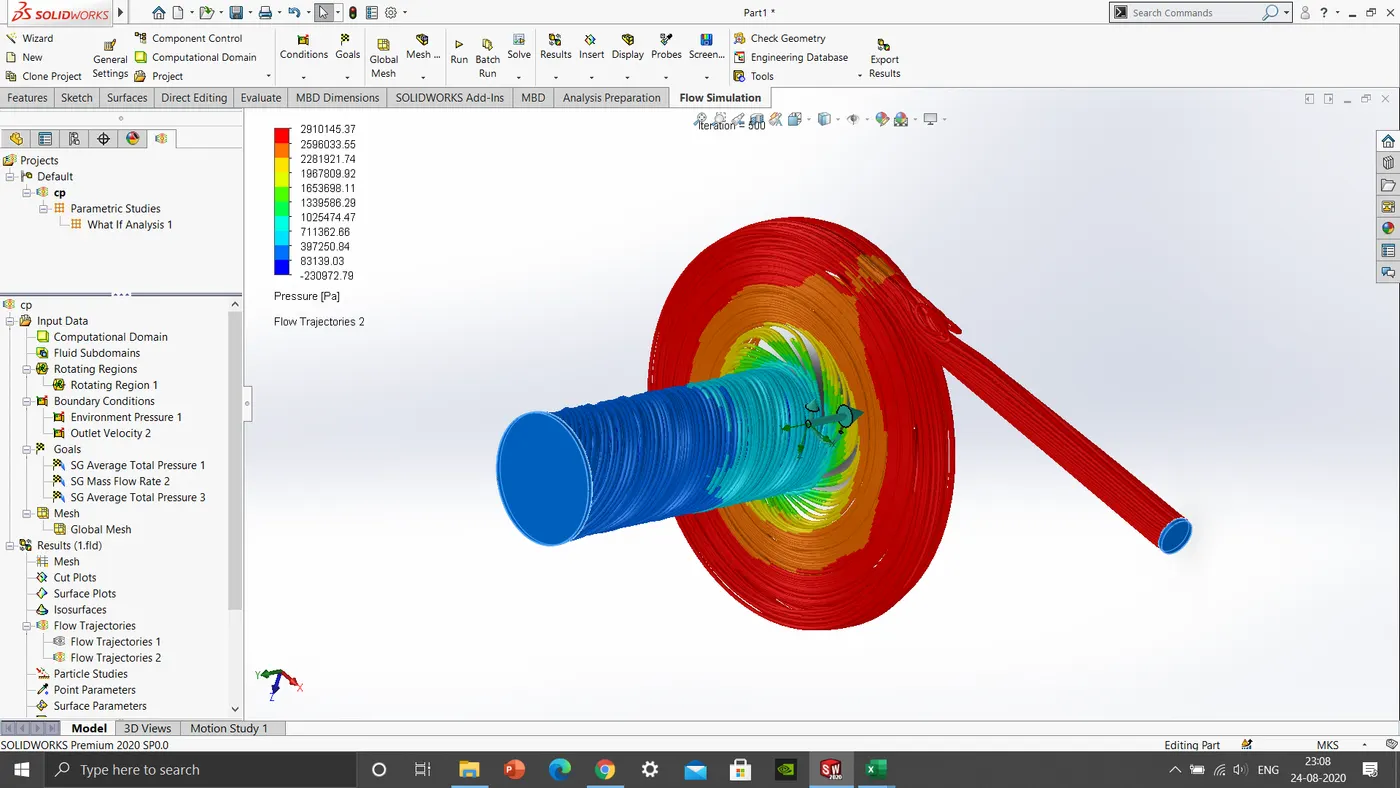
- Pressure ratio = Outlet total pressure/ Inlet total pressure
| Goal (Value) | Design Point 1 | Design Point 2 | Design Point 3 | Design Point 4 | Design Point 5 |
| Velocity normal to face [m/s] | 2 | 6.5 | 11 | 15.5 | 20 |
| SG Average Total Pressure OUTPUT [kPa] | 3231.557822 | 4559.38192 | 6614.845609 | 5005.69909 | 1830.822389 |
| SG Mass Flow Rate 2 [kg/s] | -0.099528145 | -0.323050328 | -0.541864879 | -0.769231543 | -0.995567458 |
| INPUT Pressure [Pa] | 101325 | 101325 | 101325 | 101325 | 101325 |
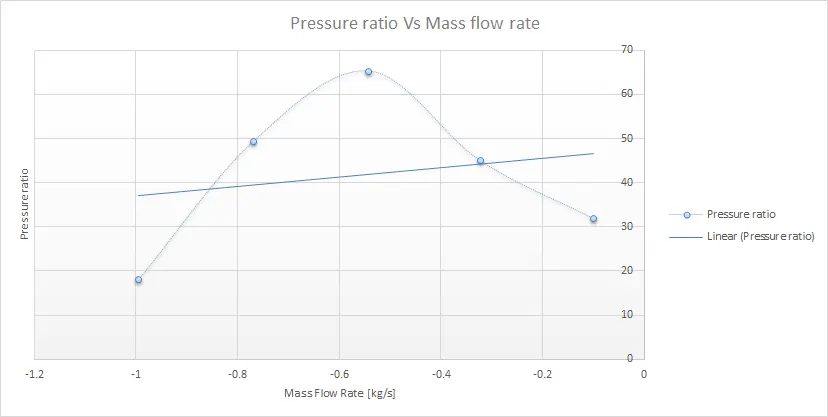
| Pressure ratio(OP/IP) | 31.89299602 | 44.99760099 | 65.28345038 | 49.40240898 | 18.06881212 |
conclusion:
CFD simulation makes it possible to visualize the flow conditions inside a centrifugal pump and provides valuable information about the pump’s hydraulic design. Simulation results are used to calculate and predict the performance of a centrifugal pump, which replaces the lengthy and expensive physical experiments of the past. A great deal of work is saved, in addition to shortening the entire design cycle.
Increase in velocity at outlet increases mass flow rate with increase and decrease trend of pressure.
So, from the plot at velocity at velocity 11m/s the max pressure ratio that is performance of the pump with mass flow rate of 0.54kg/s. from this the simply modeled centrifugal pump is obtained.