2D Cavitation simulation
SIMULATION OF 2D CAVITATION
AIM:
To simulate and run case setup with 3 pressure difference for Winkl Hoffer Nozzle to study cavitation
- Pressure difference of 30 bar
- Pressure difference of 70 bar
- Pressure difference of 100 bar
OBJECTIVES:
Cavitation is defined as the process of formation of the vapour phase of a liquid when it is subjected to reduce pressures at constant ambient temperature. Thus, it is the process of boiling in a liquid as a result of pressure reduction rather than heat addition. However, the basic physical and thermodynamic processes are the same in both cases.
A liquid is said to cavitate when vapour bubbles form and grow as a sequence of pressure reduction. When the phase transition results from hydrodynamic pressure changes, a two-phase flow composed of a liquid and its vapour is called a cavitating flow. Cavitating flow may be seen as water flows through a glass venture tube. According to the Bernoulli’s equation, where the velocity is increased, the pressure is decreased. At sufficiently high flow rates, the liquid in the throat, where the velocity is highest and the pressure is lowest, begins to boil. The small bubbles formed there are filled with cold steam and other gases diffused from the liquid.
CASE SETUP:
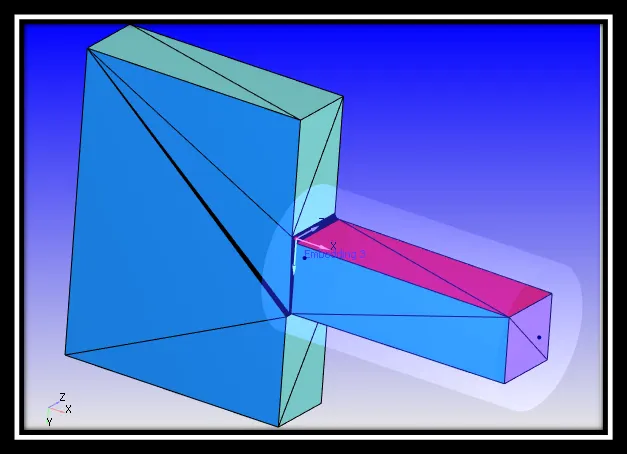
In the material section, gas simulation is selected and under that Ideal gas is selected as equation of state. Under liquid simulation, tetradecane (IC14H30) is selected. In run parameters, transient is selected as solver and the simulation mode will be full hydrodynamic. In solver parameter, Density-based is selected as Navier-Strokes solver type.
In simulation time parameters,
Start time: 0.0 sec
End time: 0.0002 sec
Initial time-step: 1e-07 sec
Minimum time-step: 1e-10 sec
Maximum time-step: 0.01 sec
Maximum convection CFL limit: 0.5
Maximum diffusion CFL limit: 5.0
Maximum Mach CFL limit: 50.0
In boundary condition,
Inlet (BOUNDARY ID- 1): Pressure- i). 100 bar- Pressure difference is 30 bar
ii). 140 bar- Pressure difference is 70 bar
iii). 170 bar- Pressure difference is 100 bar
Velocity- Zero Gradient
Temperature- 300 K
Outlet (BOUNDARY ID- 2): Pressure- 70 bar
Velocity- Zero Gradient
Temperature- 300 K
Top and Bottom walls: Wall motion type- STATIONARY
Surface movement: FIXED
Temperature- 300 K
Side wall A and B: 2D
Throat: Wall motion type- STATIONARY
Surface movement: FIXED
Temperature- 300 K
In physical models,
Turbulence model: RNG k-ε
In Volume of Fluid (VOF) modelling,
VOF model: No front capture
Face density approx.: Arithmetic average
Under cavitation model,
Time-scale coefficient: 3.84e-07
Condensation time-scale factor: 5000.0
Minimal allowed pressure ratio: 1e-05
Liquid species: IC14H30
Liquid vapour: C14H30
In grid control,
Base grid: dx- 4e-05 m
dy- 4e-05 m
dz- 4e-05 m
Surface with edges:
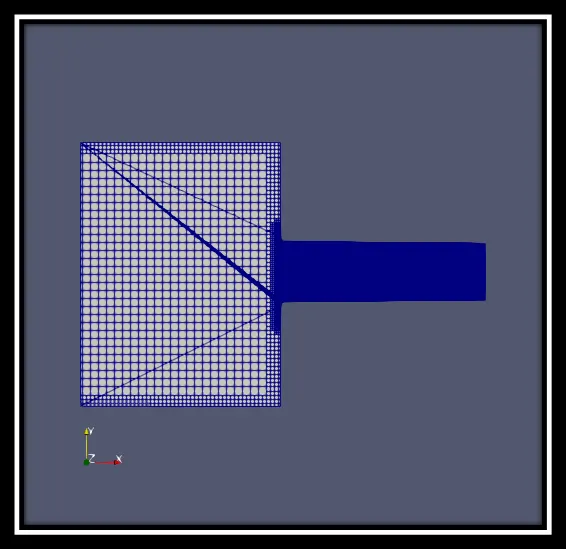
CASE-1: PRESSURE DIFFERENCE- 30 BAR
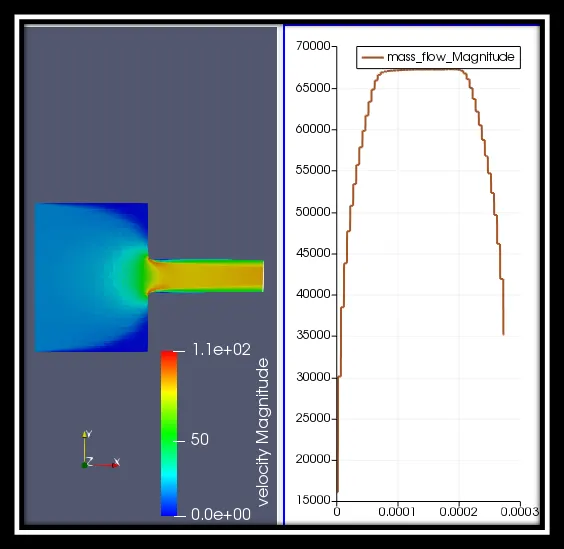
Velocity contours: https://www.youtube.com/watch?v=NCJincxWqNw&feature=youtu.be
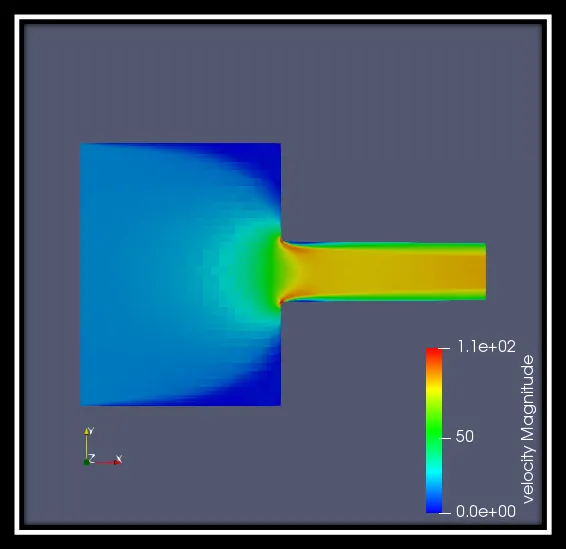
As we can see from these results, the velocity at the inlet point is decreased and when it flows through the nozzle at the entrance of the nozzle, due to the sudden contraction of the area the velocity rises up the its maximum level. This is also due to the low pressure at the nozzle.
Alpha contours: https://www.youtube.com/watch?v=GPfWS5T7dYY&feature=youtu.be
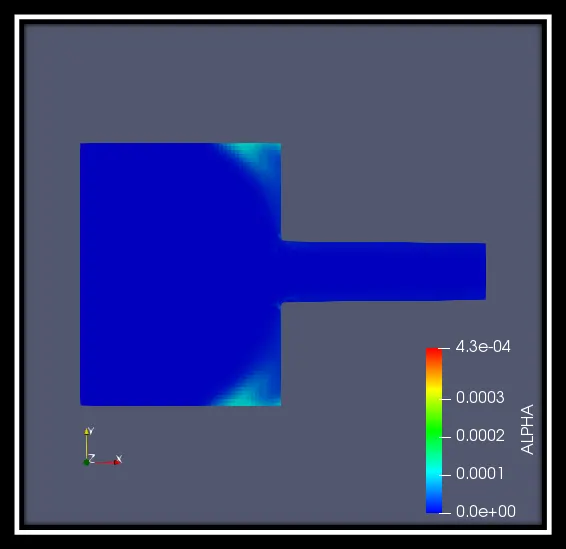
Mass flow rate contour:
CASE-2: PRESSURE DIFFERENCE- 70 BAR
Velocity contours: https://www.youtube.com/watch?v=XRGtgFM8qgE&feature=youtu.be
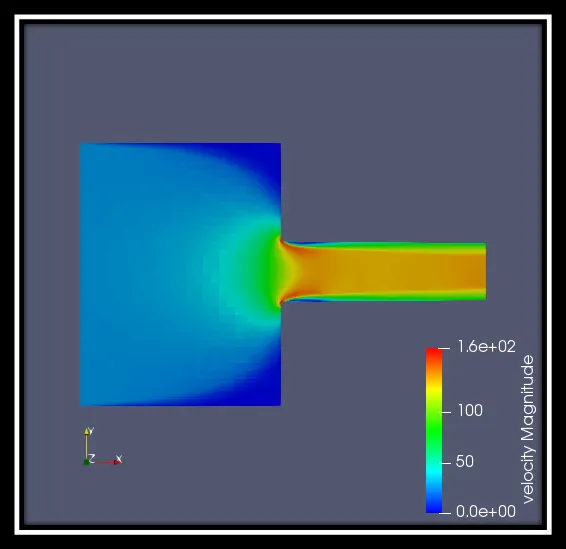
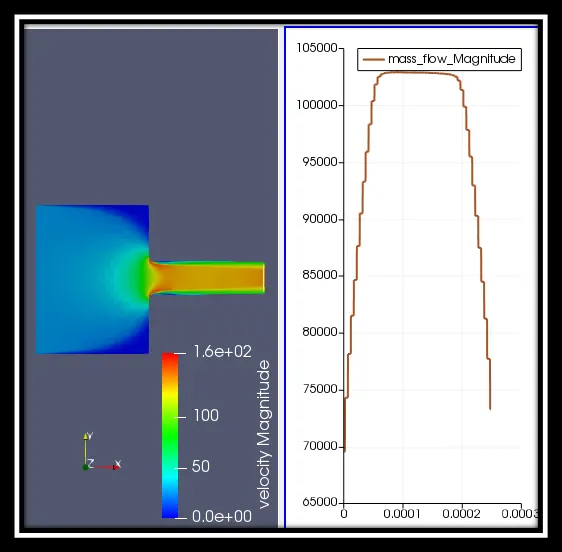
As you can see the process is very similer to the previous one, but here the pressure difference is increaseed to 70 bar. So when to the pressure difference increases the velocity also increase which come around 160m/s at the edge of the nozzle due to the contraction of the area.
Alpha contours: https://www.youtube.com/watch?v=2OxW-1ox3rE&feature=youtu.be
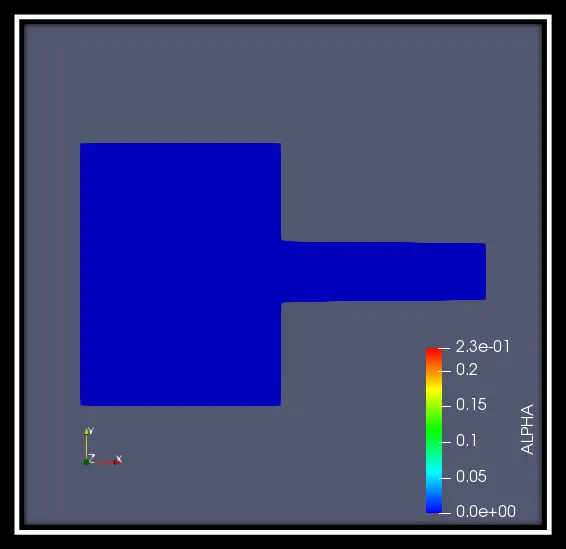
Mass flow rate contour:
CASE 3: PRESSURE DIFFERENCE- 100 BAR
Velocity contours: https://www.youtube.com/watch?v=7JUBq35POCk&feature=youtu.be
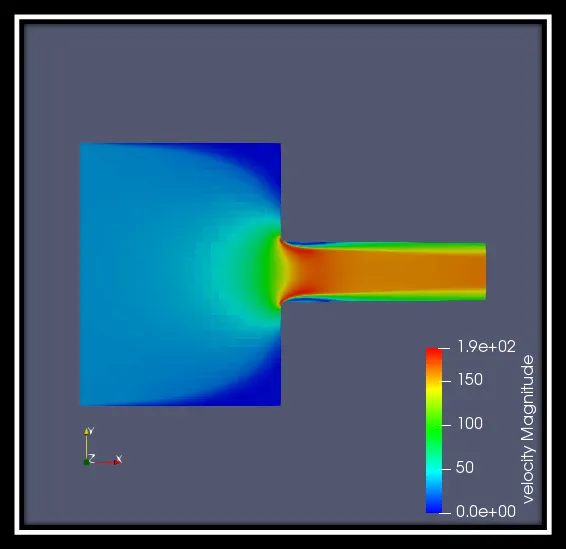
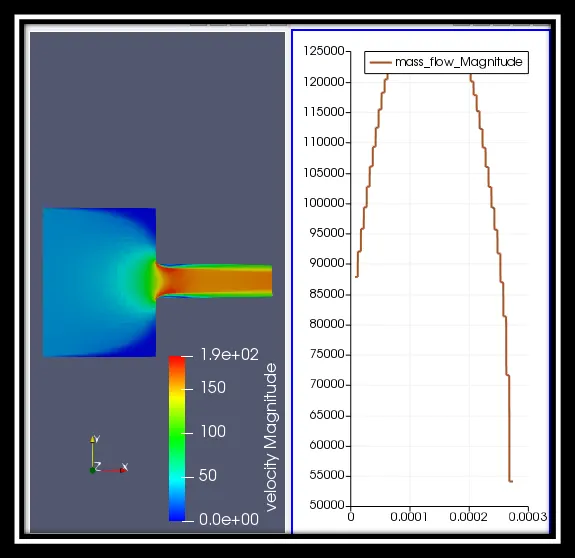
Here the same process is repeated but the pressure difference is 100 bar. From the above result you can see that the velocity is relatively high at the edge of the nozzle that is around 190m/s.
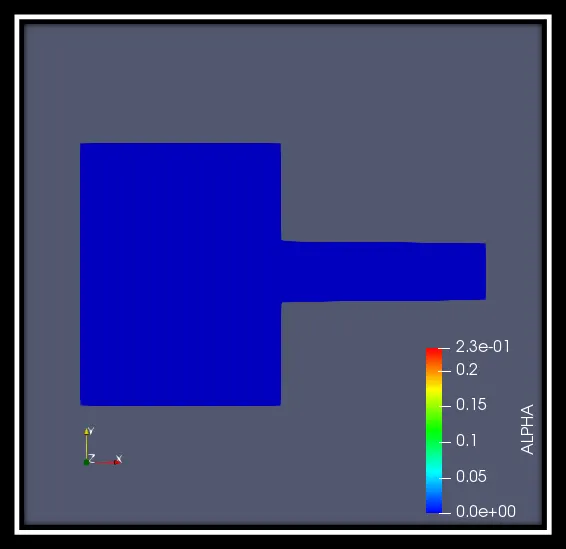
Alpha contours: https://www.youtube.com/watch?v=y_0Ve_1lOCI&feature=youtu.be
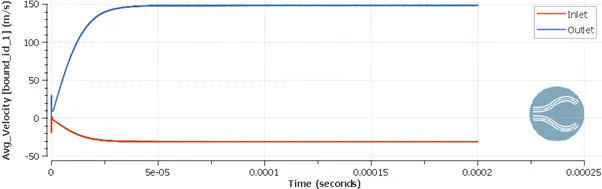
Mass flow rate contour:
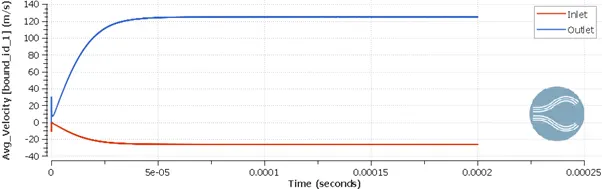
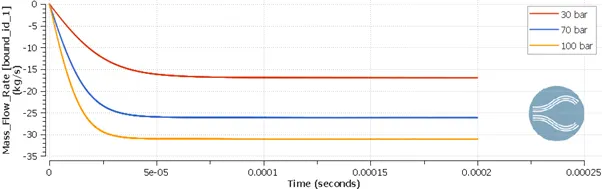
Mass flow rate- Inlet:
Mass flow rate- Outlet:
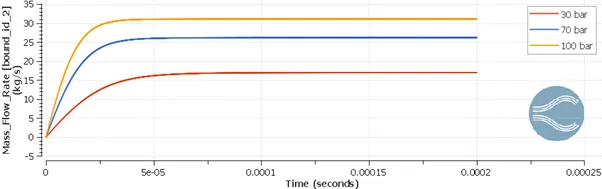
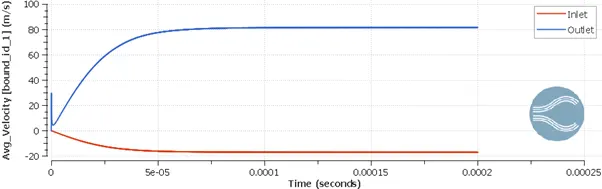
As you can see, when the pressure difference is increased the mass flow rate also get increased. When we compare the results of both inlet and outlet, it is same but in an opposite direction. It is also proved that it has been converged.
Total count cell:
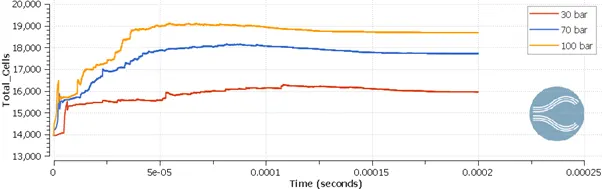
From the above plot, we can see that the total cell count increases when the pressure difference is increased.
CONCLUSION:
So, the cavitation study of Winkl Hoffer Nozzle with three pressure difference is successfully done.