Week 6 - Data analysis
Aim: To perform the below given tasks
1. Data visualizer
- Script should take column numbers as the input and plot the respective columns as separate images
- Each file should be saved by the name of the column
- The plot labels should be extracted from the file. If, I request for a plot between column 1 (crank angle) and column 8(volume), then the label information should automatically be extracted and must appear as labels in the plots. THIS SHOULD NOT BE DONE MANUALLY
2. Compatability check
- Code should exit gracefully, if a non-compatible file is provided as an input. It should say something like "File not recognized. Please provide a valid CONVERGE output file"
3. Basic performance calculation
- Calculate the area under the P-V diagram. P is in column 2 and V is in column 8.
- Calculate the power output of this engine. Assume that RPM is 1500
- This engine consumed 20 micro grams of fuel (per 1 stroke cycle). Calculate its specific fuel consumption.
Theory:
Data analysis is a process of inspecting, cleansing, transforming, and modelling data with the goal of discovering useful information, informing conclusions, and supporting decision-making. Data analysis has multiple facets and approaches, encompassing diverse techniques under a variety of names, and is used in different business, science, and social science domains.
Power:
Power is the product of torque and angular velocity:
- P = Power in Watt (W)
- M = Torque in Newton-metre (N·m)
- `n` = Crankshaft speed per Second (s−1)
- `omega` = Angular velocity = `2pin`
Power is then: P = `M*omega`
In internal combustion engines, the crankshaft speed `n` is a more common figure than `omega`, so we can use `2pin` instead, which is equivalent to `omega`
- `P=M*2pi*n`
Note that `n` is per Second (s−1). If we want to use the common per Minute (min−1) instead, we have to divide `n`by 60:
`P=M*2pi*n/60`
Usually, the fuel mass flow rate is measured in [g/s], the engine power in [kW], which gives the brake specific fuel consumption in [g/kW·h]:
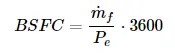
where:
mf [kg/s] – fuel mass flow rate (measured on the engine dynamometer)
Pe [W] – effective (brake) engine power
BSFC [kg/J] – brake specific fuel consumption
Code:
Datafile:
https://drive.google.com/file/d/1L8GY56d-M8mB1KfceM-xVhGNvnCIqxjm/view
Explaination:
- Import necessary libraries in python.
- Perform compatibility check by entering the file name to import it to extract data.
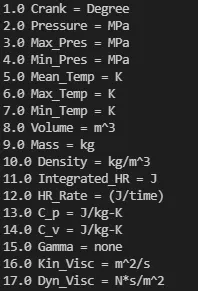
- Tabulated data with units of the most important columns of data is being printed using a for loop.
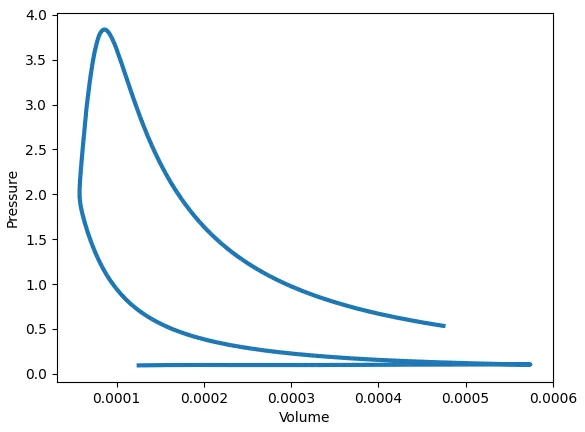
- Data visualisation is performed by using user input values on the columns that need to be plotted against one another.
- A for loop is used to open the file and read the columns with the index which is obtained in form of a user defined input,
- The xlabel and ylabel are also decided by appending them into an empty array.
- A special case of if condition is declared for calculating Specific fuel consumption of the engine.
Calculation is not initiated for other plots.
import matplotlib.pyplot as plt
import numpy as np
import os.path
from numpy import trapz
import math

"""
Compatibility check
"""
# preliminary check to see if the file is accessible in the directory
if os.path.isfile('engine_data.out'):
    print ("File exists")
else:
    print ("File not exist")

#
filename=input('Enter filename: ')
if filename=='engine_data.out':
	print('This a valid filename')
else:
	print('File name is invalid')
	exit()

# from tabulate import tabulate
desc=['Crank', 'Pressure','Mean Temperature','Volume','Mass','Density','Integrated HR','HR Rate','Cp','Cv','Gamma','Kinematic viscosity','Dynamic viscosity']
dim_units=['Degree','MPa','K','m^3','kg','kg/m^3','J','(J/time)','J/kg-K','J/kg-K','none','m^2/s','N*s/m^2']
num=np.linspace(0,13,14)

# Creating a list of data to plot
for i in range(0, len(desc)):
   print(num[i+1],desc[i], '=', dim_units[i])


"""
Data visualiser: Part 1
"""

line_count = 1 # line counter

column_x=[]
column_y=[]
title_x=[]
title_y=[]

a=int(input('Enter the desired column index for a plot on the x coordinate: '))
print(a)
b=int(input('Enter the desired column index for a plot on the y coordinate: '))
print(b)

# file parsing starts here
for line in open('engine_data.out'):

	if '#' not in line:
		column_x.append(float(line.split()[a])) # adds the floated array into the new array called crank array
		column_y.append(float(line.split()[b]))

	else:
		if line_count is 3:
			# when we split the data using the split comand we tend to get the data in form of an array
			#print(line.split())

			title_x.append(line.split()[a+1]) # adds the floated array into the new array called crank array
			title_y.append(line.split()[b+1])

		line_count = line_count+1

# to check the datatype: 'print(type(title_x))'

# note the brackets and colons while the list is being printed
print(title_x)
print(title_y)

# note that in the below command we see that the string is printed without paranthesis and colons
print(','.join(title_x))
print(','.join(title_y))

# to create a new variable to print the correct xlabel and ylabel characters
label_x = (','.join(title_x))
label_y = (','.join(title_y))

plt.plot(column_x, column_y, linewidth = 3)
plt.xlabel(label_x)
plt.ylabel(label_y)
plt.show()


"""
Basic performance calculation: Restricted to PV diagram only
"""
if a==7 and b==1:

	# here since we know the work done from the graph, we can equate work donw to torque
	rpm = 1500
	area = np.trapz(column_y, column_x, dx=1.0)
	print('Area = ',area)
	area_curve=area*10**6 # converting mega pascals to pascals
	work_done = area_curve
	print(area_curve)
	power=(2*math.pi*rpm*work_done/60)/1000
	print('Power in kW = ',power)
	mass_fuel=20*pow(10, -6)
	specific_fuel_consumption=(mass_fuel/power)*3600
	print('Specific fuel consumption in g/(kW*hr)',specific_fuel_consumption)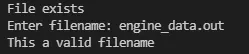


The snippet shows the SFC and other relevant quantities.
Other plots:
Note that the index that you wish to plot needs to subtracted by 1 to match with python index
Example:
For a plot between pressure and velocity
Acctual column number from .out file is 2 for pressure and 8 for volume but we need to enter idex values of 1 and 7 for a PV diagram in the plot window.
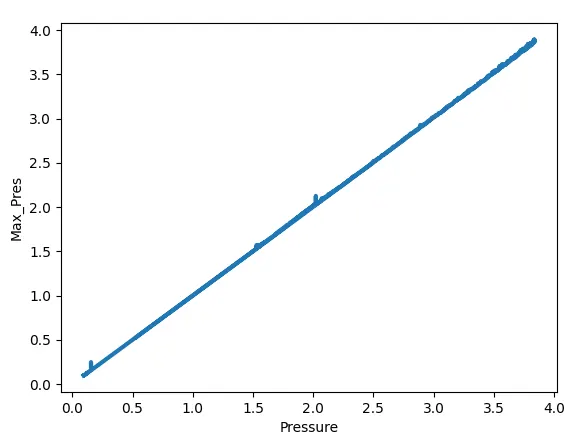
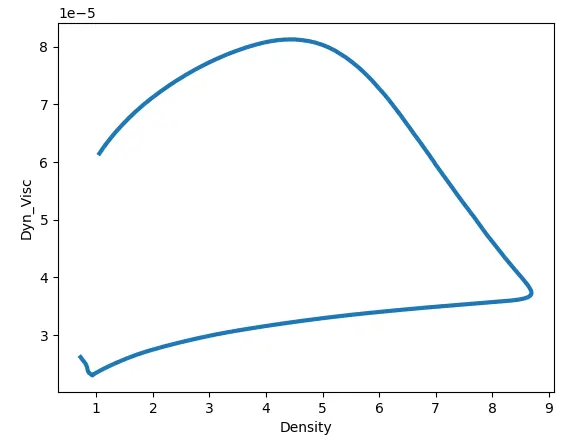
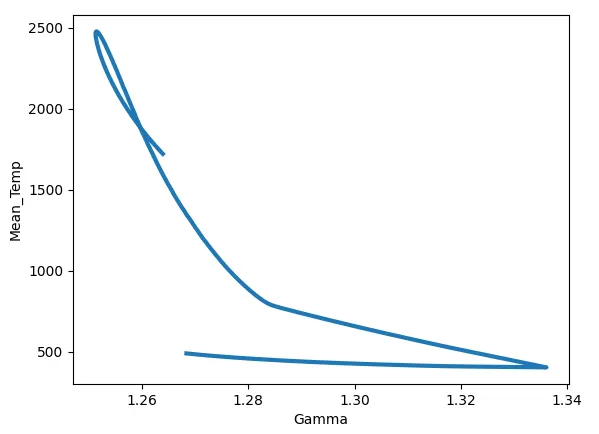
Plot between data in first and the second column.
Reference:
To remove brackets from list to include it in the 'xlabel' and 'ylabel' of the plot:
https://www.pythonpool.com/remove-brackets-from-list-python/
Tab error fix:
To find file:
https://linuxize.com/post/python-check-if-file-exists/
Power:
https://en.wikipedia.org/wiki/Engine_power#Definition
Brake specific fuel consumption:
https://x-engineer.org/brake-specific-fuel-consumption-bsfc/