Calculating the Stretch Ratio by comparing the ELFORM (-2,-1,1,2) with Ogden_Material Model using LS-Dyna
OBJECTIVE:
To compare the results obtained from simulation of solid block using elform -2, -1, 1, 2. The solid block parameters are given below.
1. To create solid block of dimensions 10mm*10mm*10mm with 10 elements for each direction.
2. To attach the given material model Ogden_Material.k extension file
3. To choose a type of solver (explicit/implicit) and justifying the chosen solver.
4. To create an excel sheet with proper conversion and calculation of stress/strain and stretch ratio for all the elform.
PROCEDURE:
1. Open LS-Dyna Project Manager>>Start LS Prepost>>Import the given material file Ogden_Material.k
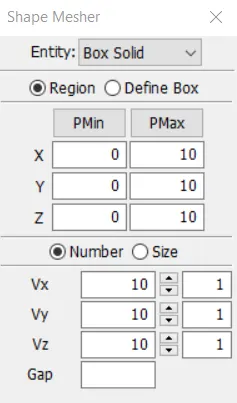
2. Go to Element and Mesh option>>Shape Mesher>>Enter the values shown below in the popup. This would create a solid box of dimensions 10mm*10mm*10mm with 10 elements in each direction.
3. Go to Keyword Manager>>Section>>Solid>>Enter the values as shown in the figure below.
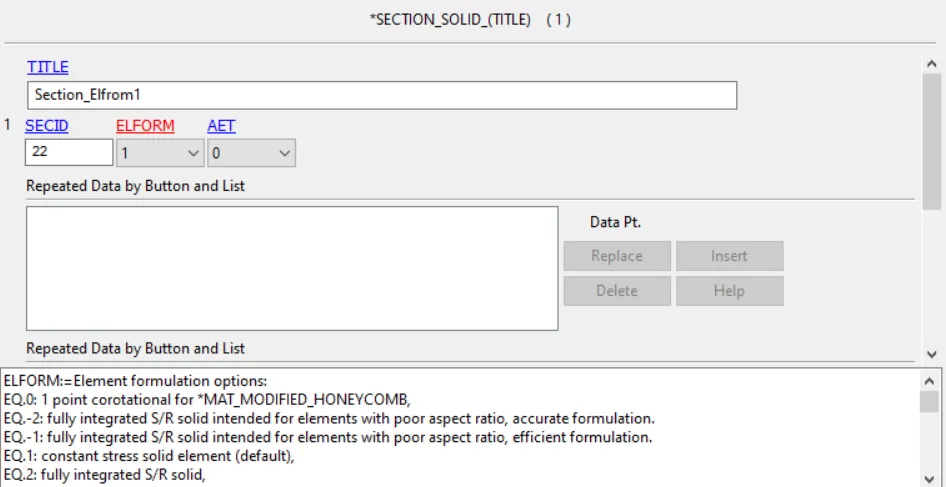
Note: For the different cases of simulation select different values of ELFORM from the drop-down and save it as a different extension file and run the analysis. The definitions of various ELFORM is shown in the above figure.
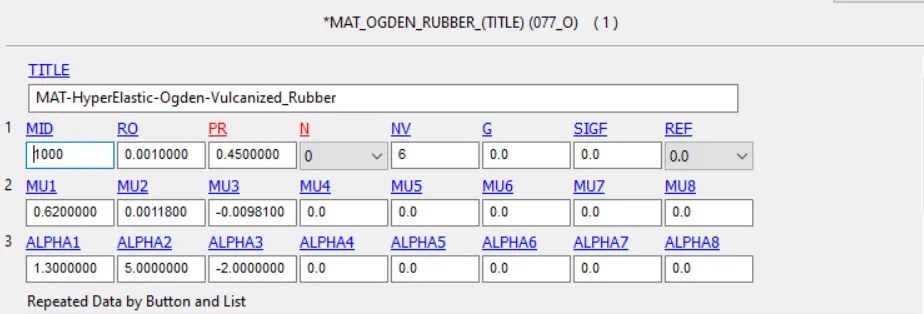
4. The given material card is shown in the figure below.
5. Go to Keyword Manager>>Part>>Rename the part accordingly and assign the section and material card to the part ID.
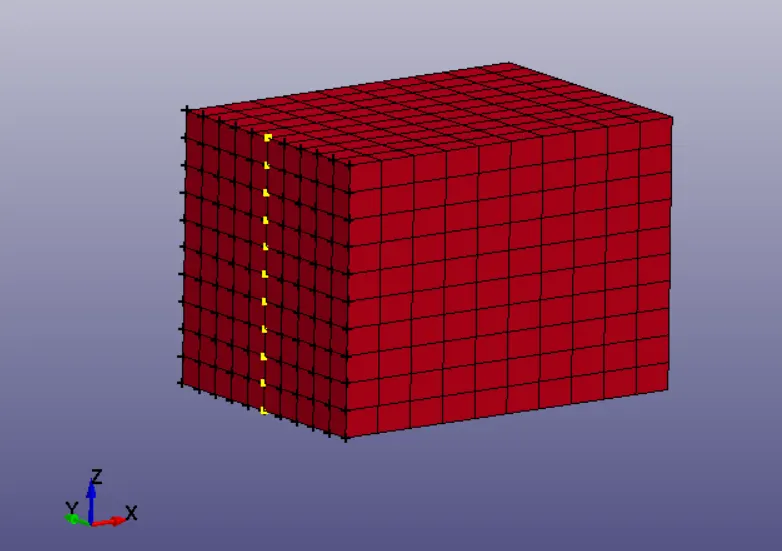
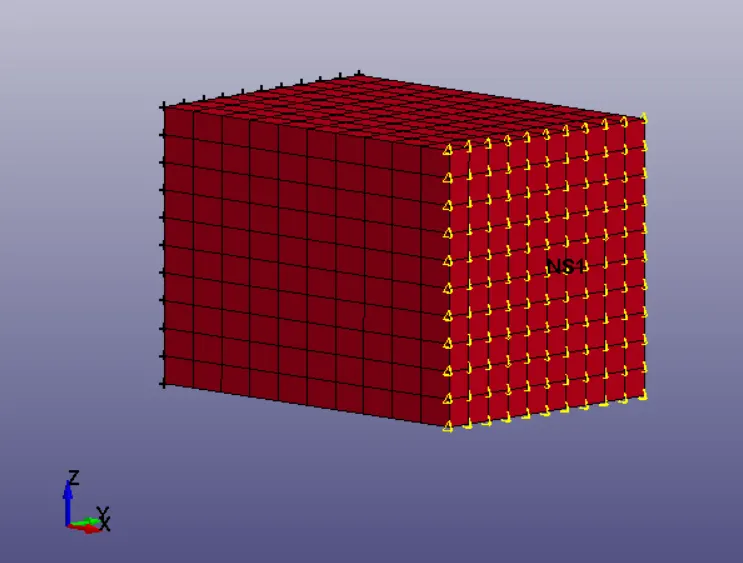
6. Go to create Entity >> Arrest the nodes in the origin plane (along y-z plane) from all rotational degree of freedom and translation along x-axis. This is shown in the figure below.
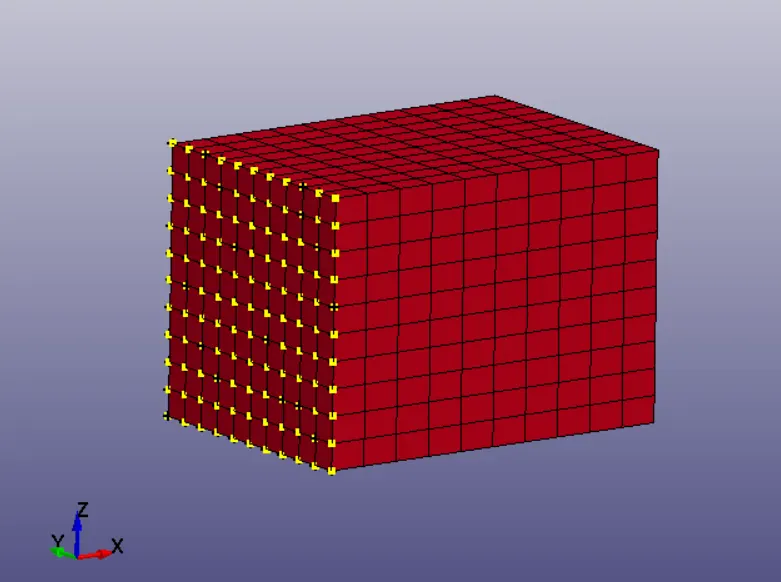 This will ensure that the nodes does not move along different axes when the load is applied along the x-axis.
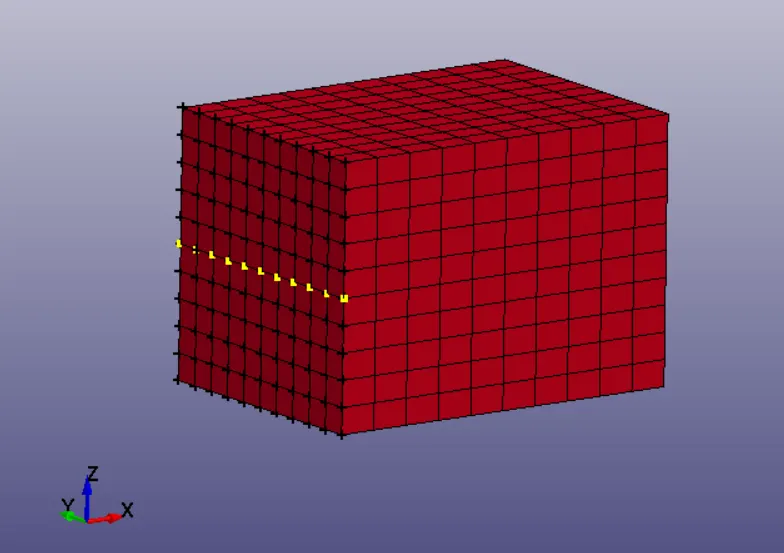
7. Select the midsection of nodes along z-axis and y-axis and arrest the translation of the nodes along their respective axes to arrest the lateral movement when displacement is applied. This is shown in the figure below.
8. Go to Keyword Manager>>Define>>Curve. The curve is defined as shown below.
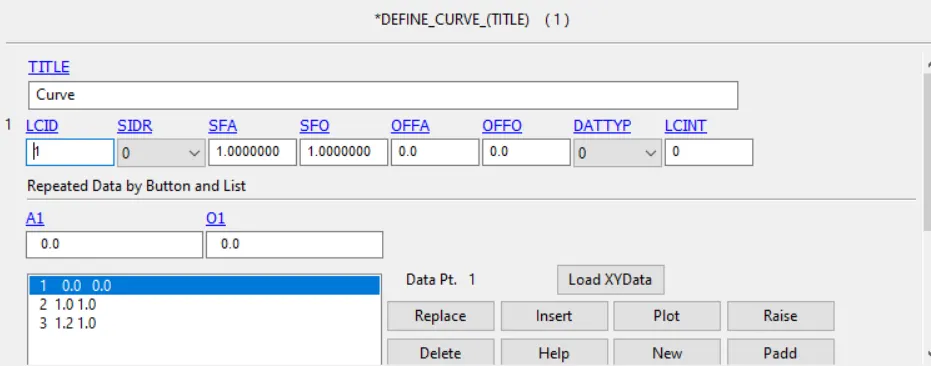
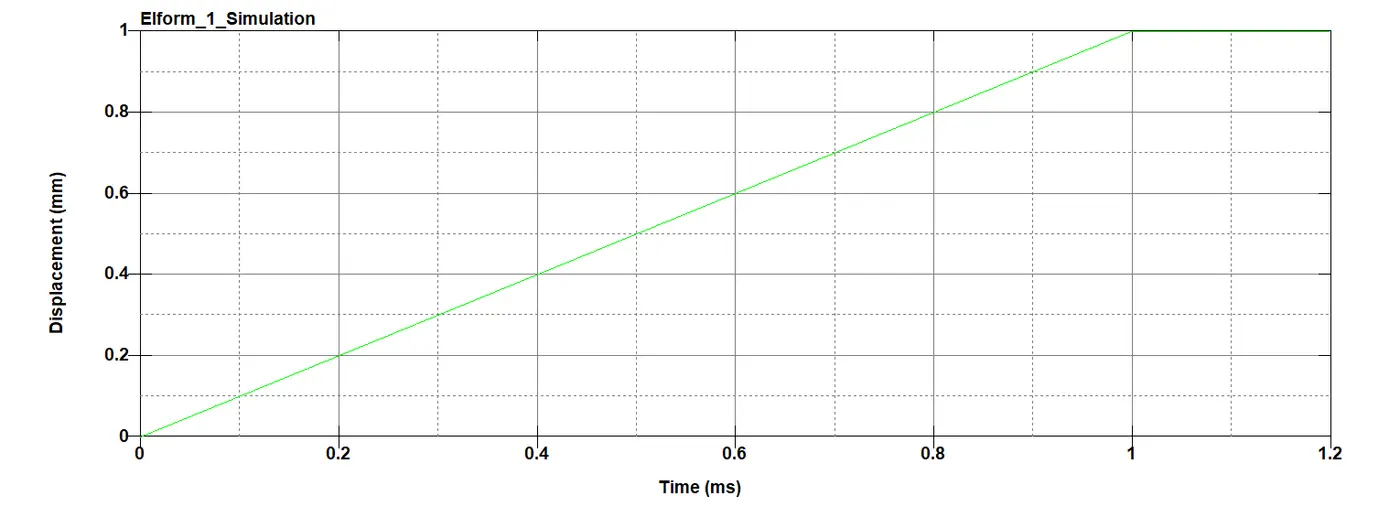
The scale factor is assigned in the boundary condition card.
9. Go to Keyword Manager>>Boundary Condition>>Select the nodes on the y-z plane and assign the curve ID defined in step 10 as the displacement value. This is shown in the figure below.
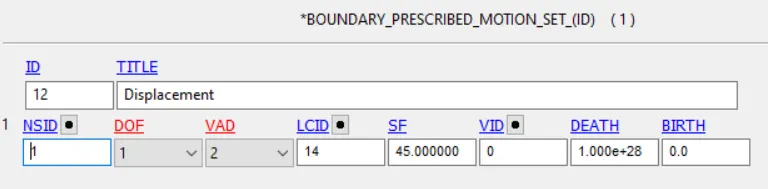
10. Create *CONTROL_IMPLICIT_GENERAL and *CONTROL_IMPLICIT AUTO cards from the control card in the keyword manager. This is shown in the figure below.


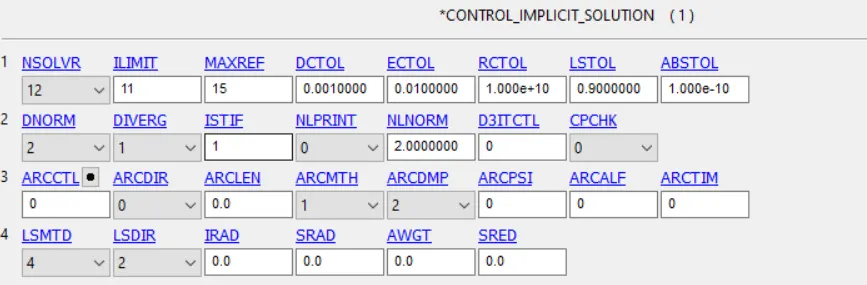
11. Create *CONTROL_IMPLICIT_SOLUTION and *CONTROL_IMPLICIT_SOLVER cards as shown in the figures below.
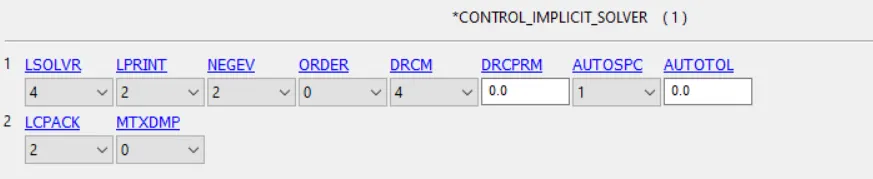
Create a total *CONTROL_TERMINATION of 1ms.
12. The following output requests are placed.
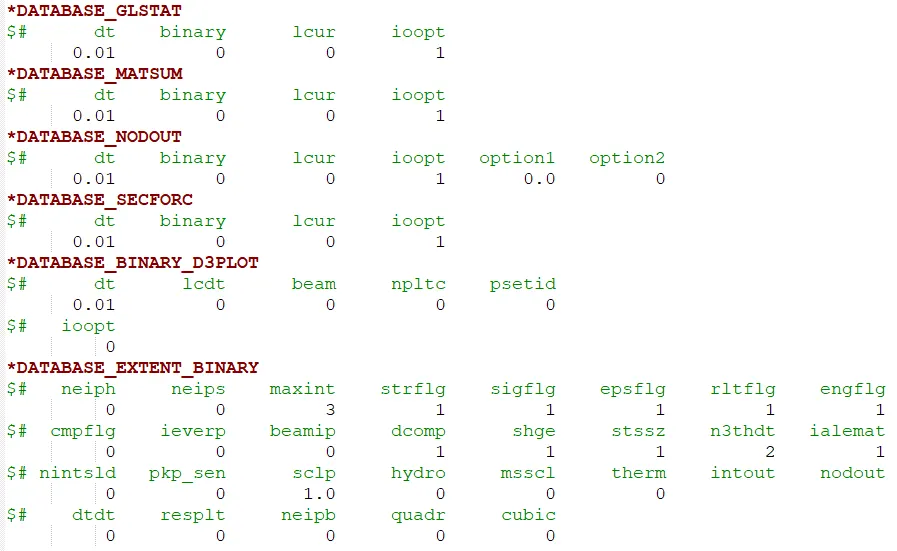
13. Save the file with a suitable name with .k extension and run the simulation.
RESULTS AND DISCUSSION:
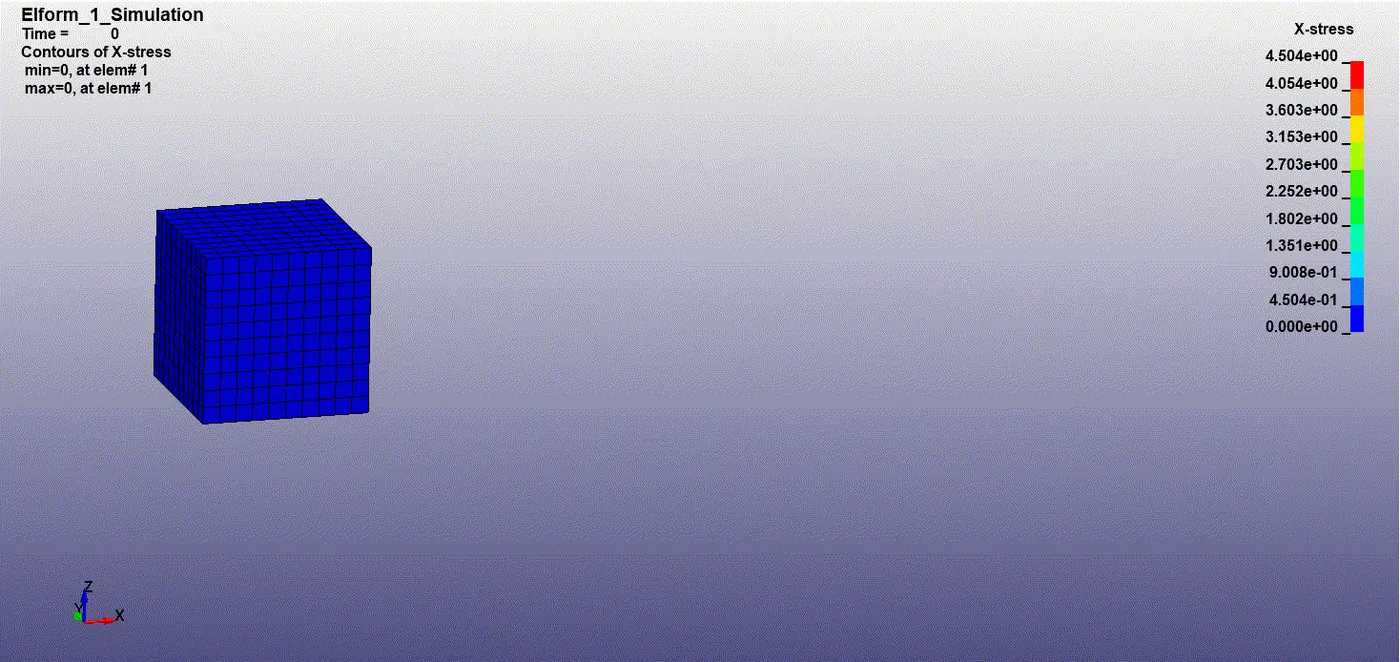
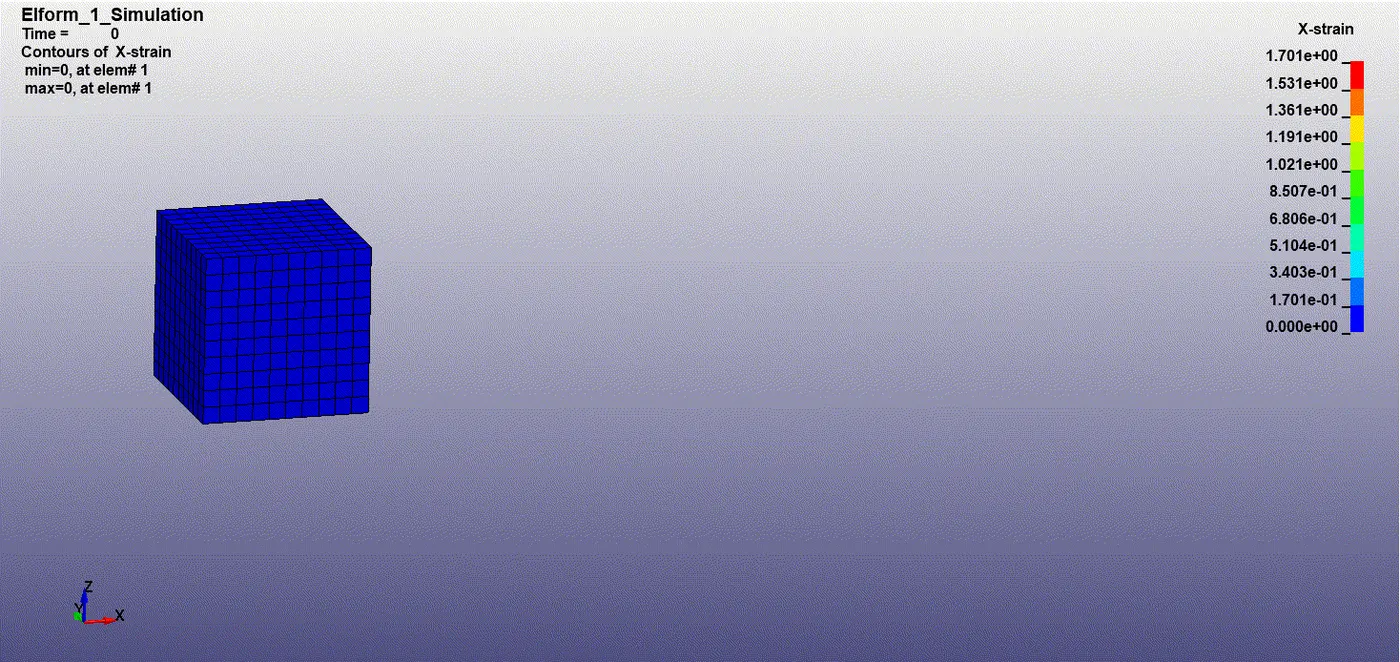
Case 1: ELFORM 1 element formulation
The X-Stress and X-Strain contours are shown in the figures below.
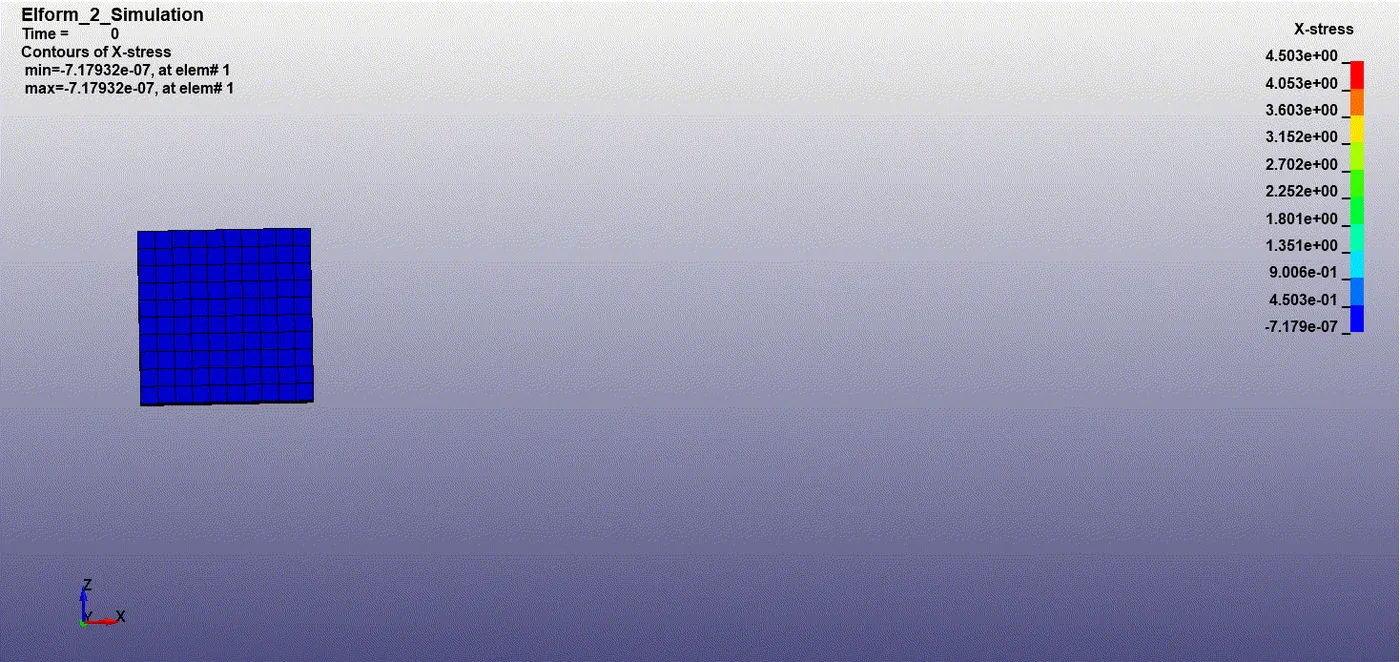
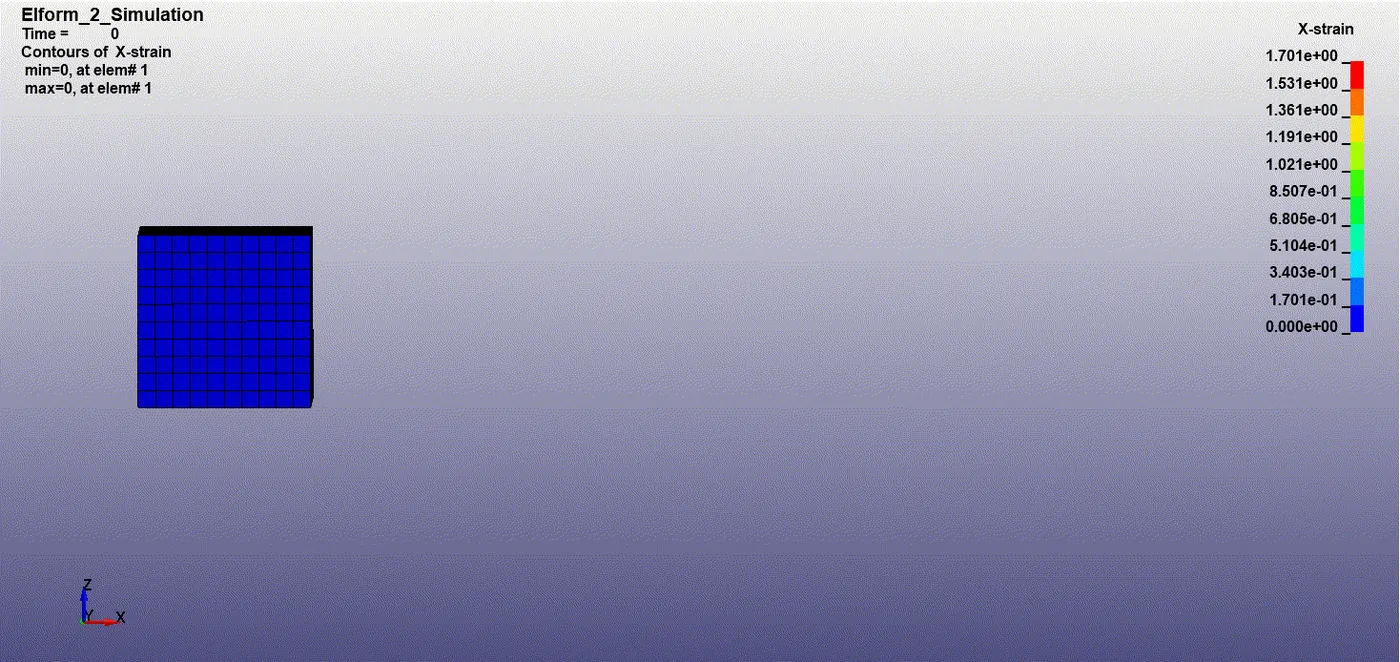
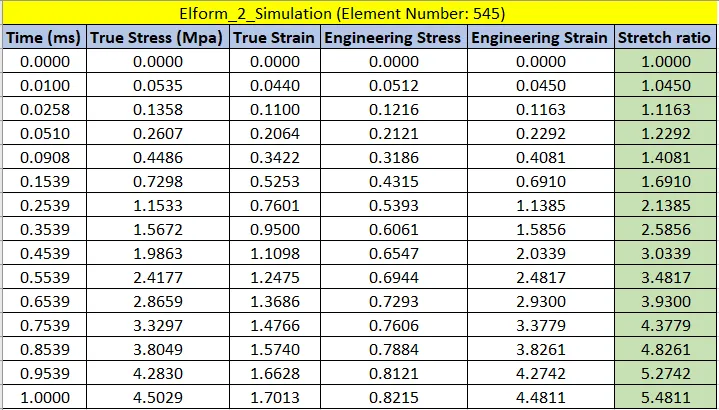
Case 2: ELFORM 2 element formulation
The X-Stress and X-Strain contours are shown in the figures below.
Case 3: ELFORM -1 element formulation
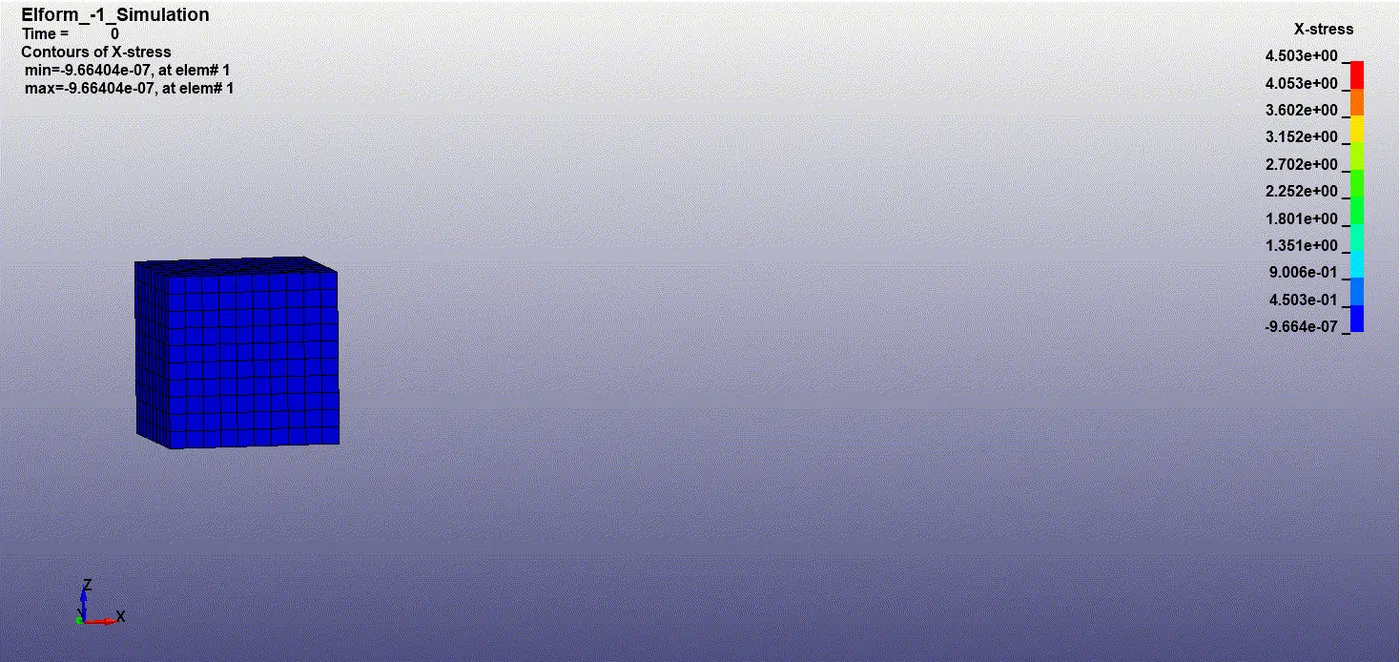
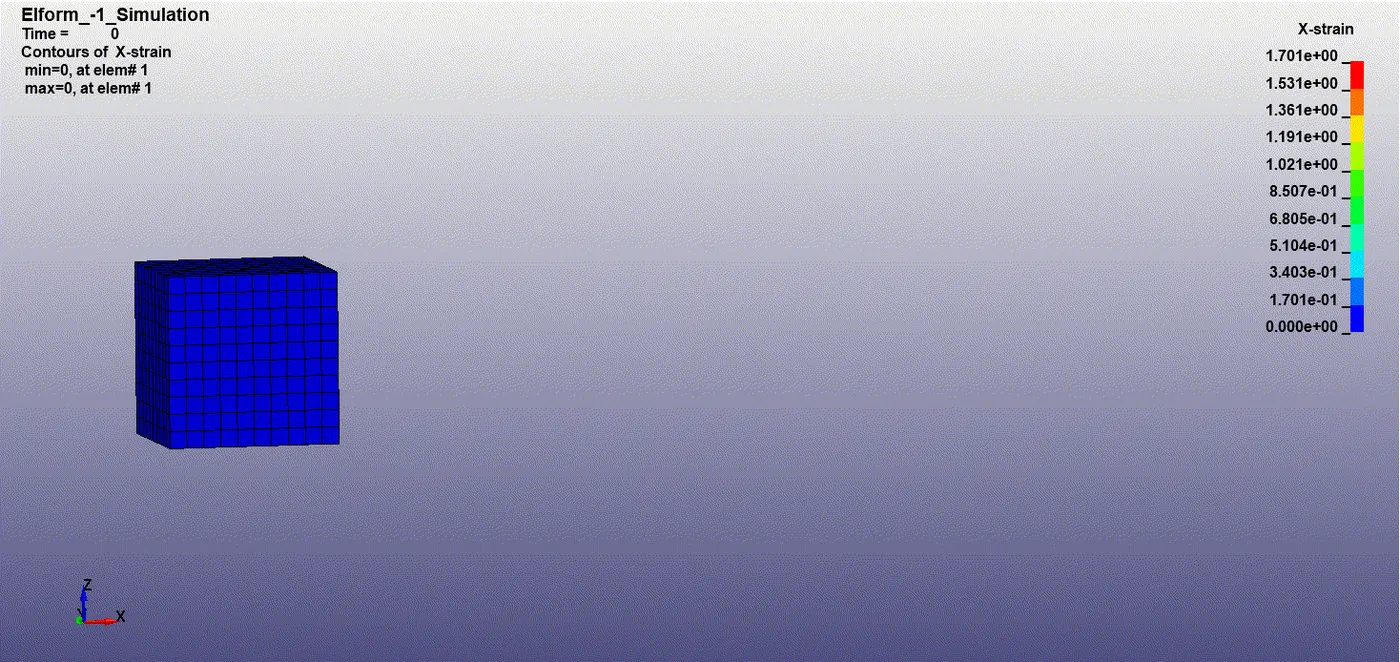
The X-Stress and X-Strain contours are shown in the figures below.
Case 4: ELFORM -2 element formulation
The X-Stress and X-Strain contours are shown in the figures below.
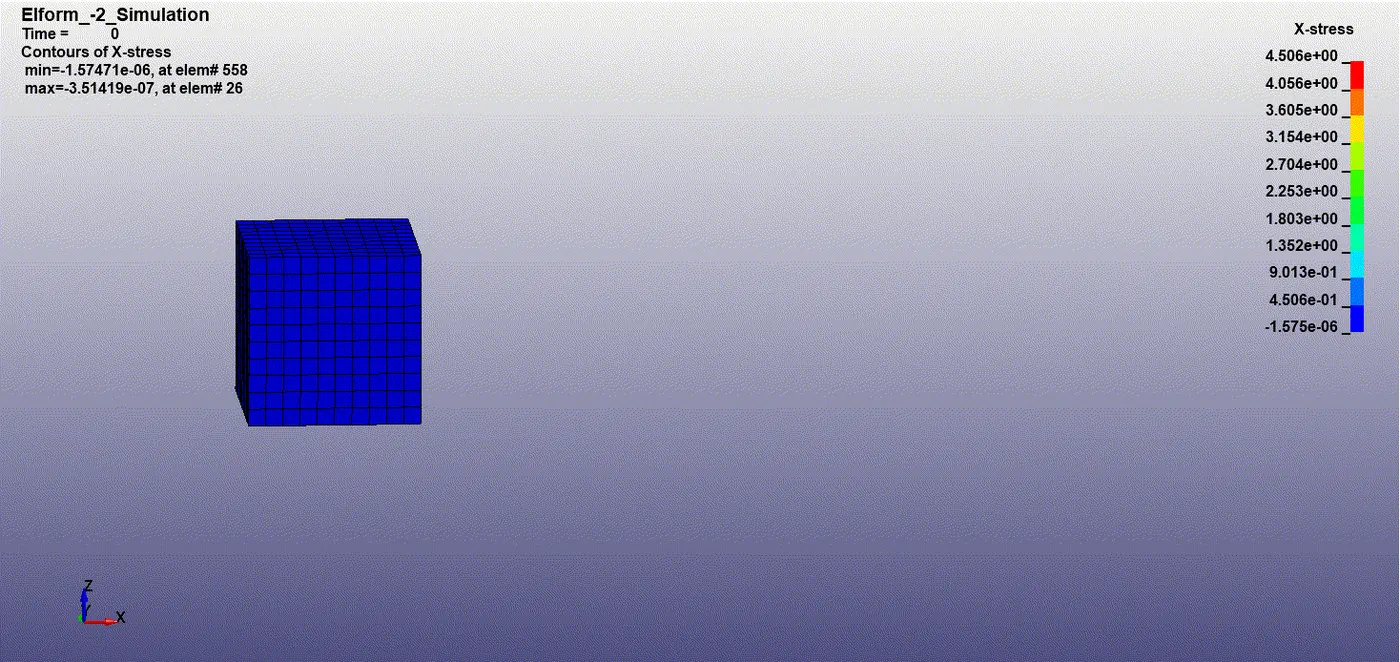
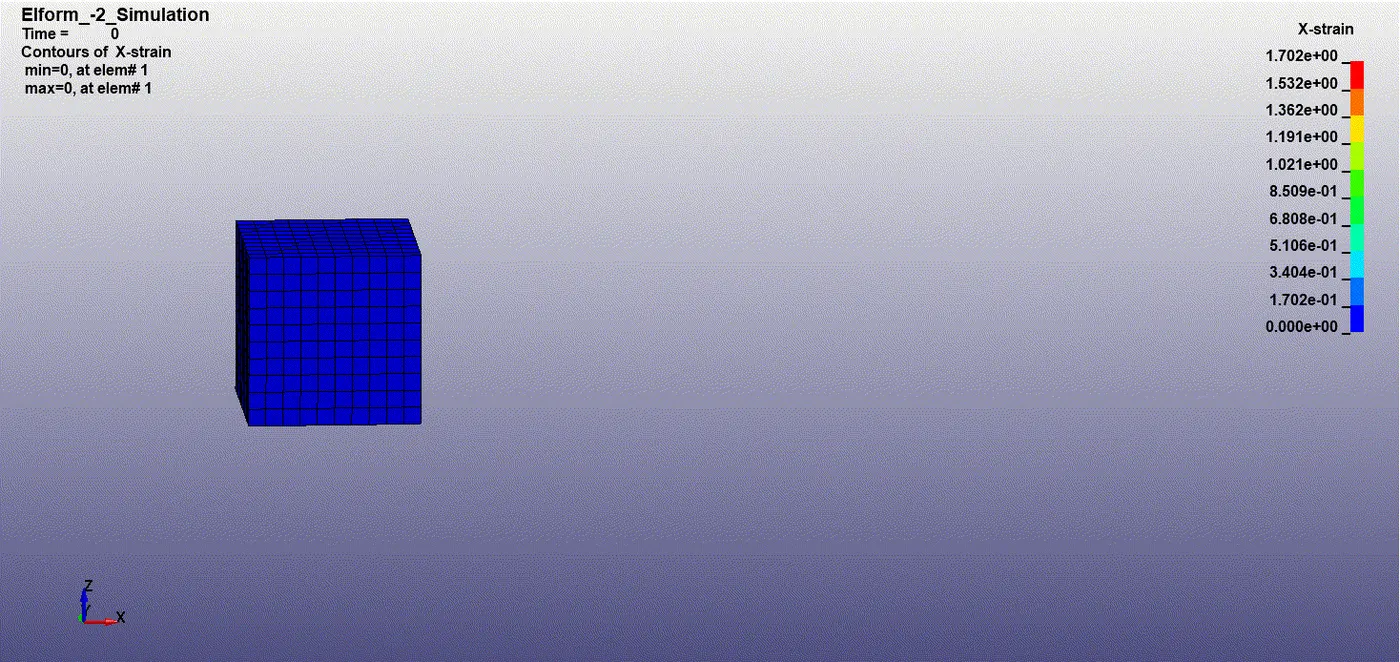
From the results, it is observed the maximum value of X-Stress and X-Strain are same for all the element formulation and the values are 4.5 MPa and 1.7 respectively.
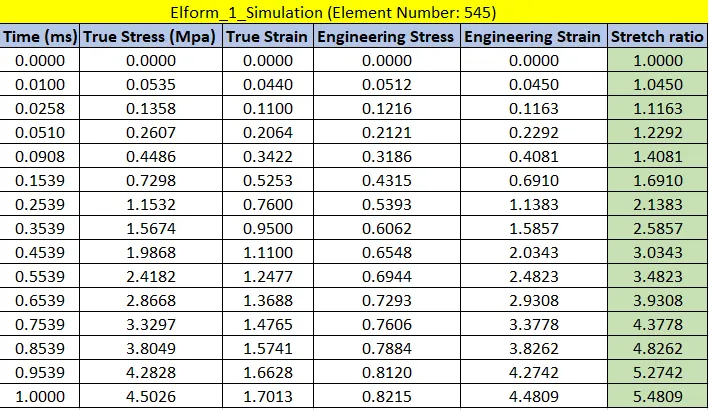
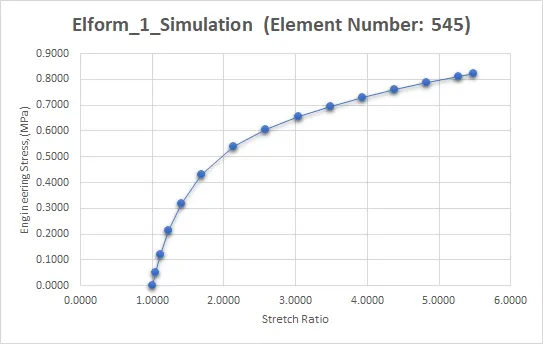
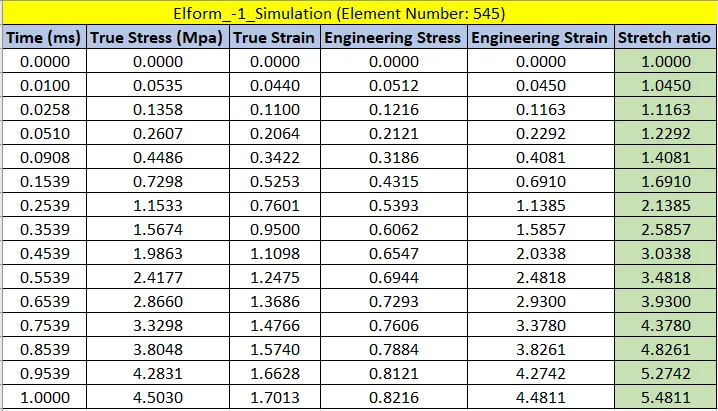
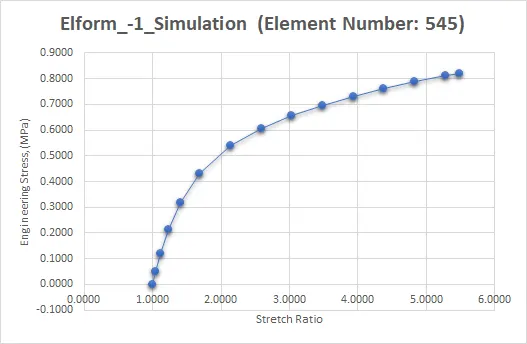
The values of stretch ratio obtained for all the four cases are shown below.
Case 1: Elform 1 element formulation
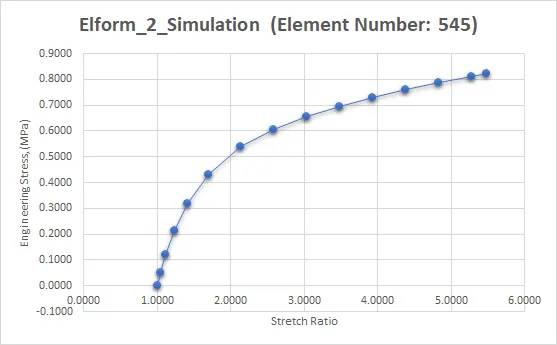
Case 2: Elform 2 element formulation
Case 3: Elform -1 element formulation
Case 4: Elform -2 element formulation
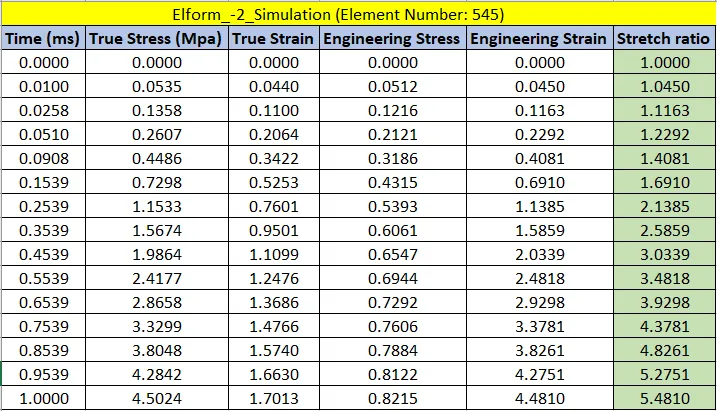
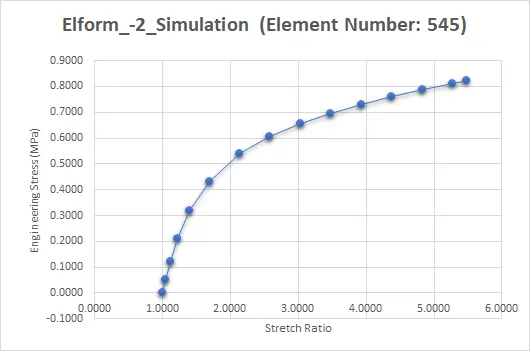
From the stretch ratio plots, it can be inferred that there is a huge deviation from the actual plot given in the problem statement. The plots for various element formulation is almost the same. It is due to the simplicity of the model. If there is a complex geometry involved then significant change can be observed in the results. Here, the actual testup might not be given as the boundary conditions for the problem. For example, temperature plays a significant role during the test. Also, the rate of application of load highly varies in actual when compared to simulated results thereby causing deviation in the obtained results.
Note:
1. For comparison, the values of X-Stress and X-Strain values are not of much weightage. In general, the plots obtained is compared to get a clear distinction of the results.
2. The value of displacement is calculated using the true strain and stretch ratio formula. This is shown below.
`lambda=1+epsilon_e`
Given stretch ratio is 5, therefore value of `lambda=5`
`5=1+(deltal)/10=>deltal=40mm`
Therefore, displacement is taken as 45mm.
3. For iteration purpose, if larger displacement values are taken, then the convergence of solution might not happen thereby bringing in the inconsistency in the solution. However, this is directly dependent on the material taken.
4. For all the cases the simulation time is 4-6 seconds. This value cannot be interpreted or compared since it is largely dependent on the system configuration.
5. The engineering stress and strain values are calculated from true stress and strain using the formula given below.
`bbsigma_(engg)= bbsigma_(true)/(1+bbepsilon_(engg)`
`bbepsilon_(engg)= e^(bbepsilon_(true))-1`
`lambda=1+epsilon_e`
6. For obtaining the values of stretch ratio, the Mean-Ipt-X-Strain is taken as the reference.
CONCLUSION:
The case setup was done as per the objective and the corresponding output requests are obtained. Implicit solver is used for the simulation because the effect of strain rates are minimal.
The value of stretch ratio is calculated for various element formulations.
Drive Link: https://drive.google.com/file/d/1mItJ6H5rFraKd5xH2AdzGK7edSIe4WXO/view?usp=sharing