Week 6.2 - Setting up a model (Hanging Node)
Aim: To analyze the temperature and velocity distributin for the given hanging node assembly.
Introduction: The Hanging node assembly consists of a mother board, BGA packages, CPU, a heat sink, a fan (internal type), DIMM (Dual In-line Memory Module) which consists of 4 heat sources, a guide sweep, 2 grilles, a sheet metal assembly as major components and number of serial and parallel ports are mounted on the mother board.
The CPU generates a heat of 40 W and the 8 sources in DIMMs generate 2 W each. The fan rotates at 4000 rpm. A free type fan is provided on top of the fan assembly. A heat sink is used to dissipate the heat generated by CPU.
Procedure:
Step 1: The .tzr file is unpacked in the Icepak.
Step 2: The CAD geometry is analyzed and the boundary conditions are noted. The geometry is shown in Fig. 1
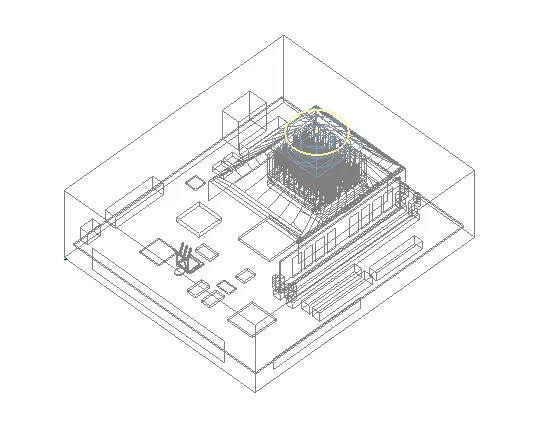
Fig. 1. Hanging node geometry
Step 3: Without change in any conditions, a coarse mesh is generated and resulted in 0.7 million elements approx as shown in Fig. 2.
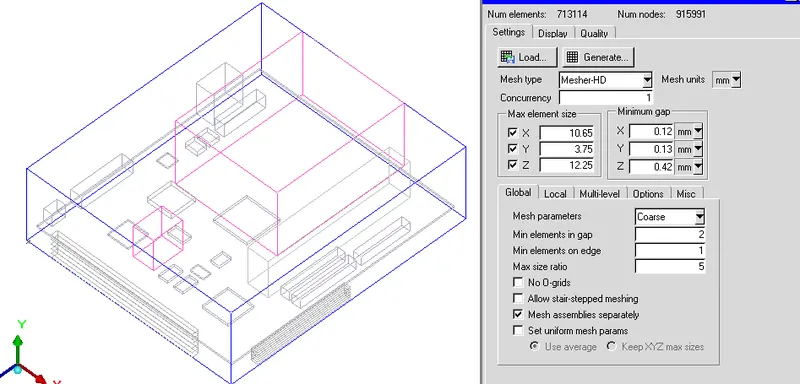
Fig. 2. Mesh count
Step 4: Figures 4, 5 and 6 show the mesh in z direction, x direction and y direction respectively.
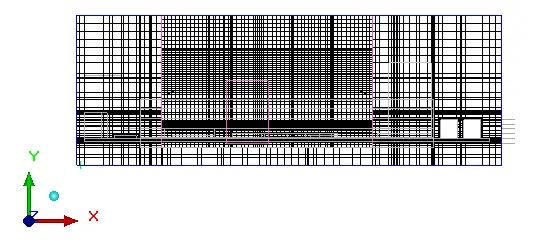
Fig. 4 Mesh in Z direction
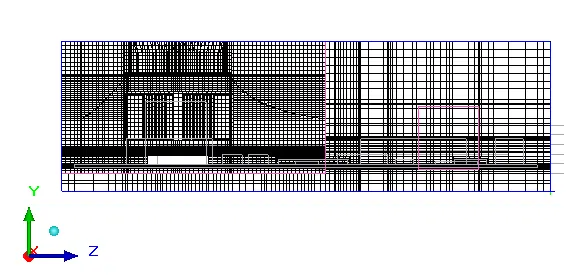
Fig. 5 Mesh in X direction
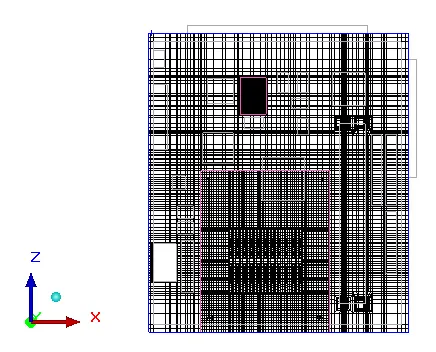
Fig. 6. Mesh in Y direction.
Fig. 7 shows the solid filled mesh of the sheet metal assembly.
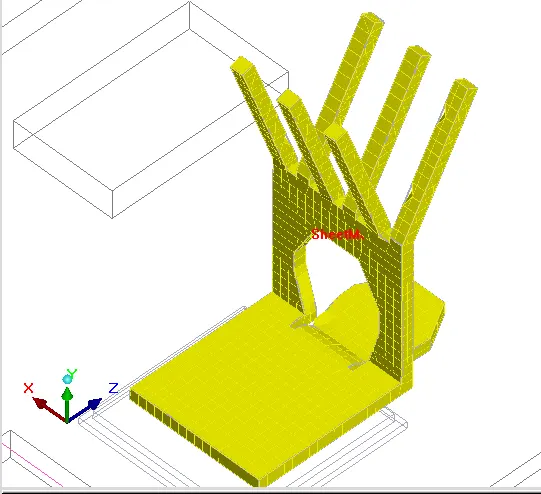
Fig. 7. Sheet metal assembly mesh.
Fig, 8 shows the meshing of guide sweep
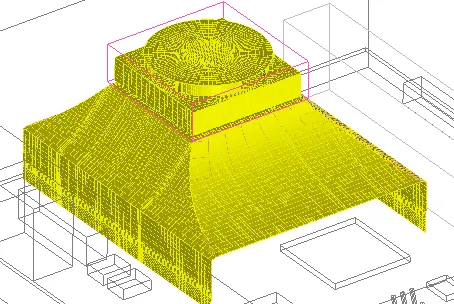
Fig, 8 Mesh in Guide sweep.
Step 5: The problem is solved using zero equation turbulence model. A standard discretization scheme is used for pressure and first order scheme is used for momemtum and temperature. The convergence level used for flow and energy are 1E-04 and 1E-07 respectively.
The results are shown below.
Step 6. Results
The temperature distribution in Z direction and Y direction are shown in Fig. 8 and Fig. 9 respectively.
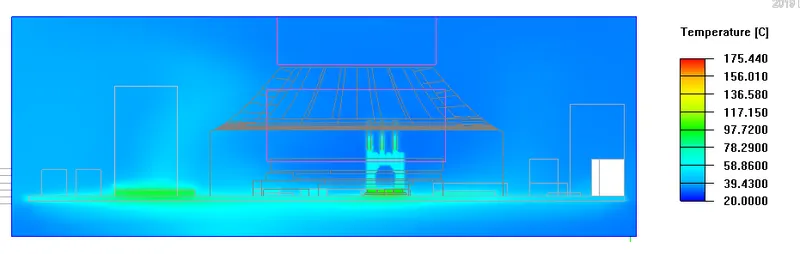
Fig. 9 Temperature contour in Z direction
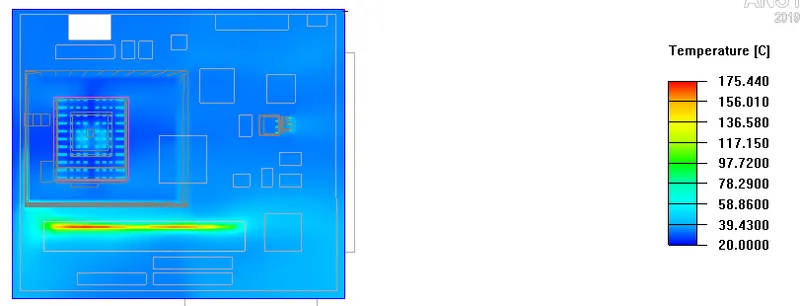
Fig. 9 Temperature distribution in Y-direction
It is seen that the maximum temperature is around 175oC and it is seen in the vicinity of the heat source region in DIMMs.
Fig. 10 shows the temperature distribution of sheet metal assembly. It shows that the base is having afftected with high temperature around 105oC.
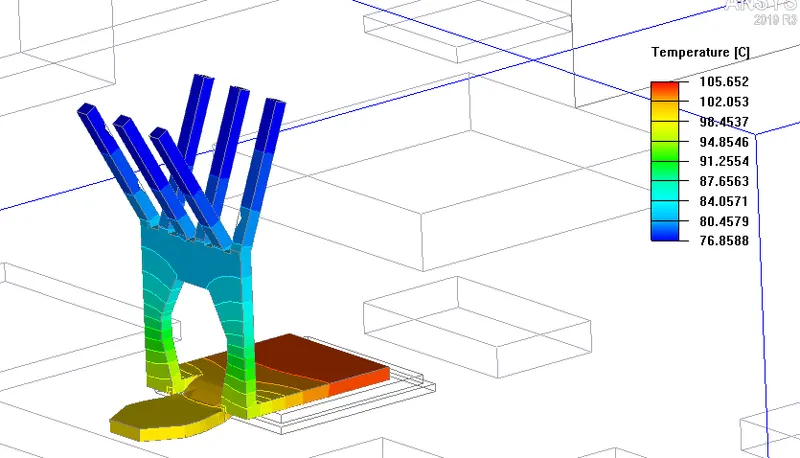
Fig. 10 Temperature distribution in heat sink
Fig. 11 and Fig. 12 show the temperature distribution in CPU and DIMMs assembly.
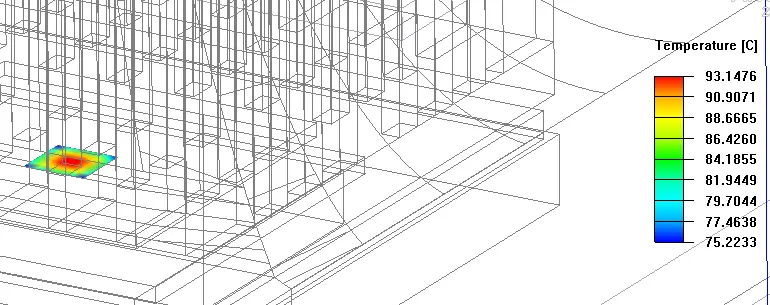
Fig. 11 Temperature distribution in CPU.
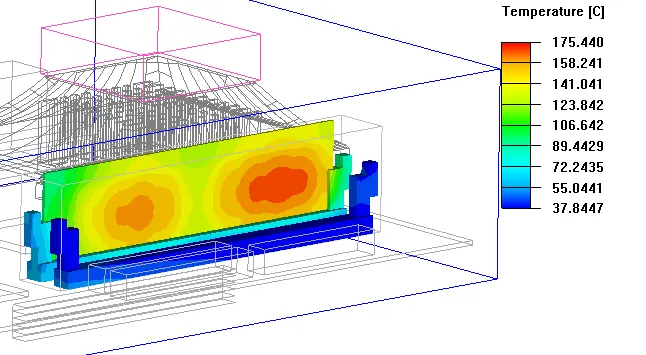
Fig. 12 Temperature distributin in DIMMs.
Fig. 13 shows the velocity distribution in X - direction It is seen from the contour that the maximum velocity is seen in the fan region and is found to be around 5.4 m/s.
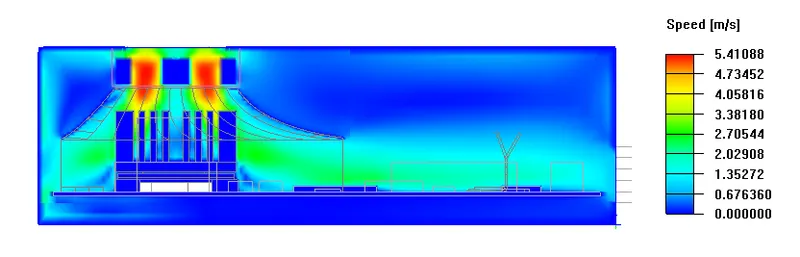
Fig. 13 Velocity distributin in the model in X- direction
The z-direction particle trace is animation is given in the following link.
https://www.youtube.com/watch?v=zjF7J2lt8zs
Conclusion:
It is seen from the results that the temperature in the cabinet is less than 200oC. However, the temperature is still high and hence better cooling is required. Since fan and heat sink are used to cool the CPU, hence the temperature in the CPU less than the DIMMs. The sheet metal assembly is also affected because of hence high temperature is seen. Still more area is to be provided for air to flow inside the cabinet for better heat dissipation in DIMMs.