Week 5 Battery characteristics using drive cycle
1) The objective is to simulate a generic battery model, for charge and discharge characterisitics using UDDS drive cycle data.
UDDS stands for Urban Dynamometer Driving Schedule. This data consists of the values of velocity of a vehicle at given time as per a certain driving style. The data is speed vs time plot.
---Importing the drive cycle data---
For the sake of simulation, we use a signal builder to mimic the data of the UDDS cycle. However, the signal builder takes the data in the form of current profile corresponding to the drive cycle data, to feed into battery module as a current source.
So, the data available is converted into a current profile wrt time and then imported into the signal builder.
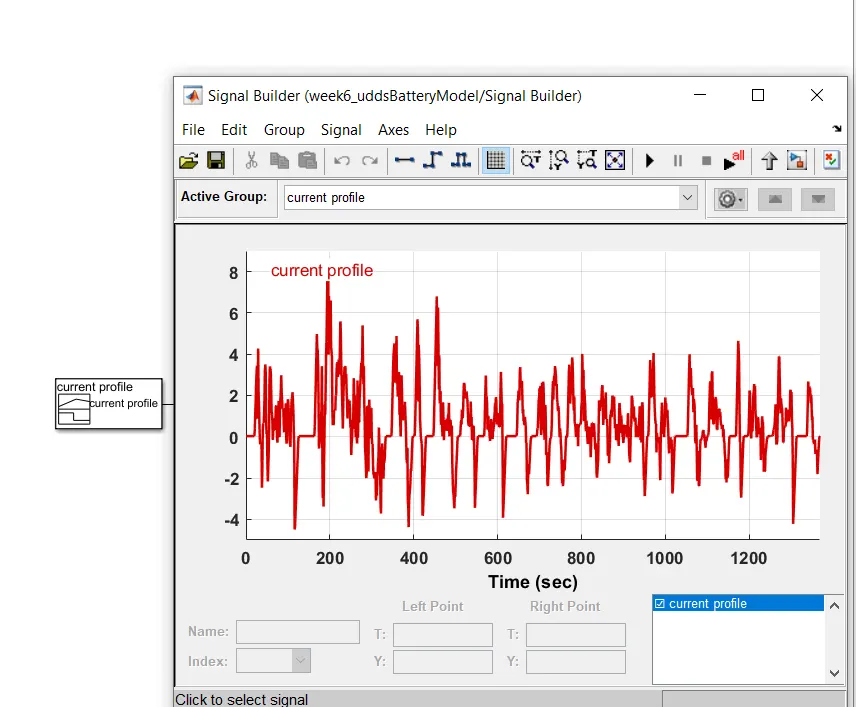
--making the model--
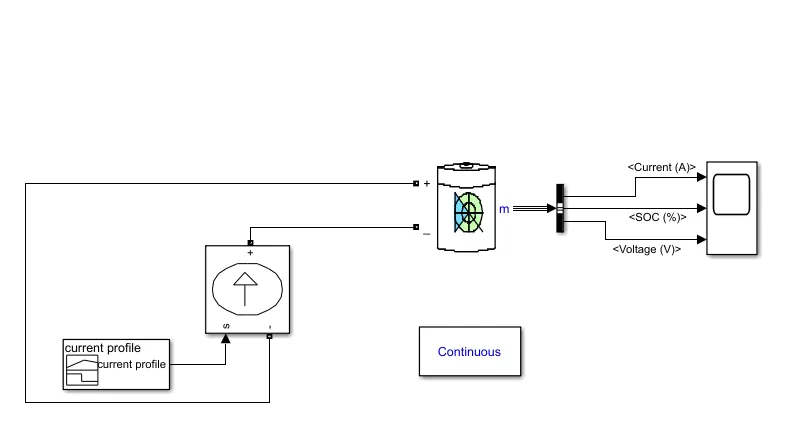
The battery settings are left as default and it is fed the current profile data using a Controlled current source which is used to convert input signal into an equivalent current source.
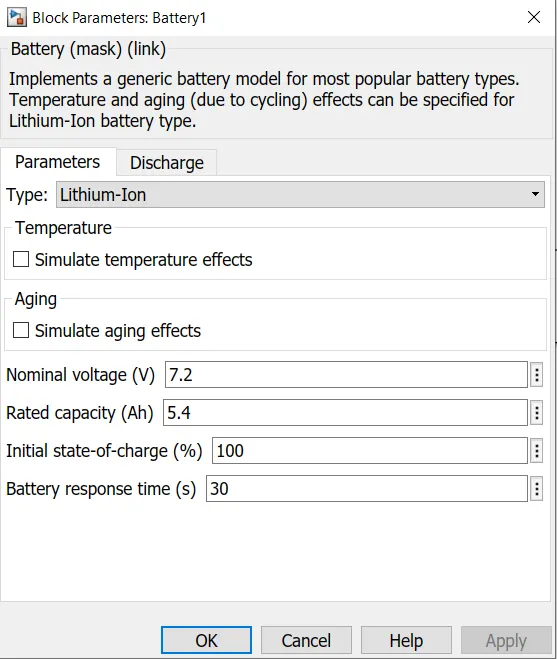
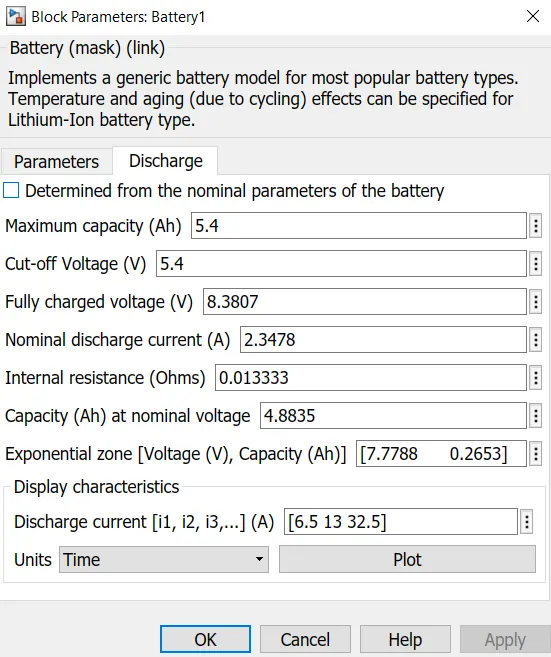
The battery outputs 3 sets of data, Current, SOC and the voltage. Using a bus selector the signals are divided and veiwed individually in the scope.
The continuous block(powergui) is put in the model for the solver to solve the continuous simulaton demands by the current profile.
The simulation is run for 1369 seconds.
--Result--
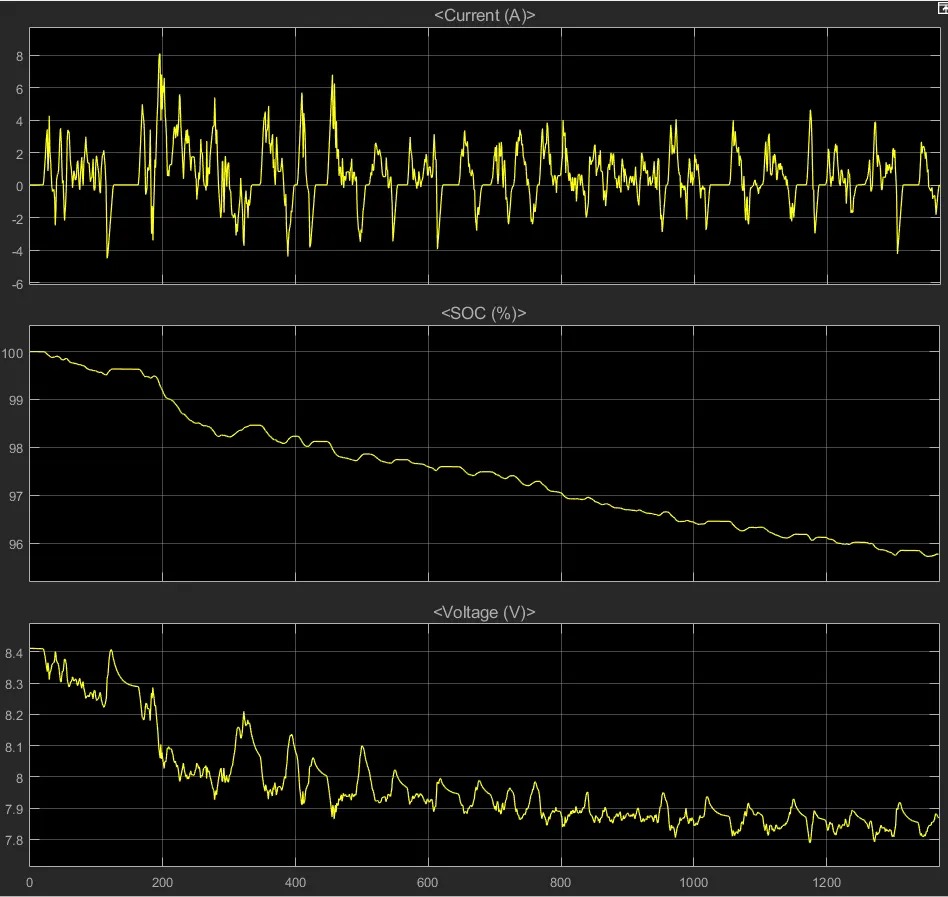
Observing the results shows us that:
- As the battery discharges, the SOC reduces and the voltage of the battery reduces.
- The negative current responds to the charging of the battery where the SOC and the voltage of the battery increases. The SOC and Voltage plot depends on the current profile.