Week-4 Challenge WOT Condition Part-2
TITLE= WOT Condition part 2
AIM =
1) write the difference between mapped and dynamic model of engine ,motor and generator also change model type
2) calculate miles per gallon through model and mention which factors are considered to model fuel flow.
3) to Run the HEV ReferenceApplication with WOT drive cycle. Change the grade and wind velocity in the environment block. Comment on the results.
4) by Keeping all other parameters same, compare the simulated results of hybrid and pure electric powertrains.
1.a) difference between mapped and dynamic model of engine ,motor and generator.
|
Difference between mapped and dynamic models |
||
|
Mapped |
Dynamic |
|
|
Features |
In mapped models, the data used for the operation and simulation are to be entered in a form of lookup table, which would be then configured with the operational parts and the analysis would be formed. |
In dynamic model, it understands the behaviour of the part/element and then it behaves accordingly. It gives detailed analysis for the variations entered by us in the specifications whereas it simulates according to real and dynamic operations. |
|
Advantage |
If the detailed specifications/lookup table data is available with us the simulation becomes easier and it gives the results on the basis of data interpreted also known as global based model. |
It operates dynamically depending on the situation of operation detailed data and specifications are not required and this simulation gives the detailed analysis of the components simulated also known as real time-based model. |
|
disadvantage |
More data to be collected and some assumptions might also have to be taken. |
Could not simulate as per our customized specifications |
|
Effects on components /parts for simulation |
||
|
Engine |
Engine performance could be simulated with the array of data interpreted in the system. Whereas all conditions such as engine operations, power, efficiency could be measured accordingly. |
Engine performance will be simulated as per the original/real engine specifications of the designated vehicle chosen for simulation. All results would be obtained with real-time details. |
|
Motor |
Motor specifications such as rpm, maximum efficiency, heat and such specifications are to be entered for simulating the results. |
The actual details for the same would be considered and the results would be obtained. |
|
Generator |
Specifications for battery torque, battery current, motor torque and others are to be entered for simulation. |
All the details and specification would be considered as per the actual and dynamic state ,the results of the same would be obtained . |
1.b) how to change the mapped system to dynamic system or dynamic system to mapped system.
steps 1) in command window ,type 'autoblkHevStart' .
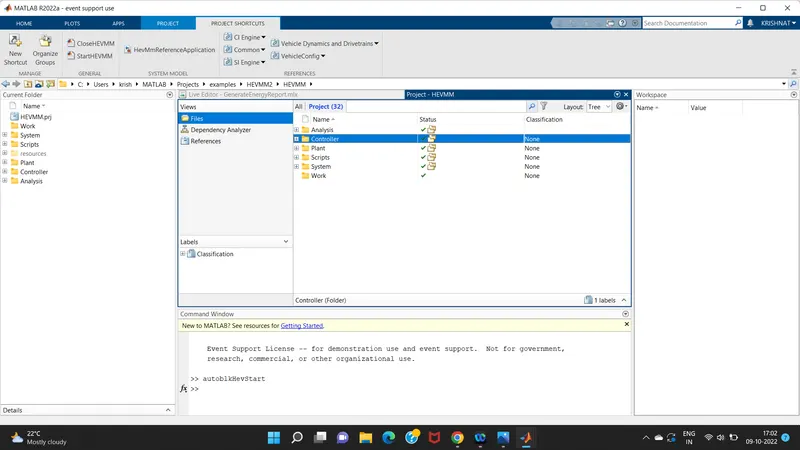
then we get simulation model of HEV
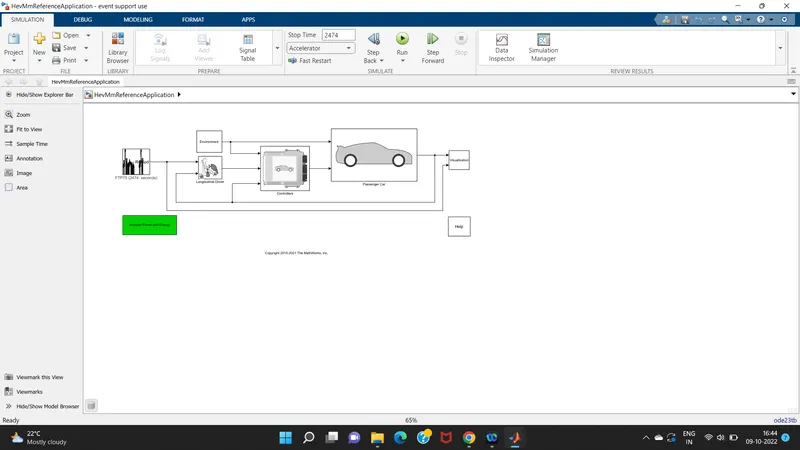
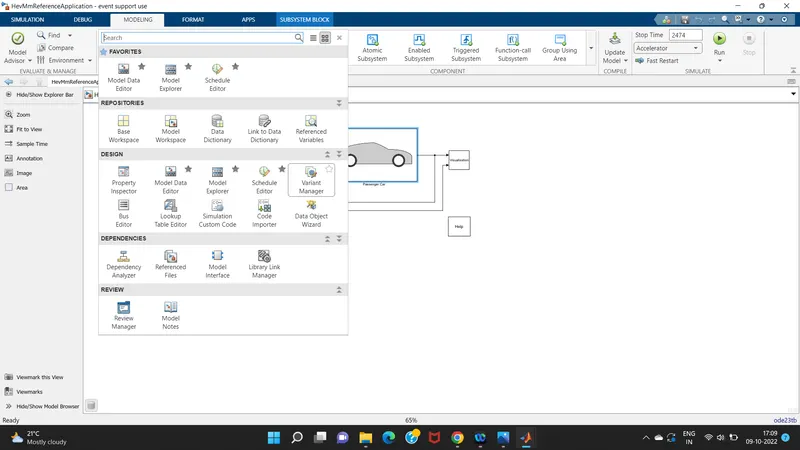
STEP 2) go to modeling in that go to varient manager.
in that we find all the names of blocks of systems and sub-systems.
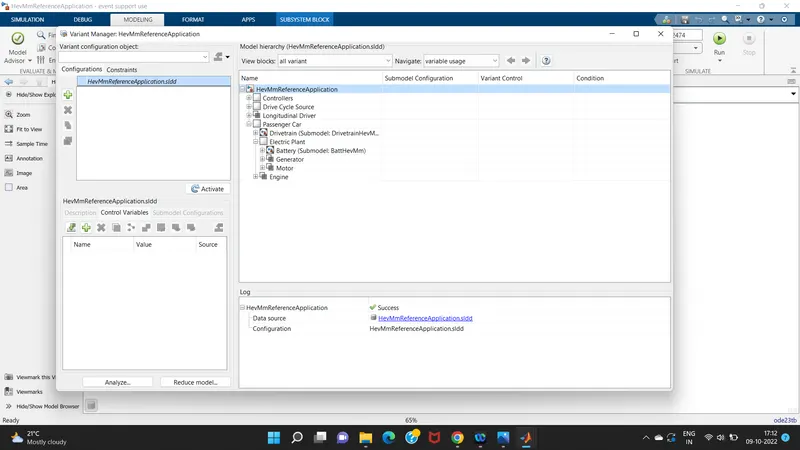
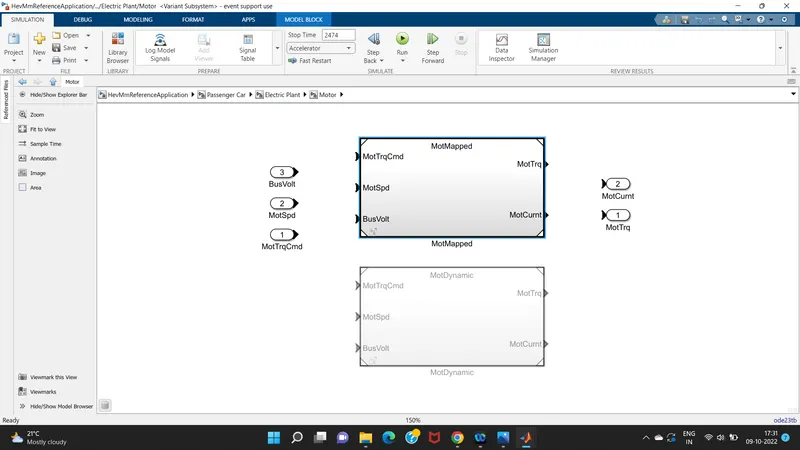
step 3) then go to motor ,find which block is active in the motor sub-system.the motor sub-system is consist of mapped and dynamic data. but in this case we see dynamic data is not active.then go to the 'set as label model active choice'.then the dynamic data will get active
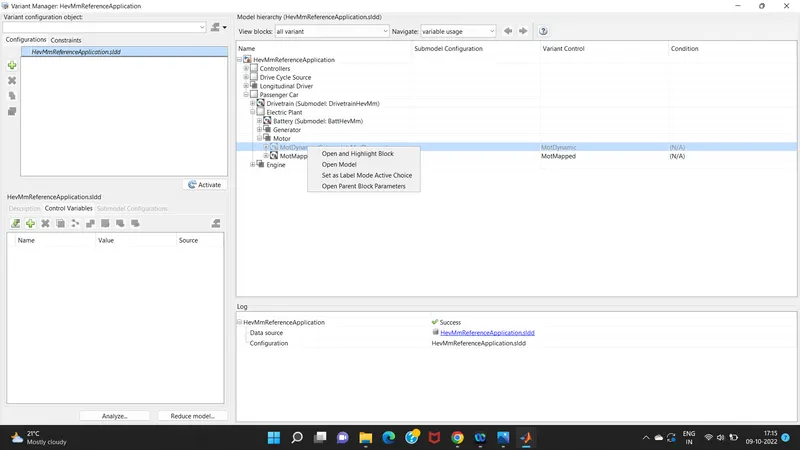
after we have seen that the dynamic data is active.
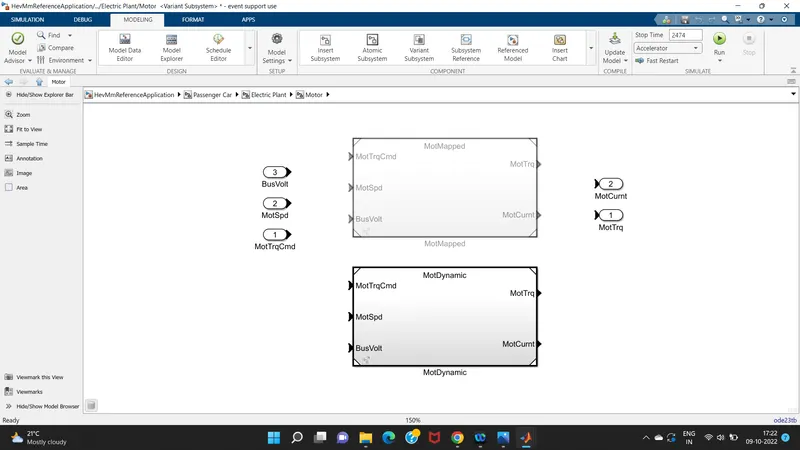
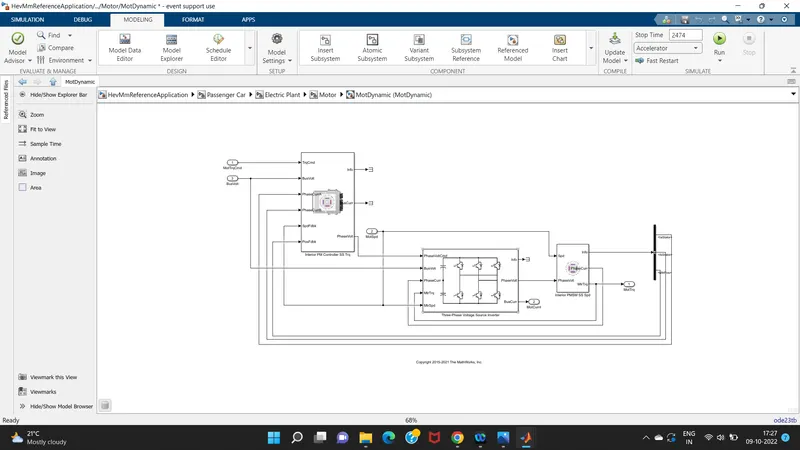
inside this dynamic mapping we get this model
step 4) if we change dynamic to mapping model then go to motor ,clearly seen that the model is dynamic so for changing to mapping ,go to motmapped and then 'set as label mode active choice'
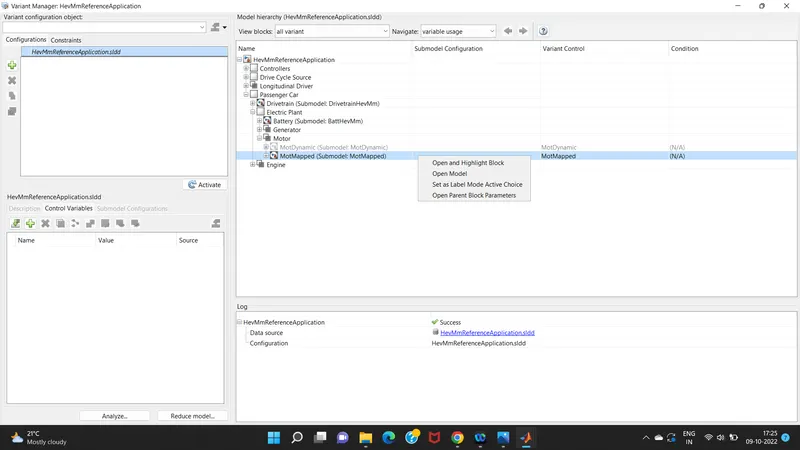
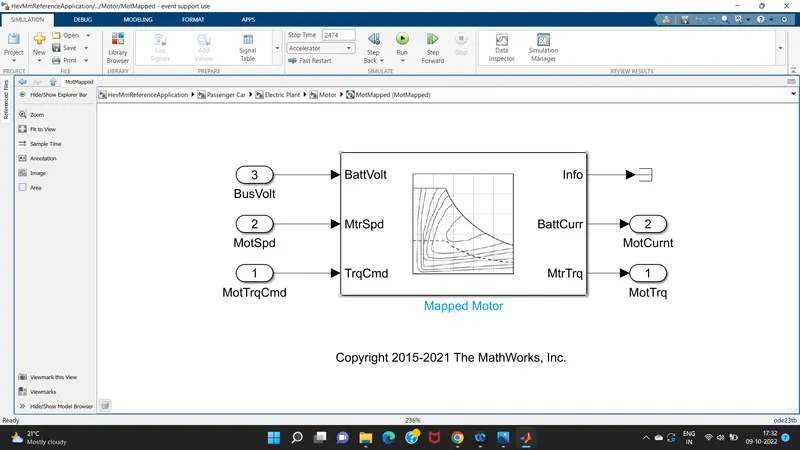
after this we get mapped data is active.
inside motor mapping we get following model.
SHORT CUT METHOD=
in this shortcut method ,it is possible that,we can change the system without using the variant manager.
STEPS:
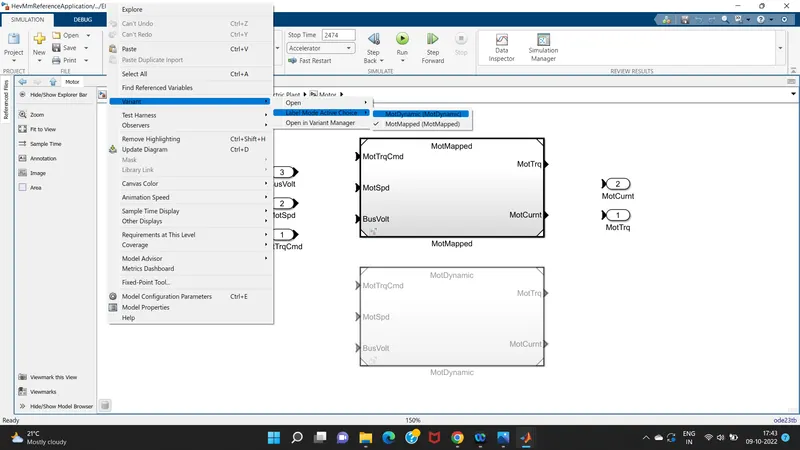
1) In the simulation subsystem block here the mapped data is activated ,so to change it to dynamic data.
2) left click the mouse anywhere in the blank page of the motor subsystem and we get the different menu options in the menu like explore,paste ,select all,observers etc.
in that option goto 'varient' and open 'label model active choice' and select 'dynamic over mapped'
now the mapped sub system is deactivated and the dynamic sub-system is activated
it helps instead of opening the variant manager ,it saves time and work done so quickly to changes.
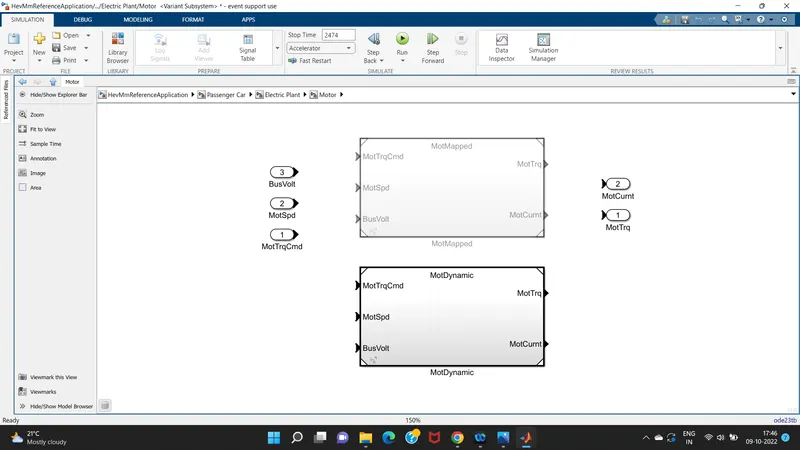
3) for changing dynamic to mapping vice a versa.
part 2.a) how does the model calculate miles per gallon? which factors are considered to model fuel flow?
MPGe= in the US to compare the efficiency of gasoline vehicle with the BEVs ,PHEVs or FCEVs ,MPGe unit was formulated.
MPGe stands for miles per Gallon equivalent.it has been found that 1 gallon of gas has the same amount of energy as 33.7 kwh of electricity.
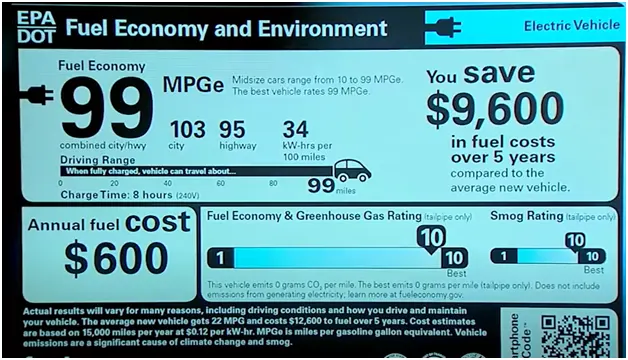
the above rating is given by EPA(Environmental Protection Agency).here only one fuel economy is given as it runs only by electricity as it is a BEV.
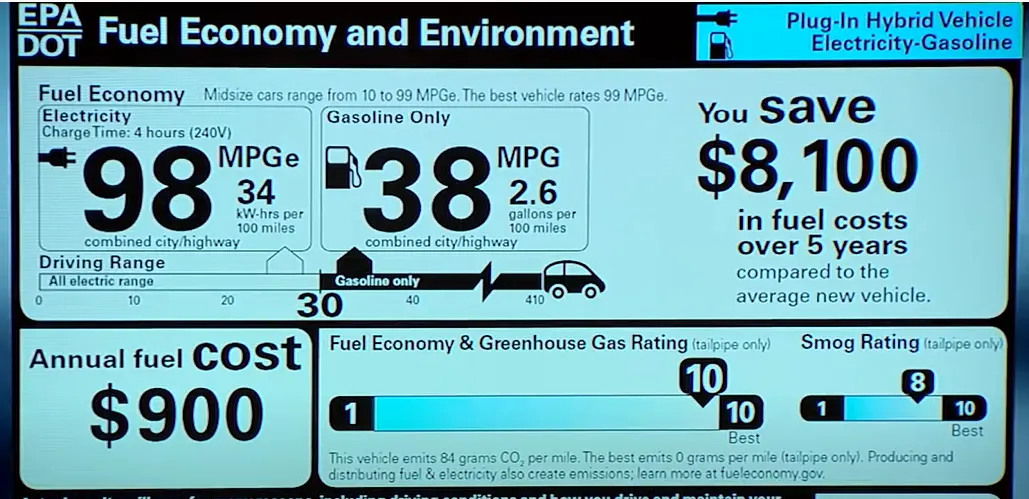
The above rating has two values as it is a PHEV. One is for pure EV mode and other one is for pure engine mode,
Eg. a battery propells the vehicle for 3.125 miles per kwh capacity of battery.so,
3.125 miles /kwh *33.7 kwh/gallon =105 MPGe
in the model it is calculated by this block:
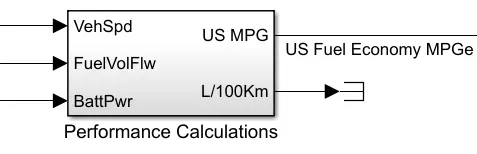
the inputs are vehicle speed ,fuel volume flow and battery power.
this vehicle model have fuel and battery both energy source are available .powertrain blockset provides miles per gallon measurement system shown in below figure.
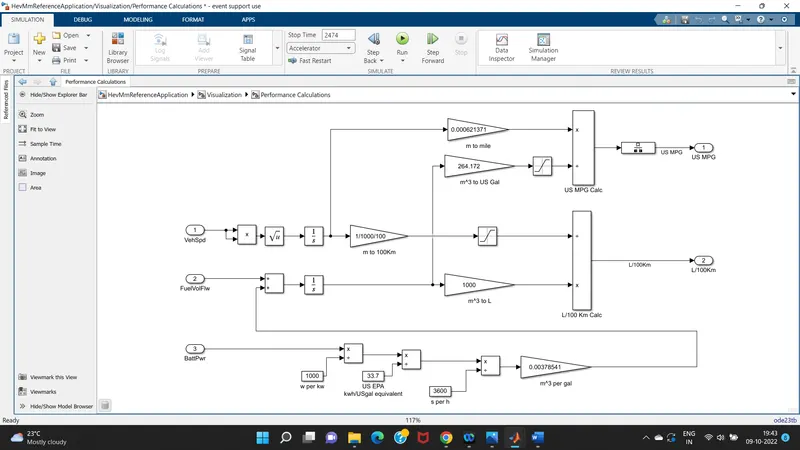
vehicle speed=
- vehicle speed is important factor while measure fuel consumption in the vehicle.vehicle speed change accordingly as fuel consumption scenarious of the vehicle get changed.
- for this measurement in this model we use product block,sqrt block,integrator block,gain block,saturation block.all the blocks connected with product.
- gain block used to convert the distance m to km ,so gain block value is 1/1000/100.
- integrator block used to calculate the distance according to continuous -time integation of the input signal.
- saturation block used for lower limit function.
- product block used for the productblock outputs the result of multipliying two inputs: two scalars ,a scalar and a nonscalar ,or two nonscalars that have the same dimensions .product block parameter are L/100 km.
fuel power and battery power=
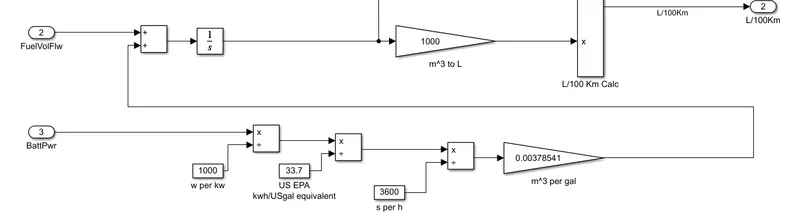
- fuel power convert m^3 to litre
- battery power convert to m^3 to gallon.
- battery power use three constant block.first constant block use for convert the battery power watt to kilo-watt .constant block value is 1000.
- second constant block use for convert emissions or energy data into concrete terms .you can understand such as the annual CO2 emissions of vehicles.constant block value is 33.7.
- third constant block use for convert the time second to hour.
- all the constant block connected with divided block.
calculating miles per gallon:
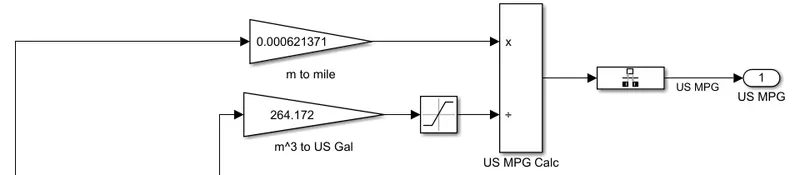
- the inputs from the vehicle the distance i found (in meters) is taken into the calculation and it is converted to the miles by multiplying 0.000621371.
- then the inputs from fuel flow (battery energy+fuel energy) taken in mA^3 is converted into equivalent US gallon by multiplying with 264.172.
- then two input connected with divide block. divide block connected with rate transition block.
- rate transition block used to handle data transfer between different rates and tasks.
2.b) the following factors are considered to model fuel flow?
- the factors to consider to model the fuel flow are CI engine or SI engine ,flue mass flow rate (Kg/s) ,engine feedback out,fuel flow .
- the fuel mass flow rate is the fuel flow which is coming from engine info.
- the factors that are considered for fuel flow includes vehicle velocity ,fuel flow and battery power.battery power is converted into equivalent gasoline flow and then the fuel flow is calculated.
- The fuel economy of an automobile relates distance traveled by a vehicle and the amount of fuel consumed.
- The amount of fuel a vehicle uses to travel a particular distance at a particular speed.
3) run the HEV reference application with WOT Drive cycle.change the grade and wind velocity in the environment block.comment on the results.
HEV reference application
the hybrid electric vehicle (HEV) reference application represents multi model HEV with an internal combustion engine,transmission ,battery,motor, generator and associated power train control algorithms.
the HEV is configured with a mapped motor and battery .this diagram shows the power train configuration.
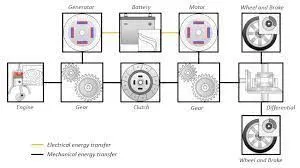
HEV reference application with WOT drive cycle.
use the command 'autoblkHevstart' in the command window to open the HEV reference application.
we can load the model from the matlab documentation and the model is represented below.
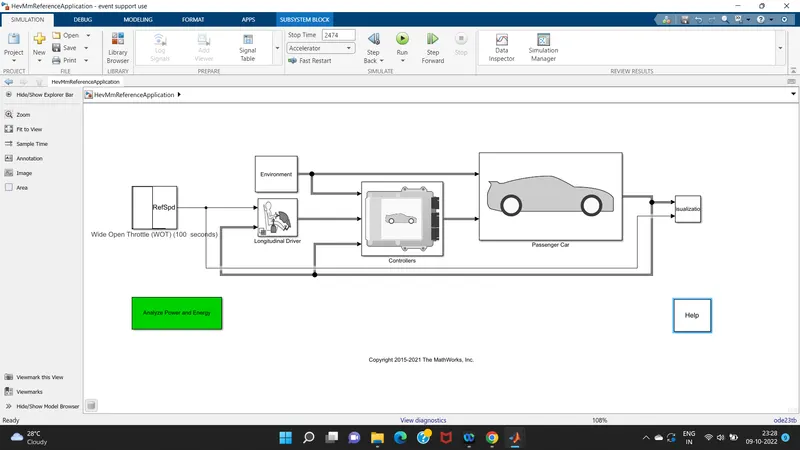
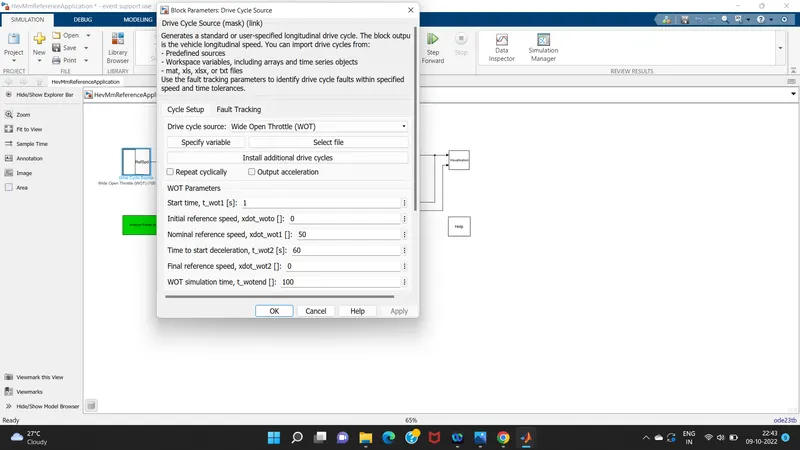
then double click drive cycle source block and then change the drive cycle to 'WOT' as shown in the below image.
also configure the parameters like time duration ,WOT start time,initial speed ,final speed ,max speed and time to start deceleration.
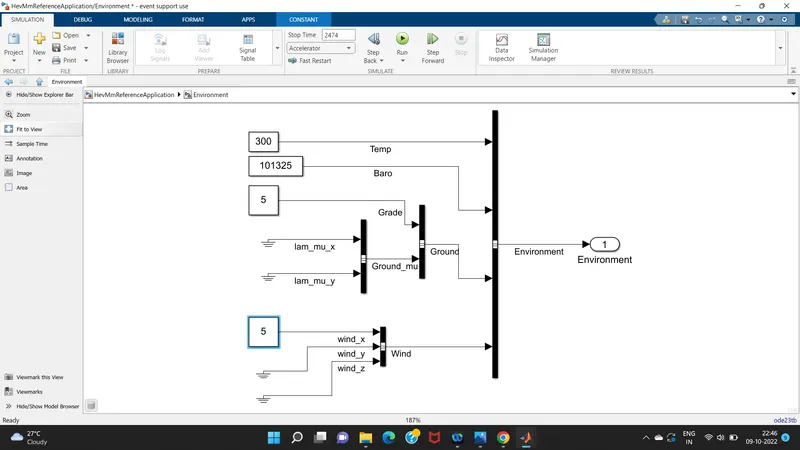
change the wind speed and grade from the environment block.
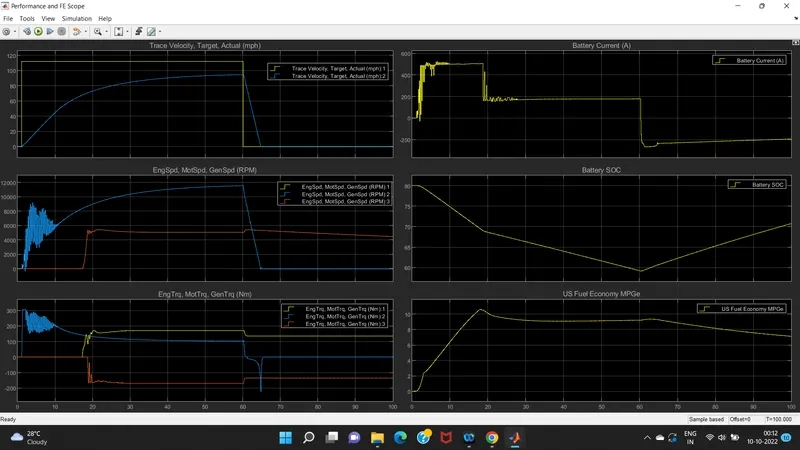
the following graphs are obtained for WOT analysis.
from the above graphs we can see that,
trace velocity target and actual graph:the yellow line indicates the desired path and blue line is the actual path.so it can be seen that battery power is not enough to meet the requirement of the grade and wind velocity.
battery current graph:when the vehicle is accelerating ,the battery current is also increasing.when the velocity is constant ,the current requirement also becomes constant.when the deceleration starts ,the battery current becomes negative indicating regenerative braking.
battery SOC:the battery SOC keeps on depleting untill regenerative braking starts.this increases the SOC.
engine ,motor and generator speed : Initially only motor is used to start the vehicle as motor has high initial torque.later generator (red graph) kicks in charging the battery. when SOC drops below 70% .engine graph cant be seen as it may have overlapped with generator.
engine,motor and generator torque:motor torque is high initially (blue line) and then engine kicks in at a later stage(yellow line).generator torque (red line) is negative as its charging the battery.
4 ) Keeping all other parameters same,compare the simulated results of hybrid and pure electric powertrains.
EV reference application
the electric vehicle(EV) reference application represents a fully electric vehicle model with a motor,generator ,battery,direct drive transmission and associated power train control algorithms.the EV is configured with a mapped motor and battery.this diagram shows the power train configuration.
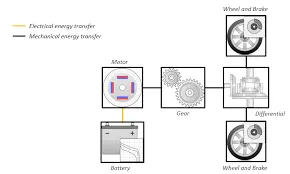
EV reference application with WOT drive cycle.
use the command 'autoblkEvstart' in the command window to open the EV reference application.
we can load the model from the matlab documentation and the model is represented below.
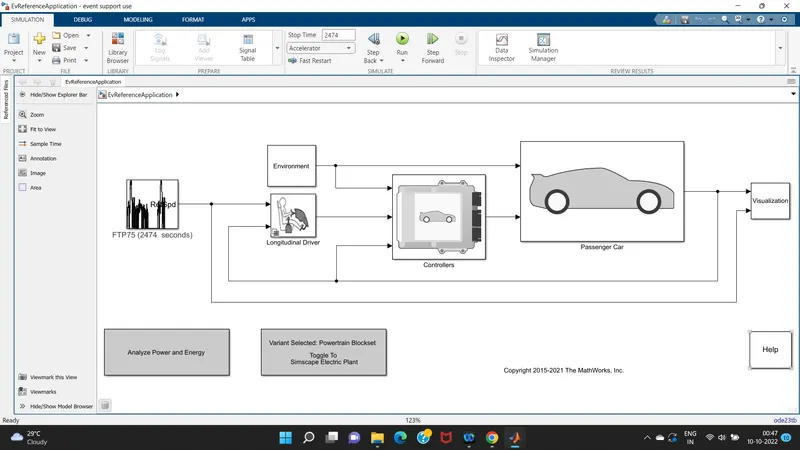
now simulating the EV with WOT drivecycle .wind velocity as 5 m/s.grade as 5 degree and keeeping the rest of the parameters same as above HEV case.
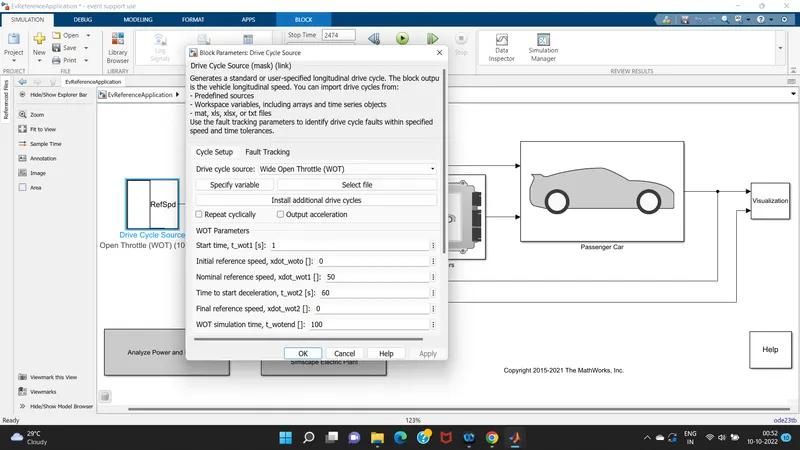
then double click drive cycle source block and then change the drive cycle to 'WOT' as shown in the below image.
also configure the parameters like time duration ,WOT start time,initial speed ,final speed ,max speed and time to start deceleration.
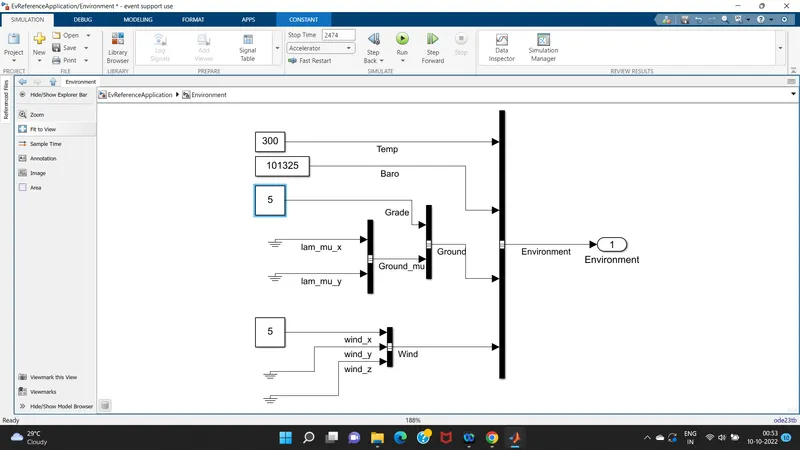
the scope is displayed on visualization in that 'performance and FE scope'.
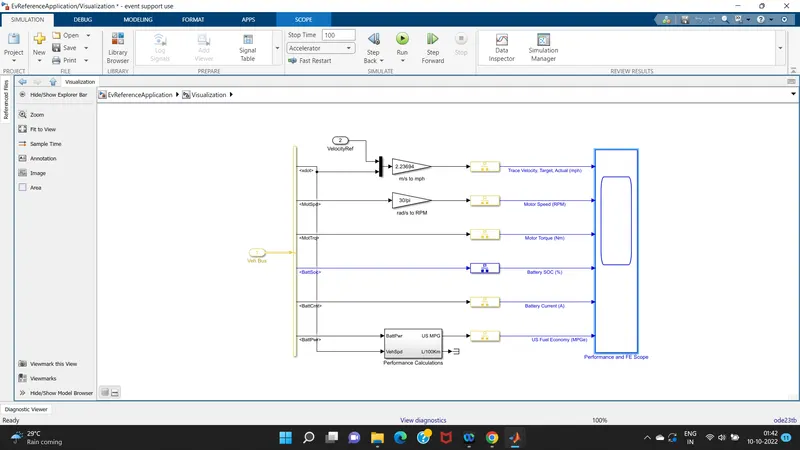
we get the following performance graphs:
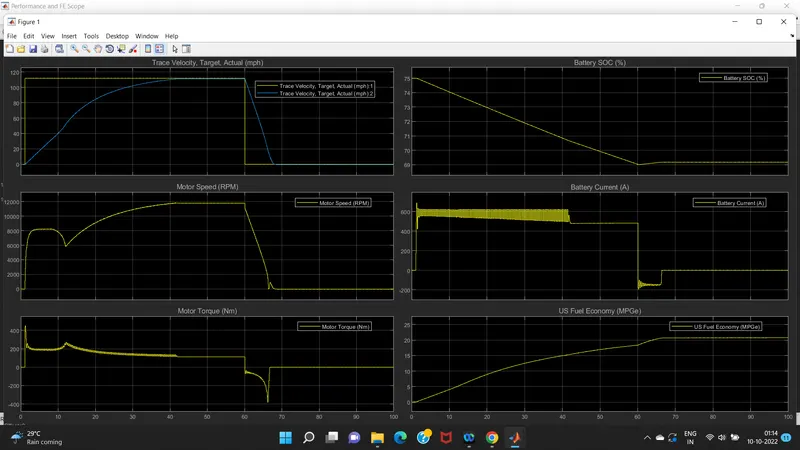
after comparing the graphs of both EV and HEV following conclusions can be drawn:
1. the first graph (target and actual velicity graph )performance is improved in EV that is actual path and desired path both matches .so it can be seen that battery power is enough to meet the requirement of the grade and wind velocity.
2. the battery current drawn HEV is up to 500 A and later decreases to 200 A .this can be attributed to the fact that initially only motor takes all the load and later engine kicks in so motor load drops thus current drawn by motor reduces and during the deceleration it is seen that negative current (regenerative breaking) flows for a longer time in HEV as compared to EV.So we can say that ,regerative braking is more aggressive in HEV.
3.SOC improvement of almost 20% is seen in HEV during deceleration and only 5 % improvement can be sen in EV during deceleration .
4. motor torque and motor speed are stable in EV and they keep fluctuating a lot in HEV during the starting .also the peak RPM of the motor in EV is less than HEV.these differences can attributed to the fact that battery power of EV is more than HEV.
5.Fuel economy of EV is significantly greater than HEV .this is beacause electric motor is more efficient than engine.
|
ELECTRIC VEHICLE (EV) |
HYBRID (HV) VEHICLE |
|
|
energy source |
electric only |
Main: gasoline Sub: electric |
|
Propulsion mechanism |
Motors |
Combination of motor+engine |
|
CO2 emissions |
None |
Yes |
|
Fuel facility locations |
Charging stations |
Gas stations |
|
Tax liability |
low |
Low |
|
Cruising distance |
short |
Long |
|
Efficiency |
Converts 75 % of the chemical energy from the batteries stored in gasoline to power the vehicle. |
Converts 40 % of the energy stored in gasoline to power the vehicle. |
conclusion=
1) the mapped model calculation is very fast compared to dynamic data and the change of system can be done through varient manager.
2)Thus we found how the model calculates the Miles per gallon and mentioning which factors are considered to model fuel flow
3) thus HEV reference application with WOT condition is executed with grade angle and wind velocity,also the results are observed.
4) the overall difference in both these simulators are vehicle operations where the EV is completely operated on the battery as the power source and on the other hand,the HEV has two power sources SI/CI engine and battery.the results obtained are varied and the parameters are also differentiated accordingly.