Final Project: Electric Rickshaw modelling
Title = Electric Rickshaw Modelling.
Aim: To design a model of an electric rickshaw by using MATLAB Simulink.
Summary
we can observe that. I am going to build a MATLAB model of an electric rickshaw (three wheel) passenger vehicle by driven using the PM brushed motor and assuming the efficiency points of motor controller and motor with a suitable LI-ion battery
Firstly, we are going to knew about Electric Rickshaw vehicle and how it works, benefits of EV rickshaw. After that we are going to build the EV rickshaw model by using Simulink with suitable blocks from the powertrain block set.
My Aim is to check how my rickshaw works for any three standard driving cycles showing their energy consumption, temperature rise of motor and controller for 100km constant speed driving at 45kmph.
Given=
Create a detailed MATLAB model of an electric rickshaw (three-wheel passenger vehicle) as per details below:
Rear wheels driven by PM brushed type motor
Assume efficiency points of motor controller and motor
Make an excel sheet of all input and assumed data
Results: For any three standard driving cycles show energy consumption, temperature rise of motor and controller for 100 km constant speed driving at 45 kmph.
Introduction about Electric rickshaw.
E-rickshaws are small vehicles, with three wheels and use electric power from batteries to run. They use an electric motor as engine which draws electric power from the rechargeable batteries installed in the rickshaw body.
The battery-operated vehicles are perfect for small distant transport, both cargo and people; they are perfect for running on narrow streets because of their small size. But the biggest reason for their popularity is low operating cost and zero air pollution.in a nutshell you can say they are bigger version of rickshaws powered by electricity.
They are like normal rickshaws but powered by electric motor instead of petrol or diesel motor. They are perfect for a pollution free, environment friendly transport system in short distances. Actually, they are not capable of running long distance.
E -rickshaws are now one of the preferred modes of transport in streets because of its low maintenance cost, low fuel cost, eco-friendly, no noise pollution, easy to drive and last but not the least livelihood, e-rickshaw is a boon to the common man. without putting in much physical efforts and without investing much amount of money, the earning is quite good for an e-rickshaw driver and hence it is an important means of livelihood for many.
These e-rickshaws consists of 3 wheels with a differential mechanism at rear wheels. Basically, these vehicles have a mild steel tubular chassis. The motor is brushless dc motor manufactured mostly in India and China. The electrical system used in Indian version is 48 VDC can run 90-100 km/full charge, top speed 25 km/hour and this electric motor power ranging from 650-1400 watts, the battery takes 8-10 hrs too become fully charged. Basic seating capacity is driver plus 4 passenger total 5 persons.
The body design from the most popular Chinese version is of very thin iron or aluminium sheets. Bodies made of fiberglass are also popular because of their strength and durability, resulting in low maintenance. Body design is varied from load carriers, passenger vehicles with no roof, to full body with windshields for drivers' comfort.
It consists of a controller unit. They are sold on the basis of voltage supplied and current output, also the number of mosfet (metal oxide field effect transistors) used. The vehicle's batteries are typically lead acid with a lifespan of 6–12 months. deep cycles batteries designed for electric vehicles are rarely used. Weight of the electric car has also been a recurring design difficulty in them.
These vehicles are now started using in transporting light weight goods as e-loader. Hence there are lots of opportunities of income.
Below are some of the main reasons why this e-rickshaw is going to get more support from people and from government in future.
Eco-friendly = since this vehicle runs on electricity, it can never emit smoke. This way one travel across the city without polluting the air. Batteries used in these vehicles can be recycled and can be disposed of without any problem.
Less expensive= this e-rickshaw can be easily afforded by a middle-class person who cannot shell out much money.no doubt, these vehicles are very economical for both passengers and drivers.
No sound pollution= this e-rickshaw produce less noise compared to vehicles which run on petrol and diesel. Since entire engine of this e-rickshaw runs with the electricity of the battery attached to the vehicles which results in less noise.
Maintenance = since this vehicle has no engine and gearbox maintenance of this vehicles comes very cheap. it’s very easy to charge the battery. all you need to do is, pay money for charging the battery.
Safety = e-rickshaw involves less risk compared to auto rickshaw which runs on fuel. They cause fewer accidents.
Fare and cost of vehicle= this e-rickshaw are affordable to buy, one can buy this vehicle at the price of a bike in India.one can buy this e-rickshaw at a price of 95000 Rs. When it comes to motor rickshaw you need to spend 2 lakhs of rupees, which is too expensive.
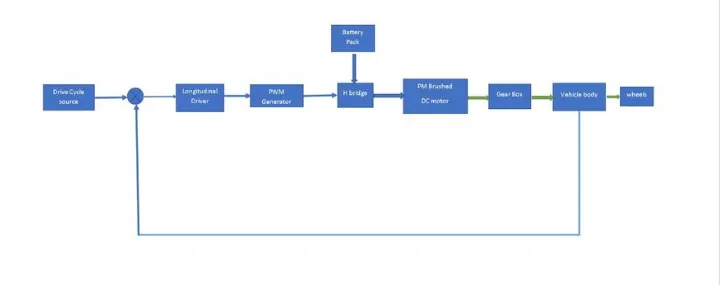
The block diagram Electric rickshaw.
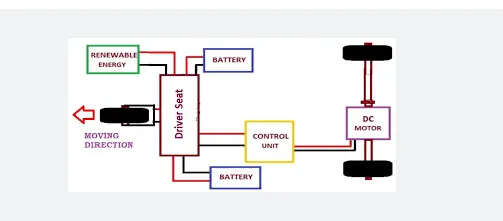
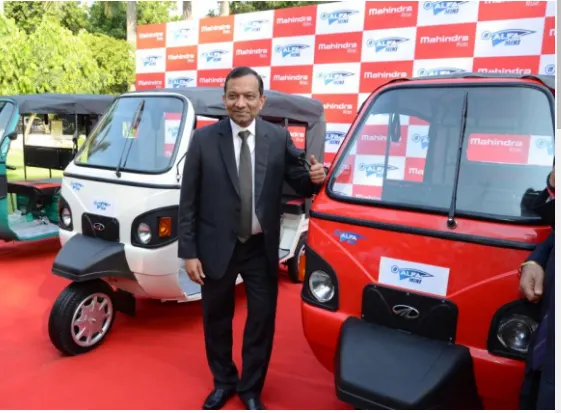
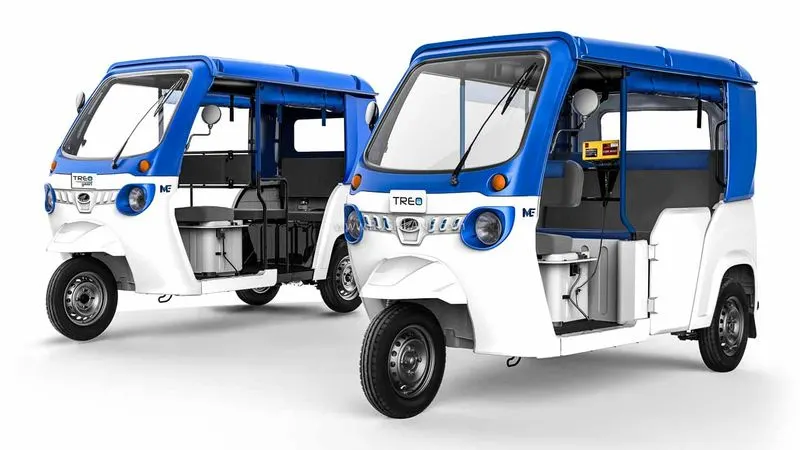
Electric Auto Rickshaw (Mahindra named treo)
Drive train (Electric Rickshaw)
objectives-
- electric vehicle with fever components.
- to make a most simple and low run time vehicle model using individual component models.
- to checkout performance parameters speed, SOC, current etc with various drive cycles.
- to play with motor power, vehicle body (rolling resistance, air drag, weight) inputs.
- to know MATLAB models and their configuration to match with actual vehicle.
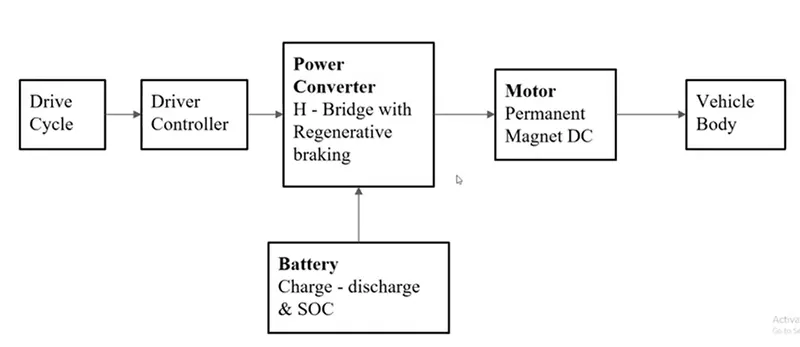
-this block diagram is a schematic general arrangement of the principal parts of an electric rickshaw and it is reference to our MATLAB model of an electric rickshaw.
-In this shows there are 6 main parts of this arrangement. the electric vehicle has vehicle body, DC motor, power converter, driver controller, drive cycle and battery.
-in this, the drive cycle is used to input the data into the driver controller. The driver controller controls the acceleration and deceleration of the vehicle.
-Power converter which is a H-bridge with regenerative braking, here we use H-bridge to drive the DC motor.
-as per our model we are using a battery and dc motor. battery cannot be directly connected to motor because if we connect then rated voltage is given to motor and motor speed is also rated, so we cannot increase or decrease motor speed variation as per our requirement of vehicle.
-the motor block and battery block are connected to the power converter block so power converter plays a vital role in the controlling and converting the electrical energy.
-the battery block indicates the charge and discharging condition and % SOC (state of charge) variations with respect to the drive cycle.
-motor blocks indicate we are using which type of motor and its positioning, here we are using the permanent magnet DC motor.
-finally, the vehicle body block indicates the mechanical structure of an electric rickshaw like wheels and their connections. Then the motor rotational energy rotates the wheel through transmission gear system.
Sample calcualtion=
| CALCULATION OF VEHICLE PROPULSION POWER | ||
| SPECIFICATION | PARAMETER | UNITS |
| Rolling Resistance | FIRST CONDITION | |
| Kerb Weight | 300 | Kg |
| Payload | 200 | Kg |
| Coefficient of rolling resistance | 0.015 | |
| Rolling Resistance Force | 73.575 | N |
| Aerodynamic Drag | ||
| Air Density | 1.25 | kg/m3 |
| Drag Coefficient | 0.5 | |
| Speed | 37.5 | m/s |
| Frontal Area | 2 | m^2 |
| Aerodynamic Drag Force | 878.90625 | N |
| Total power at given speed (Kw) air drag+ rolling resistance | 35.71804688 | kw |
| hill climbing calculation | ||
| angle in radian | 0.0174533 | radian |
| speed during hill climbing (kmph) | 50 | kmph |
| speed during hill climbing(mps) | 13.88888889 | mps |
| hill climbing force(N) | 85.60409026 | N |
| Hill climbing power | 3.210153385 | kw |
| Total power for roling resistance+aerodynamic drag+hill climbing | 38.92820026 | Kw |
| Acceleration calculation | ||
| top speed | 135 | kmph |
| top velocity | 37.5 | mps |
| acceleration time | 12 | s |
| acceleration | 3.125 | m/s^2 |
| Acceleration force | 1562.5 | N |
| Acceleration power | 58.59375 | kw |
| total power required by the vehicle to overcome the forces acting on a vehicle (Pte) | ||
| 97.52195026 | kw | |
Simulink model of Electric Rickshaw
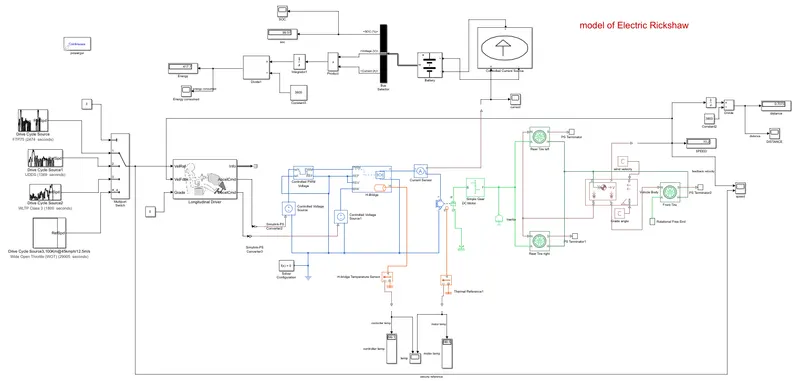
now we will discuss each block used in this Simulink model-
1)Drive Control
In order to control the vehicle, we need another system that decides how the vehicle will operate. This means that data needs to be input in to this model as commands for how we desire the vehicle to operate. In addition, we need blocks that control how the vehicle will operate as a response to its instantaneous state. This system is explained below drive cycle source-
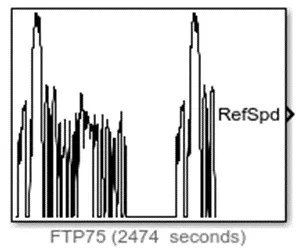
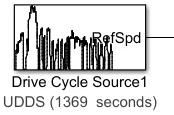
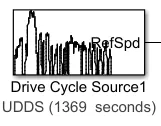
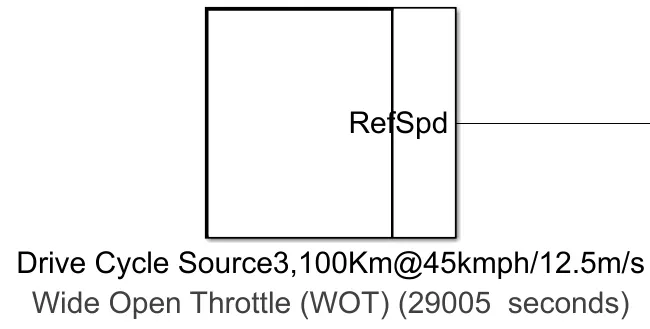
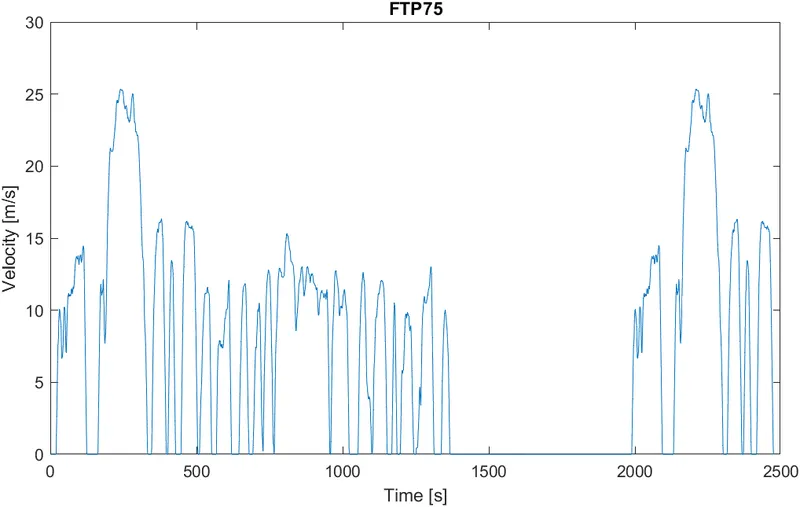
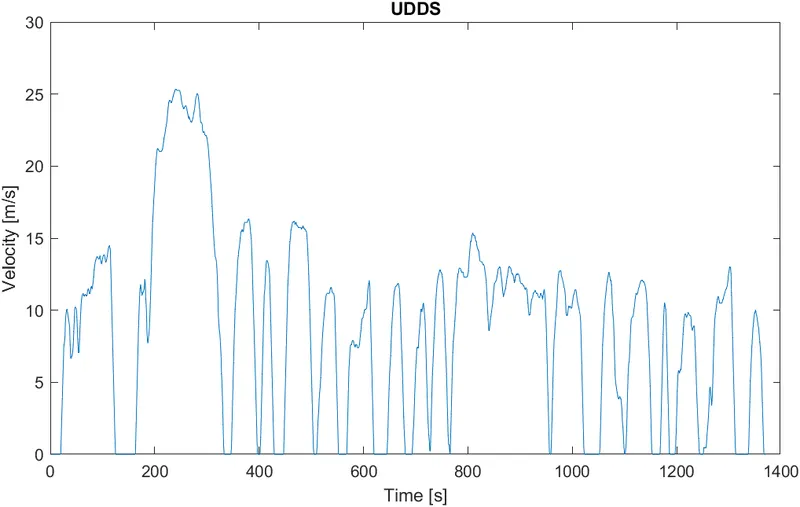
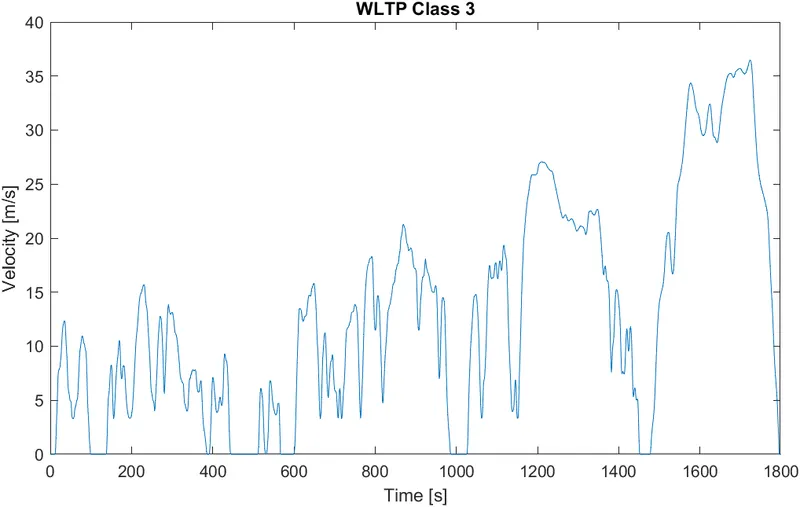
A drive cycle is a data set that contains velocity and time data for the purpose of modelling the motion of a vehicle. The drive cycle will be a plot of the velocity against the time and it is made to resemble typical driving conditions that a consumer may experience themselves in. For instance, they can model highway driving situations, driving in urban areas or driving with full power etc. Drive cycles are used by automotive companies for various testing procedures such as mileage, pollution tests, and acceleration and top speed tests. There are various different drive cycles that are industry standard e.g., Urban Dynamometer Driving Schedule (UDDS), FTP 75.
In my EV model, a drive cycle is used as the reference velocity data for the longitudinal driver block to send acceleration or deceleration commands according to the drive cycle. There are 3 ways of implementing a drive cycle. One method is to create or own drive cycle with a spreadsheet of velocity data in one column and time data in another column. Another method is to use a signal builder block and create signals that represent the velocities at which the vehicle should travel and the durations for which those velocities are to be maintained. The last method is to use the industry standard drive cycles which are in - built in to the SIMULINK library.
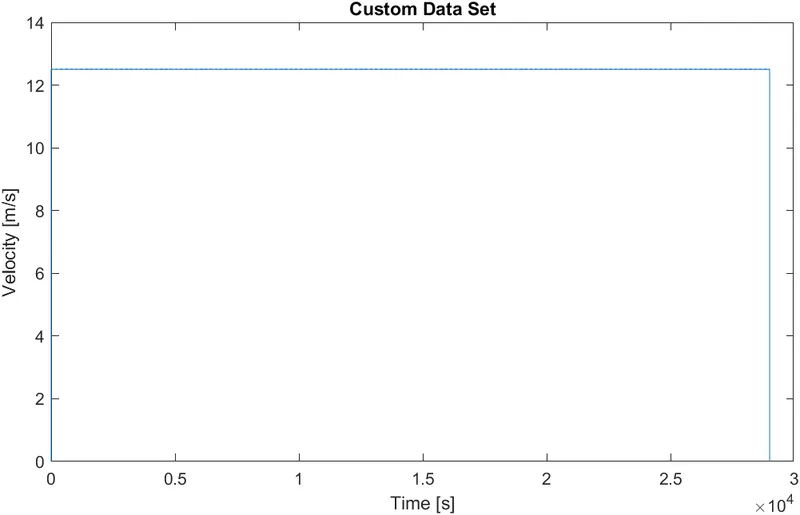
-this block helps in inputting the drive cycle data, whether it is built in or custom made by the user. here we used
1) FTP75 drive cycle. the test duration would be 2474 seconds.
2) UDDS drive cycle. the test duration would be 1369 seconds.
3) WLTP drive cycle. the test duration would be 1800 seconds.
4) Wide open throttle drive cycle. the test duration would be 28828 seconds.
2) Multiport switch=
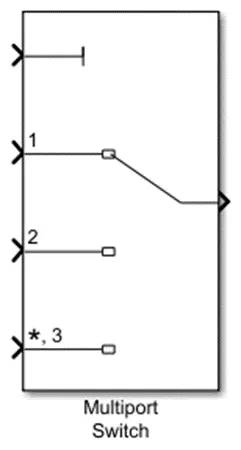
this block determines the which inputs to the block passes to the output and this is depending on the value of first input.
the first input is the control input and others are data inputs. The value of the control input determines which data input passes to the output.
3) Longitudinal driver-
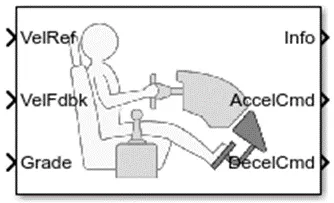
the longitudinal driver block implements a longitudinal speed-tracking controller.
based on reference and feedback velocities, this block generates normalized acceleration and braking commands that can vary from 0 through 1.
we can use the block to model the dynamic response of a driver or to generate the commands necessary to track a longitudinal drive cycle.
velocity reference - drive cycle.
velocity feedback- connected to vehicle body speed calculation and it acts as a close loop feedback to meet the desire speed as per reference input.
grade -which is constant zero assumed info terminal -not connected.
acceleration command- this terminal connected to PWM source through which it is connected to controlled PWM voltage to vary the duty cycle according to drivers input
deceleration command- it is connected to braking of H-bridge to maintain the speed according to the drive cycle and decelerate the vehicle.
the block parameters are as shown below-
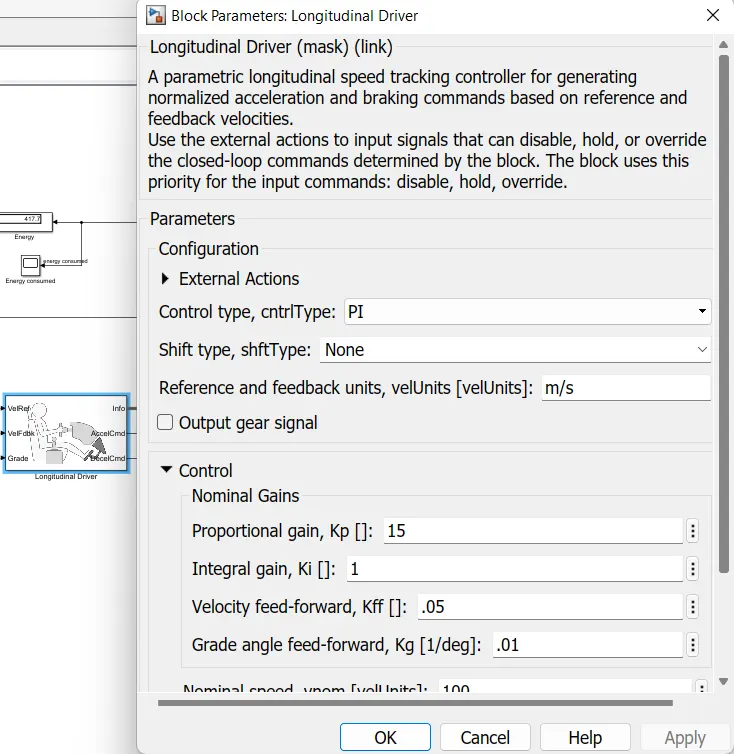
PI control is selected for this block, this is nothing but throttle pedal of the driver which will try to match with the input drive cycle given and according to it PI controller will try to match whether acceleration or deceleration as per input given.
4) controlled PWM voltage block -
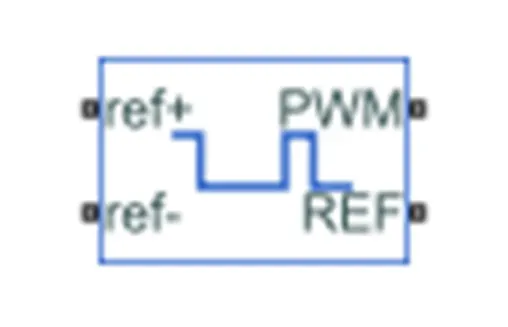
- this block is used to create the pulse width modulated (PWM) voltage.
- Electrical input ports- this block calculates the duty cycle which is based on the reference voltage across its ref+ and ref- ports. This modelling variant is the default.
-the value of the output voltage amplitude parameter determines amplitude of the output voltage.
ref + = reference positive connected with the acceleration commands from the driver model
ref- = reference negative connection grounded.
PWM = PWM connected directly to the H-block.
REF = REF connected directly to the H-block
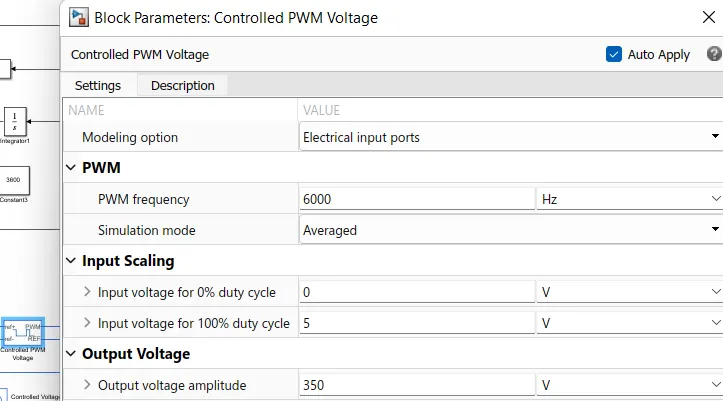
- the parameters of this block are as
5) controlled voltage source
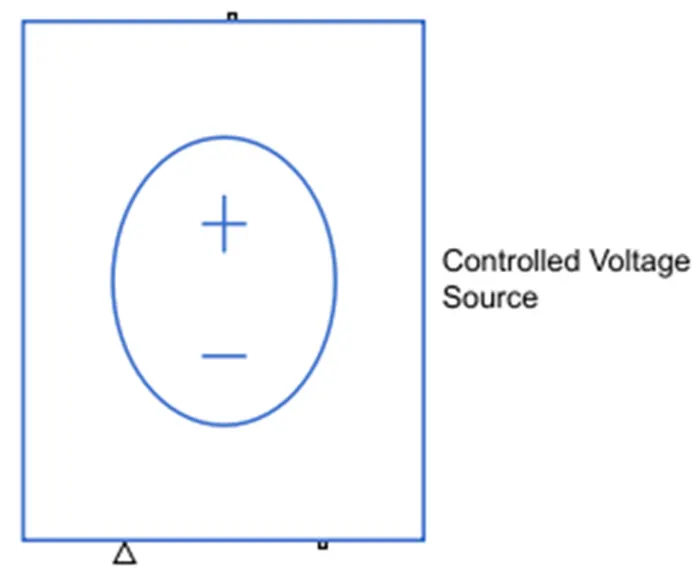
it is located in the Simulink library at electrical sources.
it is used to control the voltage which is connected to the positive reference of the controlled PWM voltage in the form of a signal by the longitudinal driver controller model acceleration command and another controlled voltage source 2 is used to connect to the H-bridge BRK terminal. the negative sides of both the sources are connected to the electrical reference as shown above.
6) H- bridge =
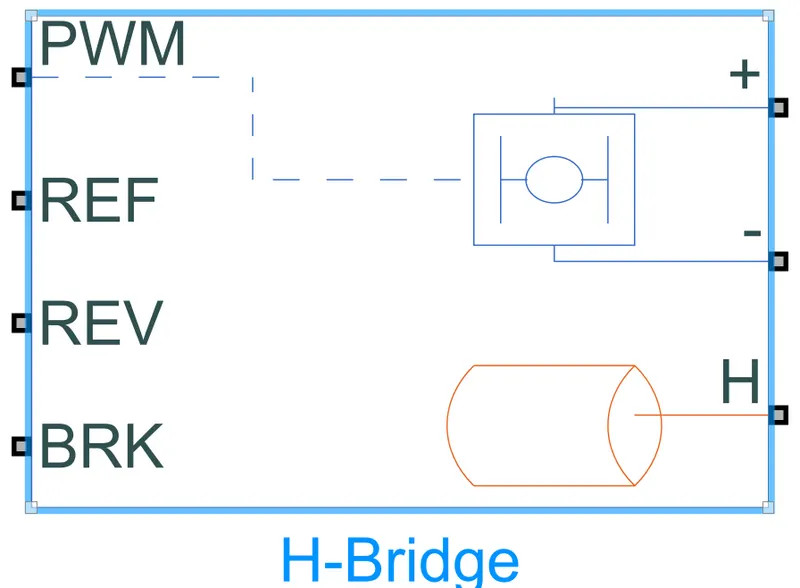
-this block is used to change the polarity of the voltage applied across the DC motor so as to run the motor in forward and reverse direction as per the input command.
-this block is driven by controlled PWM voltage block in PWM or averaged mode.
- in PWM mode, the motor is powered if the PWM port voltage is above the enable threshold voltage, in averaged mode, the PWM port voltage divided by the PWM signal amplitude parameters defines the ratio of the on-time to PWM period.
- using the ratio assumptions about the load, the block applies an average voltage to the load that achieves the correct average load current.
- the simulation mode parameter must be same for the controlled PWM voltage and H-bridge blocks.
-REF- controlling with reference
-REV -controlling with reverse
-BRK- controlling the brake and regenerative action
+ =controlled output to the positive terminal of the motor
- = controlled output to the negative terminal of the motor
-the block parameters of H-bridge are as
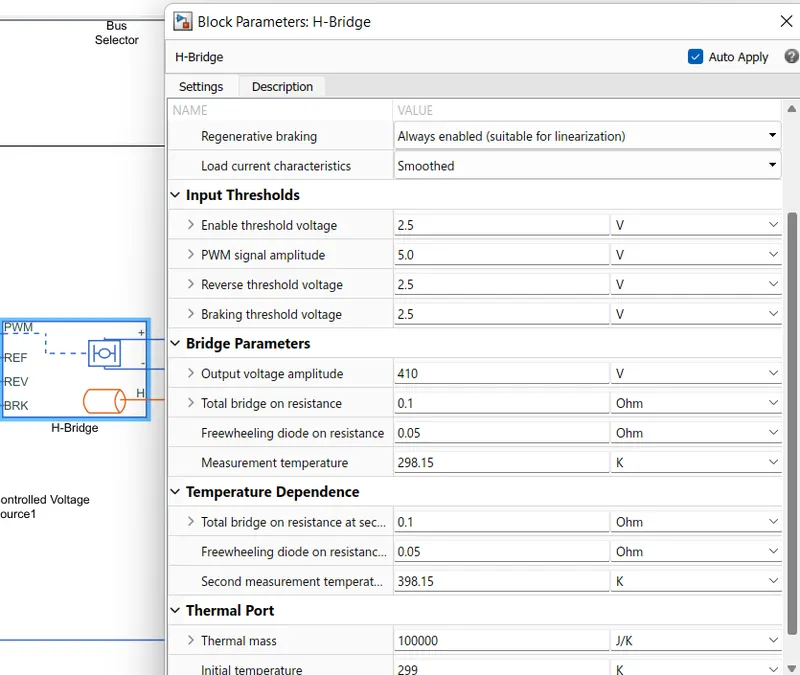
- we have selected the internal type power supply and enabled the regenerative braking for flow power back to battery while braking and deceleration to make EV efficient.
7) solver configuration
- it is placed in the power control unit for the mathematical values in the model solver settings at the simulation time.
8) Electrical reference
-it is located in the Simulink library at electrical elements.
-it is used to connect all the terminal of the negative signals and the reference values as the ground.
9) Current Sensor-
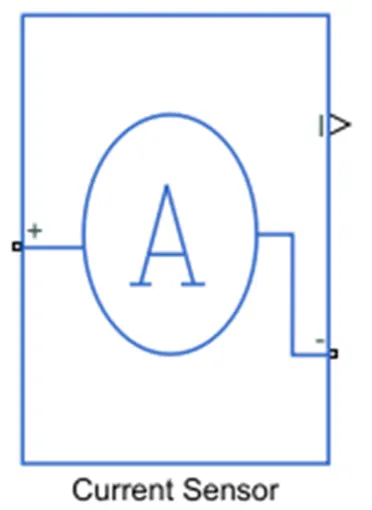
-it is located in the Simulink library at electrical sensors.
-this is used to measure the current flowing through the H-bridge. The positive and negative terminals of the current sensor are connected to the DC motor and H-bridge block respectively and the signal is connected to the controlled current source in the battery as a physical input signal from the H-bridge circuit.
10) DC motor(with thermal port)
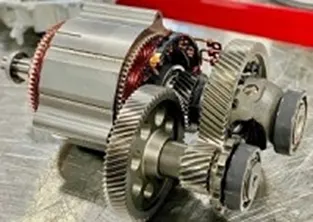
-The controller provides electrical power from the traction battery; the electric traction motors turn the transmission and then moves the wheels.
- In some hybrid electric cars, we can use a type of generator -motor that performs both the operation like propulsion and regeneration.
-In general, the type of electric motor used is the BLDC (brushless DC) motor.
- for this we use permanent magnet dc motor.
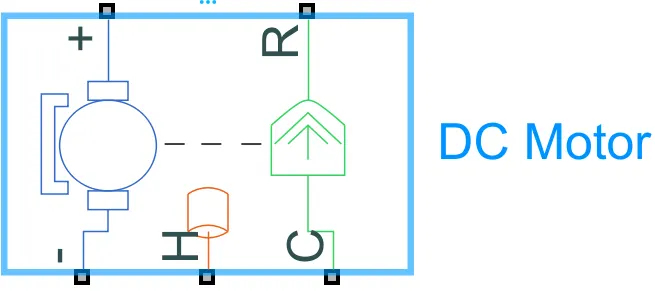
- For the EV model, the DC motor block is selected because DC motors are easy to model and have very few parameters to run for a particular application.
-The left side of the motor represents the electrical part of the motor, whereas the right side represents the mechanical part.
- using the power from the battery pack this motor drives the vehicle wheels.
- some vehicles use the motor generators to perform both the drive and regeneration functions.
-this is the DC motor (Brushed type) terminals are connected as -
+ = electrical signal to the motor positive terminals
- = electrical signal to the motor negative terminals
C = connected to casing of the motor connected with the mechanical rotational reference block.
R = rotor shaft of dc motor is connected to simple gear, which vary torque and speed.
- the parameters of dc motor are
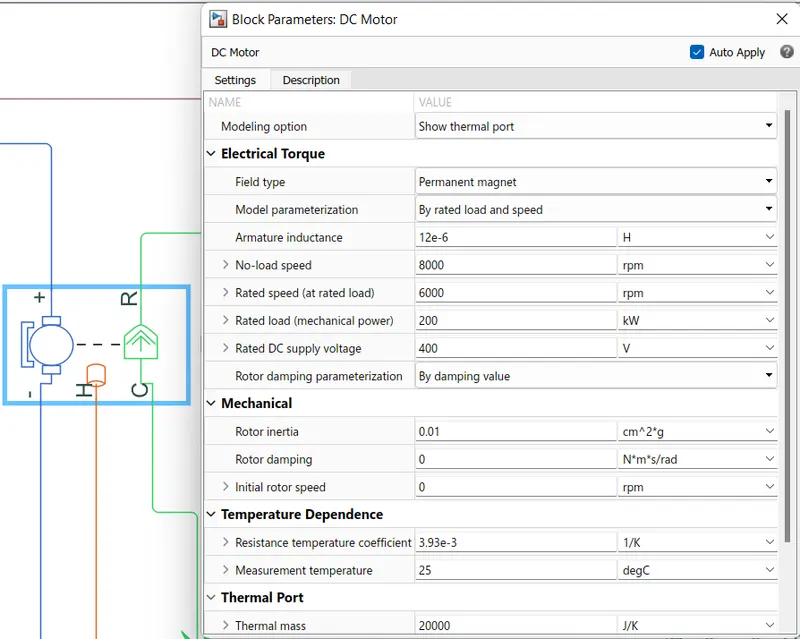
11) Temperature Sensor:
Temperature Sensor is used to measure the temperature of H-Bridge and Motor.
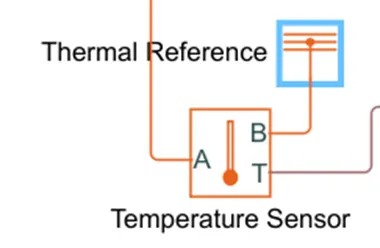
This block measures temperature in a thermal network. There is no heat flow through the sensor. The physical signal port T reports the temperature difference across the sensor. The measurement is positive when the temperature at port A is greater than the temperature at port B.
Connections A and B are thermal conserving ports that connect to the two points where temperature is being monitored. Port T is a physical signal port that outputs the temperature differential value.
The block positive direction is from port A to port B. The measured temperature is determined as T = TA – TB.
12) THERMAL REFERANCE
This block represents a thermal reference point, a point with an absolute zero temperature with respect to all the temperatures in the system are determined.
13) Simple Gear=
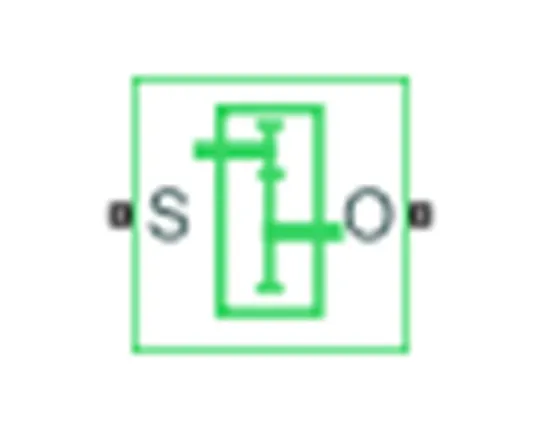
-A gearbox is a mechanical device that is used to increase the output torque or change the speed (RPM) of the motor. The motor shaft is connected to one end of the gearbox and through the internal configuration of the gears of the gearbox, it provides an output torque and a specific speed determined by the gear ratio.
-The most basic definition of a gearbox is that it is a mechanical unit or component consisting of a gear train or set of gears embedded in a housing. In fact, the name itself defines it as a box containing gears. In the most basic sense, a gearbox works like a gear system. Change torque and speed between a drive, such as a motor, and a load.
-Gears in gearboxes can be one of several types, from bevel and helical gears to worm gears and planetary gears. The gear is mounted on a shaft supported by roller bearings and rotates around it. A gearbox is a mechanical method of transferring energy from one device to another, which is used to increase torque while decreasing speed.
-Gearboxes are used in many applications, including machine tools, industrial equipment, conveyor belts, and almost any power transmission application with rotary motion that requires a change in torque and speed.
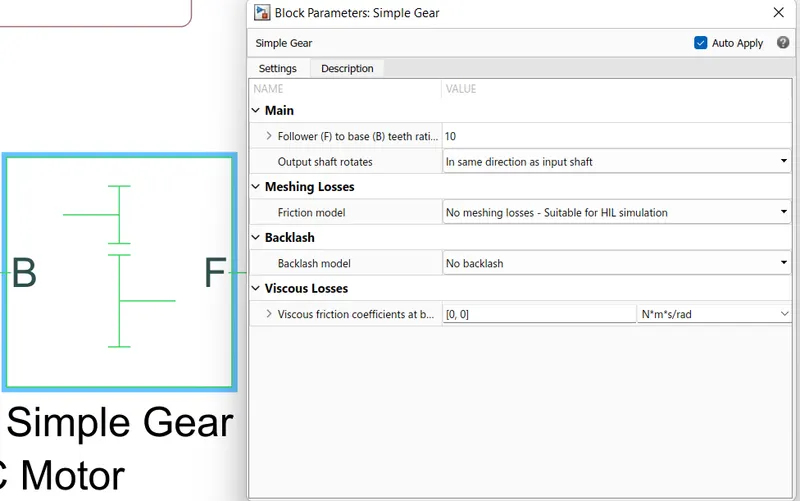
- the gear box block represents an ideal, nonplanetary, fixed gear ratio gear box.
- the gear ratio is determined as the ratio of the input shaft angular velocity to that of the output shaft.
- the parameters of gear box block as-
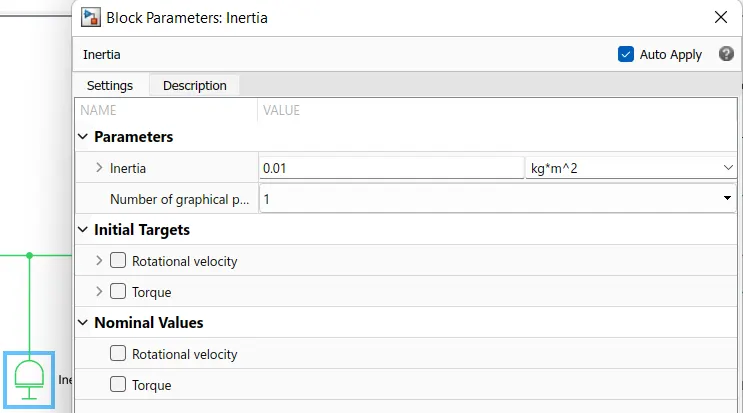
14) Inertia=
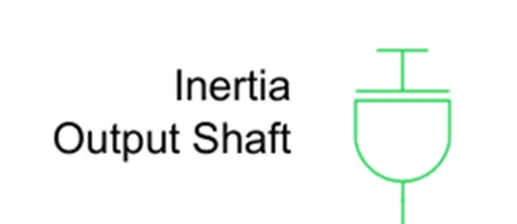
it is used to represent the ideal mechanical rotational inertia which is the reference port to give the positive inertia torque with the terminal used to connect to the reference one.
15) Tire/Wheels=
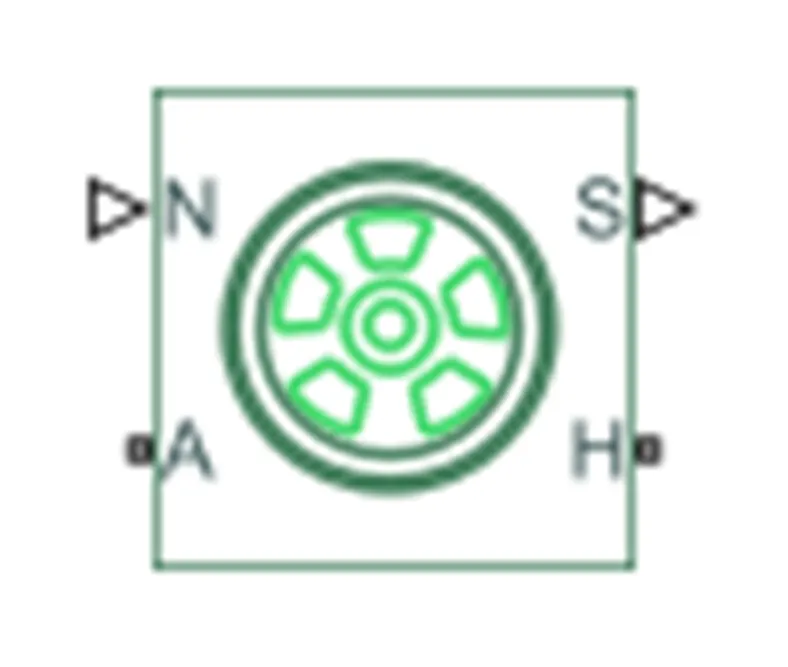
- this block represents the longitudinal behaviour of a highway tire characterized by the tire magic formula.
- connection A is the mechanical rotational conserving port for the wheel axle.
- connection H is the mechanical translational conserving port for the wheel hub through which the thrust developed by the tire is applied to the vehicle.
- connection N is the physical signal input port that applies the normal force acting on the tire.
- connection S is a physical signal output port that reports the tire slip.
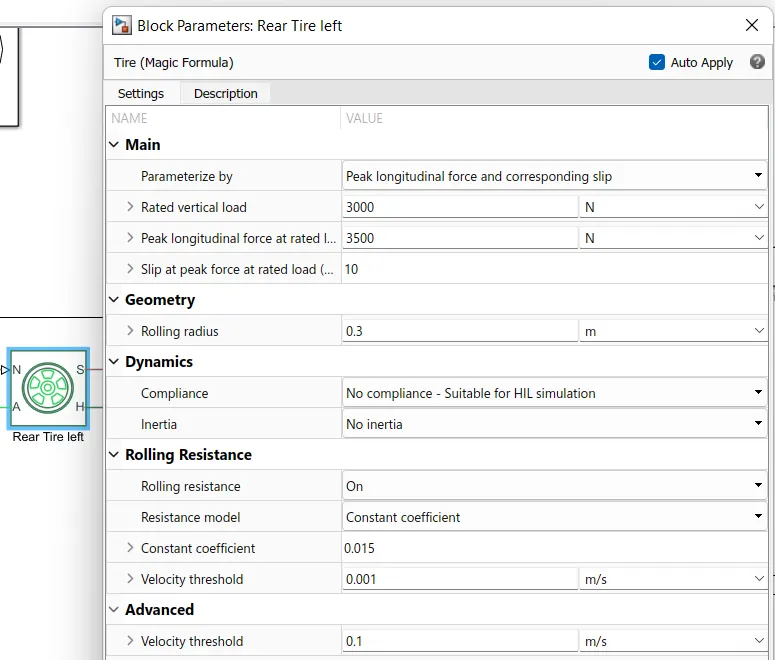
-In these 3 tires used ,2 for rear axles and 1 for front axles.
- the parameters for tire block are
16) Vehicle body-
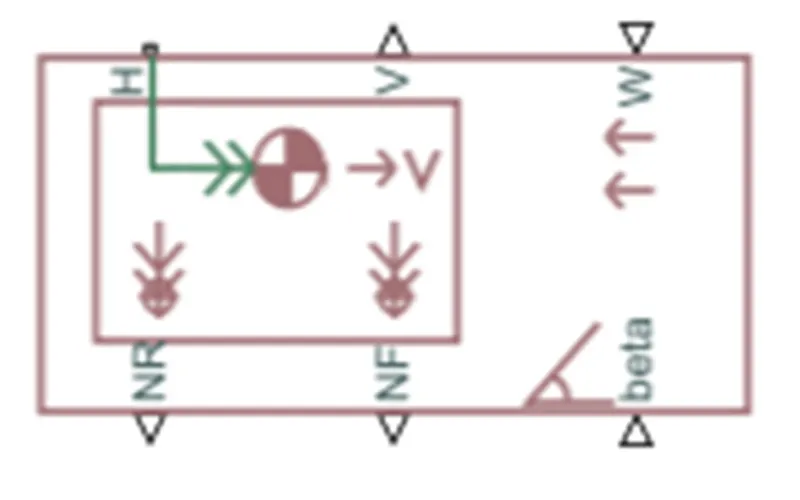
- the vehicle body block represents a two-axle vehicle body in longitudinal motion.
- the vehicle has the same or different number of wheels on each axle. For example, two wheels on the rear axle and one wheel on the front axle. Each vehicle wheels are of same size and structure.
-this block accounts for body mass, aerodynamic drag, road incline and weight distribution between axles due to acceleration and road profile.
- optionally include pitch and suspension dynamics, the vehicle does not move vertically relative to the ground.
-this block has an option to include an externally defined mass and an externally defined inertia.
-the mass, inertia and centre of gravity of the vehicle body can vary over the course of simulation in response to system changes.
- angle terminal (beta)= the angle is the slope in the road condition at which the vehicle is running.
- wind= it is specified as per the condition where the vehicle has to be driven.
- Velocity = the speed of the EV rickshaw.
- H = It is a conserving port associated with the horizontal motion of the vehicle body. tire traction motion is connected to this port.
- NF= the front wheel connection
- NR= the rear wheel connection.
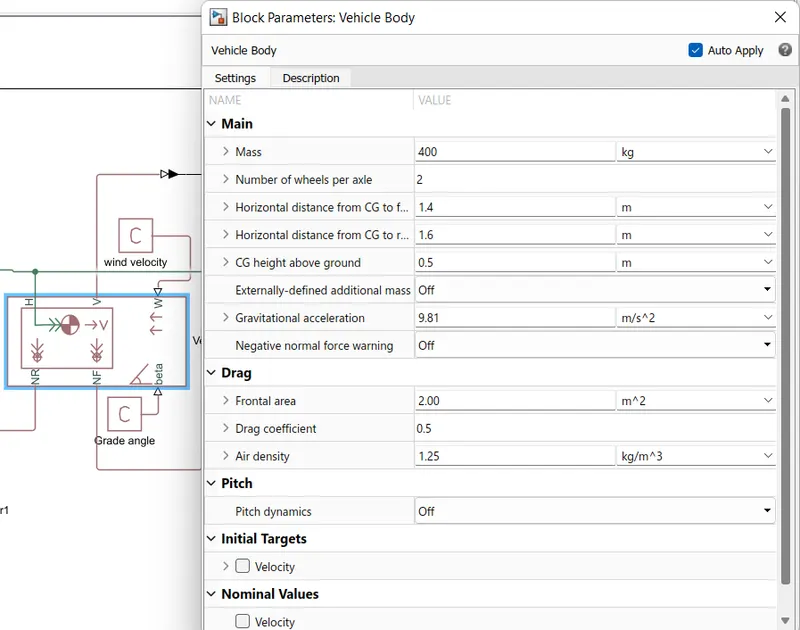
-the parameters of vehicle body block are
17) PS constant=
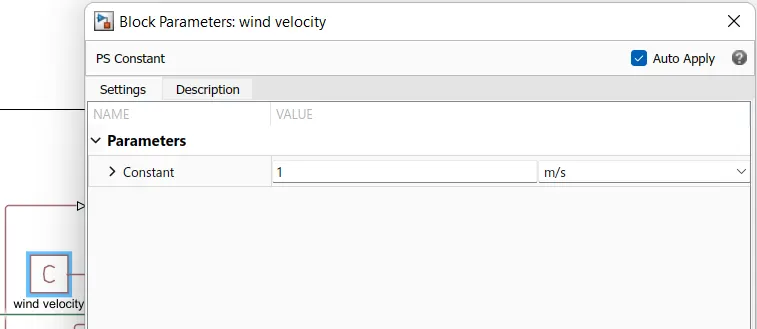
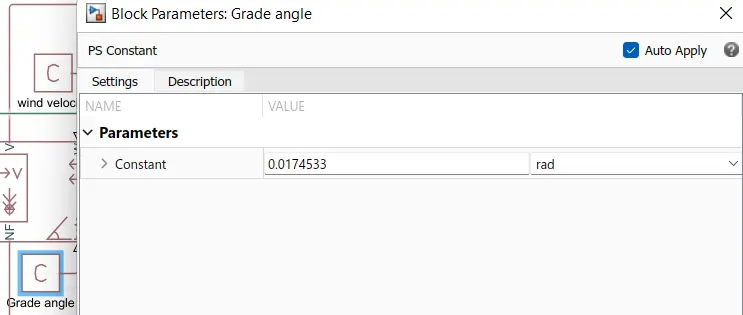
- this block generates a physical signal of a constant value.it has only one output port which is a physical signal.
- we specified the value and unit of the signal as the constant parameter.in our model we are using 2 PS constant blocks which are connected across the W and beta ports of the vehicle.
18) ROTATIONAL FREE END
This block represents a mechanical rotational port that rotates freely without torque.
19) display=
-it is located in the library Simulink at Simulink / sinks.
-it is used to display the value that connected to this block in the form of physical form.
20) Scope=
it is also located at different places as,
Simulink/commonly used blocks
Simulink/ sinks
HDL coder / commonly used blocks
HDL coder / sink
it is used to display the signals generated during simulation.
21) Simulink to PS converter=
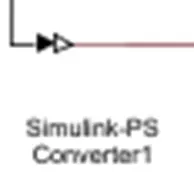
- It converts the Simulink input signal to a physical signal
22) PS-Simulink converter:
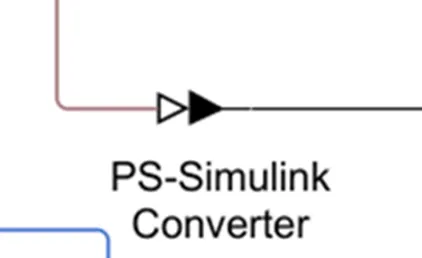
- it is located in the Simulink library at utilities.
- it is used to connect the line from physical signal to Simulink which act as a converter.
23) Controlled current source=
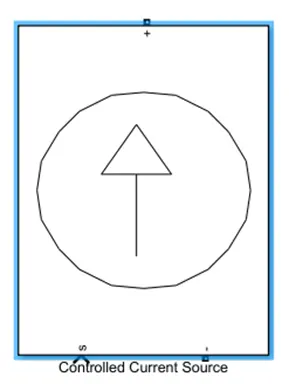
- it is located in Simulink library at simscape /electrical /specialized power systems / fundamental blocks / electrical sources.
- this block converts the Simulink input signal into an equivalent current source. The generated current is driven by the input signal of the block which is shown as symbol of 's’. the arrow in block shows positive current direction. This current source may be used for the both AC and DC current controls. Without giving any signal or values to the control as input it will not work. Here the controlled current source +Ve and -ve terminals are connected to the battery +ve and -ve terminals respectively as shown in model. The input signal 's' is connected to the power control unit current sensor signal I which is the physical signal.
24) battery model=
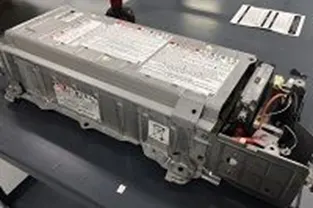
-the main function of the battery in the electric vehicle is to store electrical energy in the form of direct-current electricity (DC).
-the controller sends a signal to the battery, then the battery will flow the DC electrical energy to the inverter to then be used to drive the motor.
- the type of battery used is a rechargeable battery and which is arranged in such a way that of traction battery pack.
- currently there are different types of electric car batteries used but the most widely used battery is lithium-ion batteries.
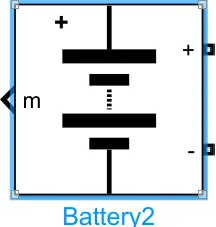
- the battery is connected as the source to the model so that the power could be generated and the same power is transmitted accordingly to all the operating sources and load demand of driver. The terminal connection is
+ = the positive terminal of the operating sources
- = the negative terminal of the operating sources
- the battery block implements a generic dynamic model that represents most popular types of rechargeable batteries like lithium-ion type battery.
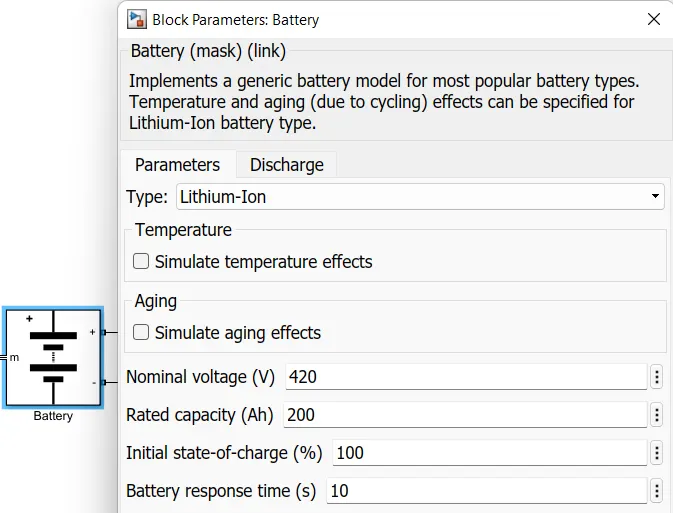
- the complete battery model is-
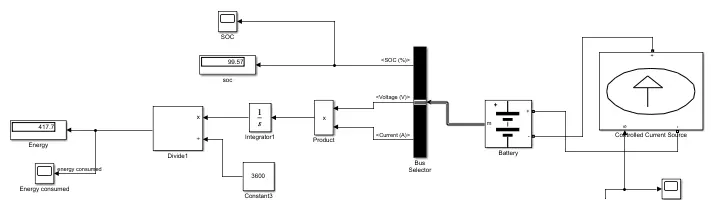
- In this ,we controlled current source is connected to +ve and - ve terminal of battery.
- from the m port of the battery block,we get SOC,ampere and voltage values.these values are extracted using bus selector .
-the ampere and voltage output is connected to a product block and multiplied to get the energy value in watts.this output is connected to a integrator block which will add those watts over the simulation time and gives us watt second value.this watts second value is converted to watt hour by dividing by 3600.so energy is displayed in display block and response shown in scope block.
- SOC from bus selector is directly displayed in display block and response shown in scope block.
25) Bus selector=
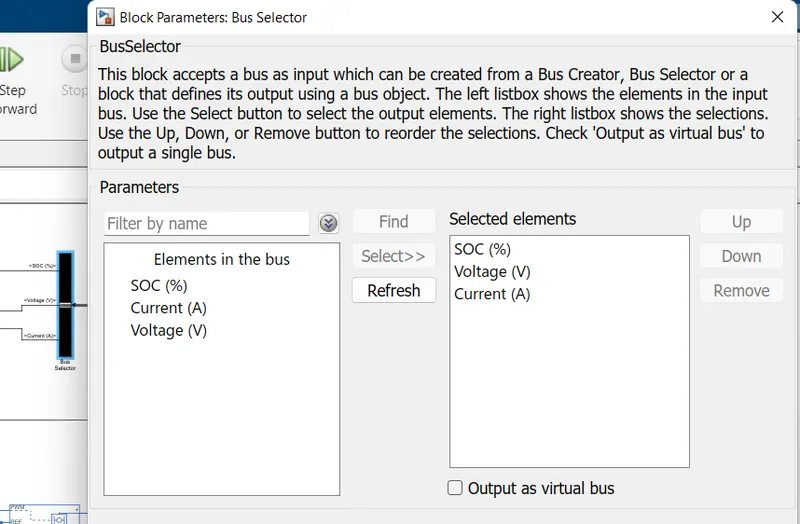
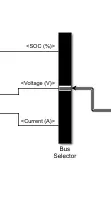
- The bus selector block outputs the elements you select from the input bus. The block can output the selected elements separately or in a new virtual bus. The Bus selector block does not support mixing massage and signal elements as outputs.
26) mechanical rotational reference
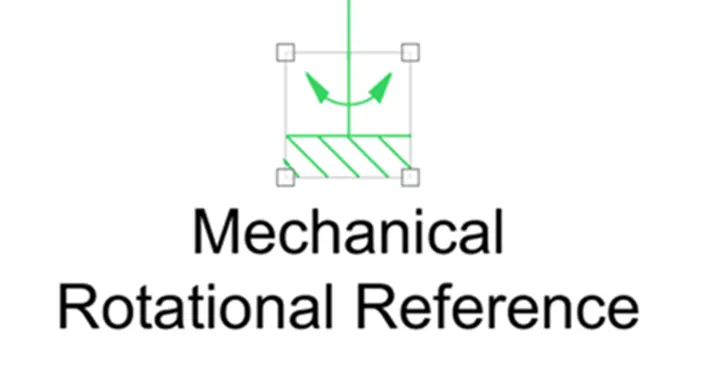
it is representing as a mechanical ground reference point that is as a frame part which is used to connect rotational parts to the ground.
27) Powergui
-it is present at simscape / electrical / specialized power systems / fundamental blocks.
-it is used with simulation of power systems and power electronics.
- it is used for the analysis and measurement of parameters like voltage, current, active power, reactive power.it gives the steady state values of the system.
excel sheet of all input and assumed data
| Block | parameter | changed value |
| Vehicle Body | Mass | 400Kg |
| Frontal area | 2.0 Sqm | |
| Drag Coefficent | 0.5 | |
| Air density | 1.25 kg/m^3. | |
| Simple Gear | NF/NB | 10 |
| Out shaft rotates | In same as input shaft Direction | |
| Controlled PWM Voltage | PWM frequency | 6000 Hz |
| Simulation Mode | Averaged | |
| Input voltage for 0 % duty cycle | 0 V | |
| Input voltage for 100% duty cycle | 5 V | |
| Output voltage amplitude | 350 V | |
| H bridge | Simulation Mode | Averaged |
| Regenrative Braking | Always enabled | |
| Enable threshold voltage | 2.5 V | |
| PWM signal amplitude | 5.0 V | |
| Reverse threshold voltage | 2.5 V | |
| Braking threshold voltage | 2.5 V | |
| Output voltage amplitude | 410 V | |
| Measurment Temp | 298.15K | |
| Second measurment temp | 398.15K | |
| Thermal mass | 100000 J/K | |
| Initial temp | 299 K | |
| DC motor | Model parameterization | By rated load and speed |
| No load speed | 8000RPM | |
| Rated speed | 6000RPM | |
| Rated load (Mechanical load) | 200 Kw | |
| Rated DC supply voltage | 400V | |
| Thermal mass | 20000 J/K | |
| Initial temp | 299 K | |
| Battery | Type | Lithium-ion battery |
| Nominal voltage (V) | 420 V | |
| Rated capacity | 200 Ah | |
| Initial state of charge | 100% | |
| Battery resposne time | 10s | |
| tire | parameterized by | peak longitudinal and corresponding slip |
| Rated vertical load | 3000 N | |
| Peak longitudinal force at rated load | 3500 N | |
| Rolling resistance | 0.3 m | |
| constant coefficient | 0.015 | |
| Inertia | inertia | 0.01 kg*m^2 |
Result =
Case no 1- FTP75 drive cycle. the test duration would be 2474 seconds.
To get the results of this model we have to keep the stop time to 2474 sec or above because of the given drive cycle source with FTP (2474 seconds).
so, now I am running the model by selecting the stop time as 2474 second by clicking the run button at the top of the window
So, we can see the following observation which is shown in the figure.
Vehicle speed scope=
this plot can be observed from the scope which is connected across the drive cycle source and feedback velocity which is coming from the transmission subsystem and the longitudinal driver block.
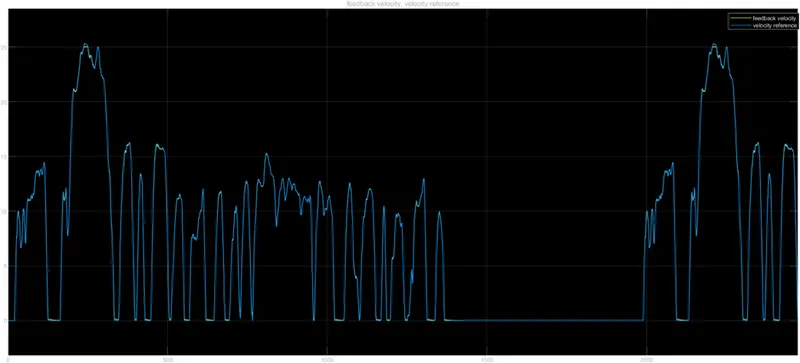
- from this response we can see, there are two signals. The blue signals shown is the drive cycle data and the yellow signal represents the vehicle body speed.
-the Longitudinal block successfully maintains the drive cycle data, processes it and controls the vehicle speed according to the reference speed.
-if we observe them, we can say that they are looking similar but not exactly. Because when we driving the car there will be speed variation according to the time, sudden stops and some other factors also affect such as type of road and rolling resistance etc.
-so there will be same movements like high speed, low speed but due to the factor effected in the real time there will be a variation from the original drive cycle.
SOC Scope =
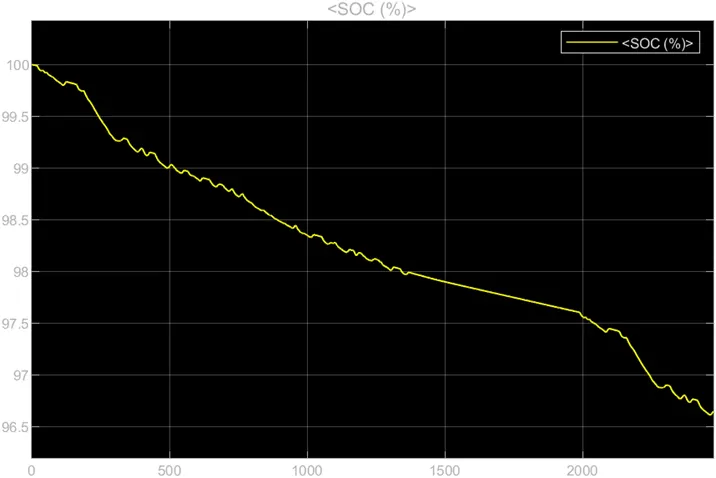
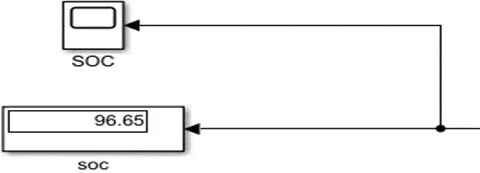
the above graph has been observed form the scope block which is connected to the battery through selector bus
-the SOC graph shows the state of battery varies over the drive cycle time.
-initially the battery SOC is 100 %
- as the simulation starts then there will be a fall of SOC.
- the charge of the battery gets decreased from 100 % to 96.65%
- the spikes in battery SOC graph shows regeneration during the deceleration of the vehicle as battery starts recharging and motor acts as generator.
Distance covered=
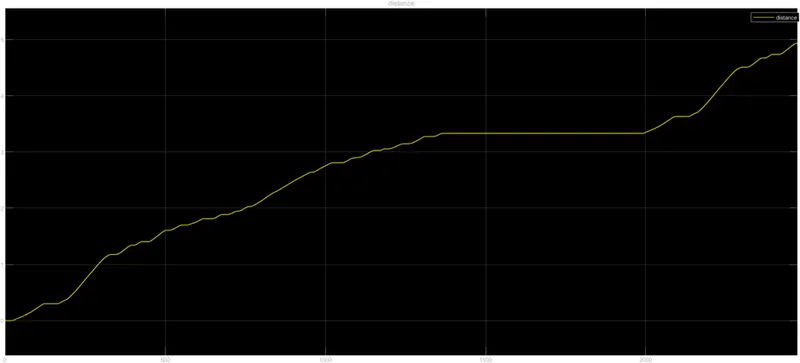
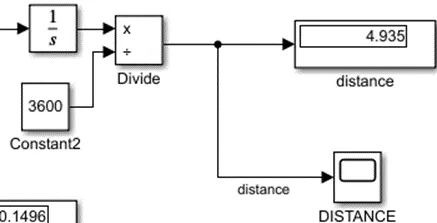
-we convert velocity speed to distance that is km/hr to only km by using integrator block, constant block of 3600, divide block.
-from this graph and display block, we have seen that the total distance covered during the period of 2474 seconds is 4.935 km.
Current scope=
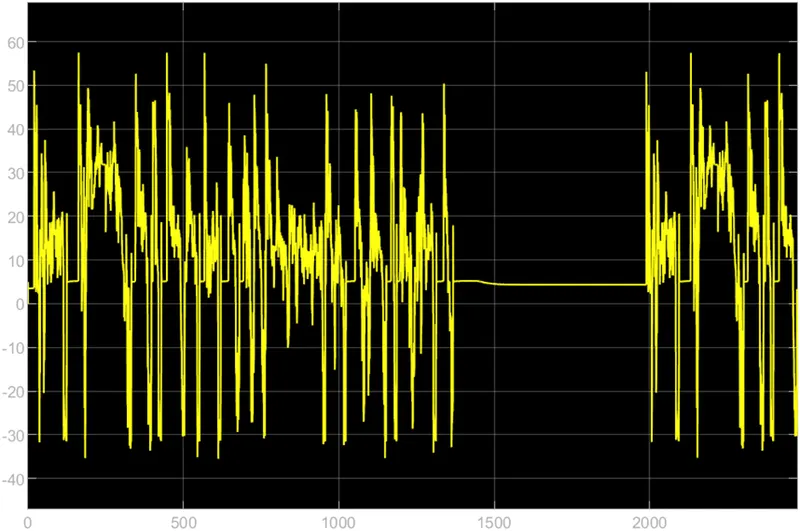
-the above graph shows the current variations of the motor according to drive cycle.
-the current sensor is connected between the H-bridge and DC motor senses the current changes and they are plotted through the scope block, so this current variation is observed from the changes in DC motor conditions.
-we can see that current increases according to acceleration and decreases according to the deceleration.
-when the vehicle is maintaining a constant acceleration or deceleration then the current is also maintaining its range according to it.
-at peak value the maximum current is approximately 59 A, at neutral condition that is at 0 velocity the current value is also settled at nearby zero value and during deceleration of the electric rickshaw the current value is also going to decrease in negative values.
Energy consumption=
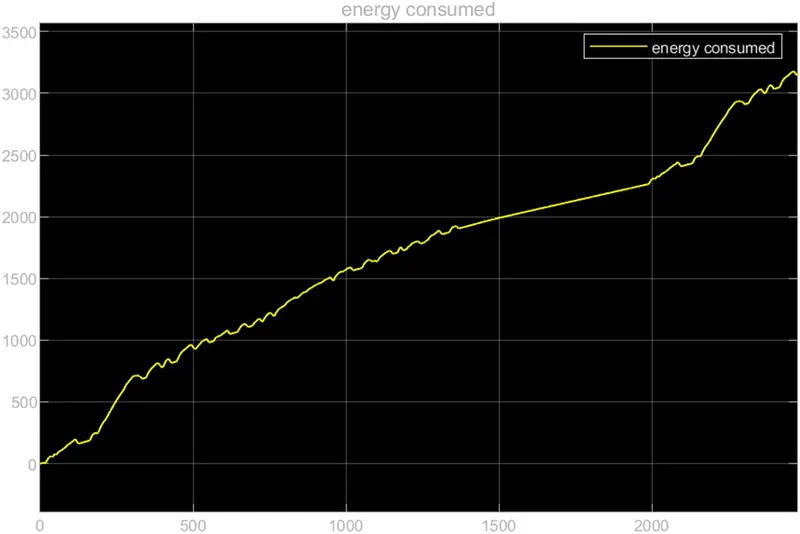
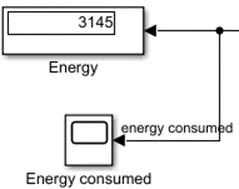
- The energy consumed by the battery is varied with respect to time and distance is 3145 Wh.
Motor and controller temperature=
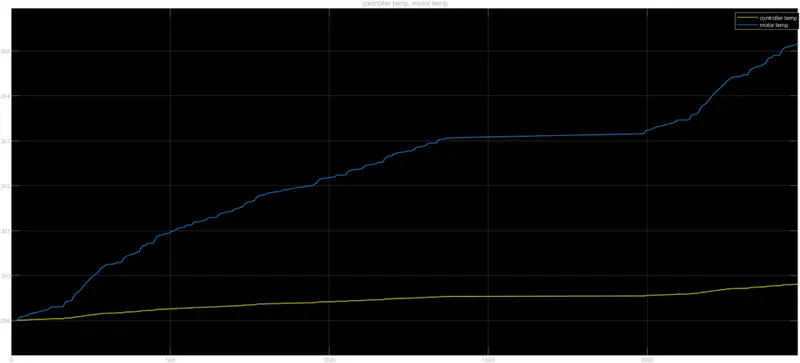
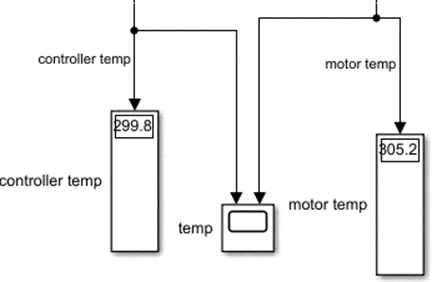
The controller temperature increases from 299 K to 299.8 K.at the same time, The motor temperature increases from 299 K to 305.2 K.
Case no 2) UDDS drive cycle. the test duration would be 1369 seconds.
Vehicle speed scope=
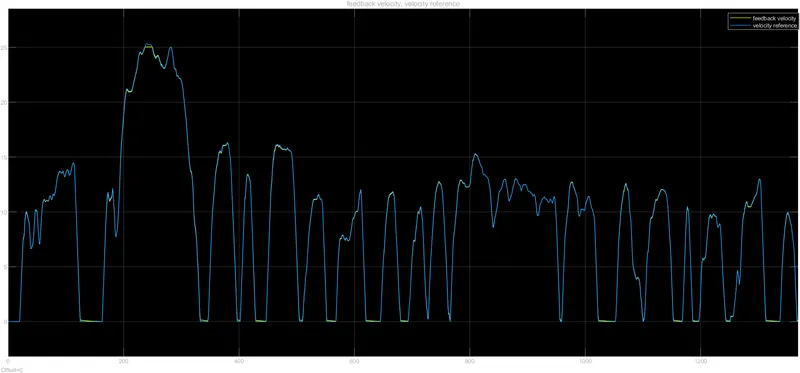
- from this response we can see, there are two signals. The blue signals shown is the drive cycle data and the yellow signal represents the vehicle body speed.
SOC Scope =
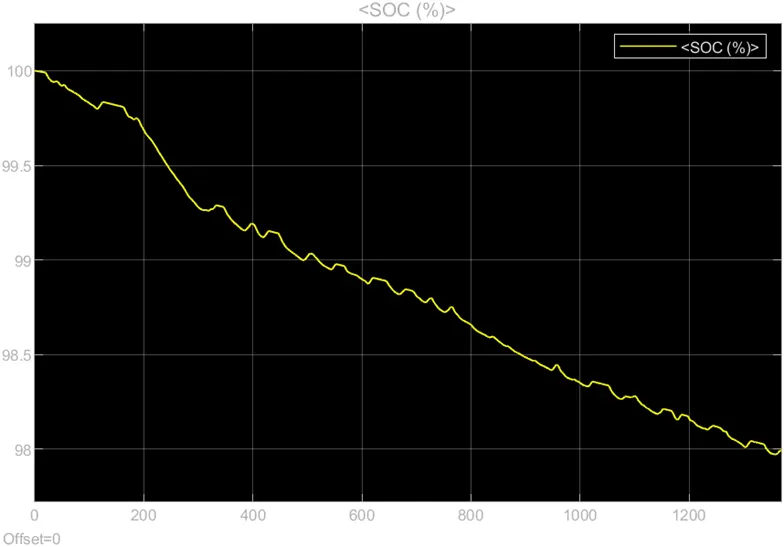
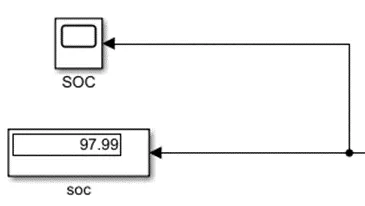
the charge of the battery gets decreased from 100 % to 97.99 % .
Distance covered=
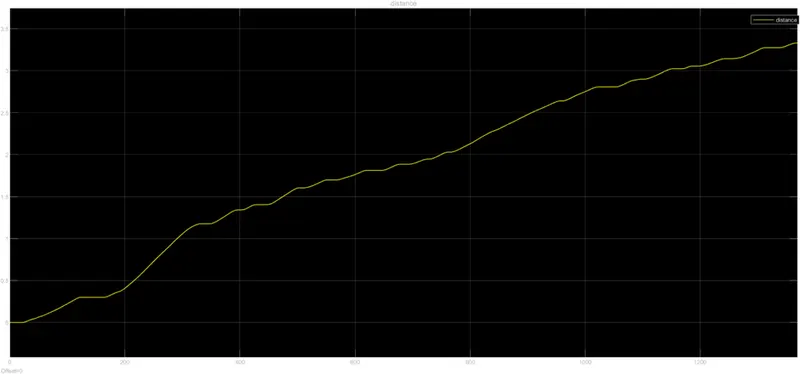
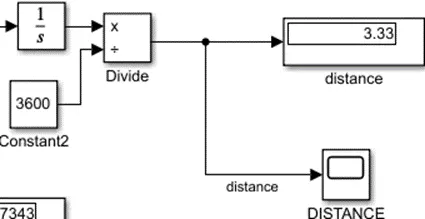
from this graph and display block, we have seen that the total distance covered during the period of 1369 seconds is 3.33 km.
Current scope=
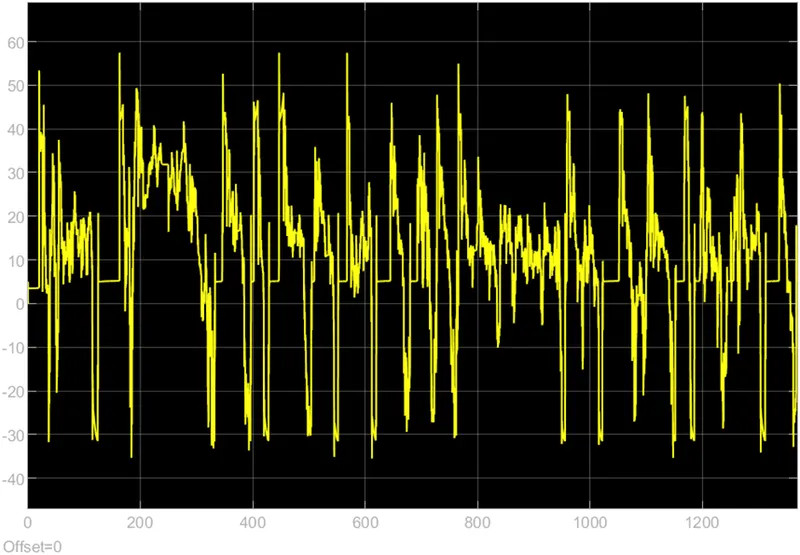
we can see that current increases according to acceleration and decreases according to the deceleration.
-at peak value the maximum current is approximately 59 A, at neutral condition that is at 0 velocity the current value is also settled at nearby zero value and during deceleration of the electric rickshaw the current value is also going to decrease in negative values.
Energy consumption
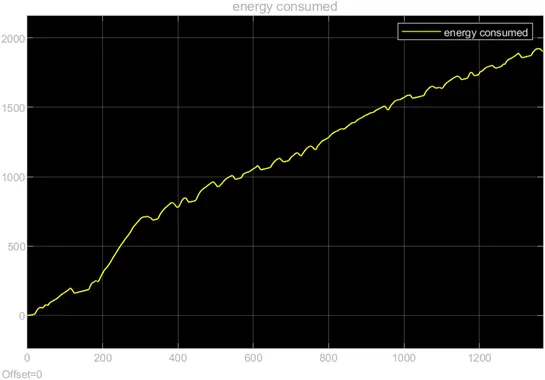
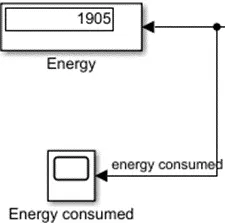
- The energy consumed by the battery is varied with respect to time and distance is 1905 Wh.
Motor and controller temperature=
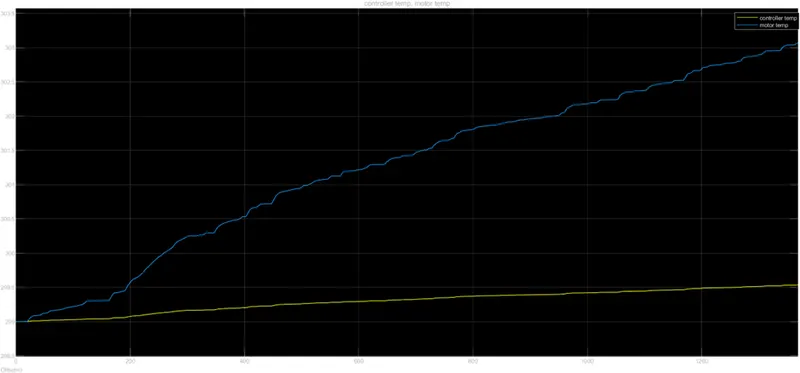
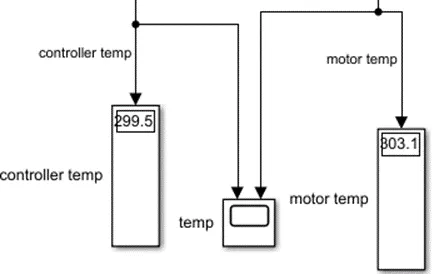
The controller temperature increases from 299 K to 299.5 K.at the same time, The motor temperature increases from 299 K to 303.1 K.
Case no 3= WLTP drive cycle. the test duration would be 1800 seconds.
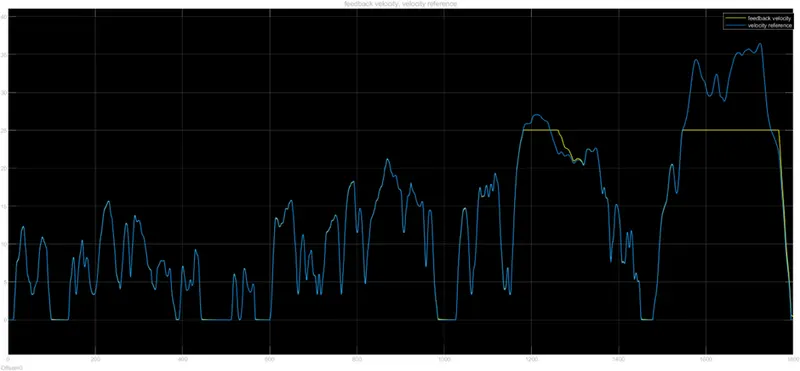
Vehicle speed scope=
SOC Scope =
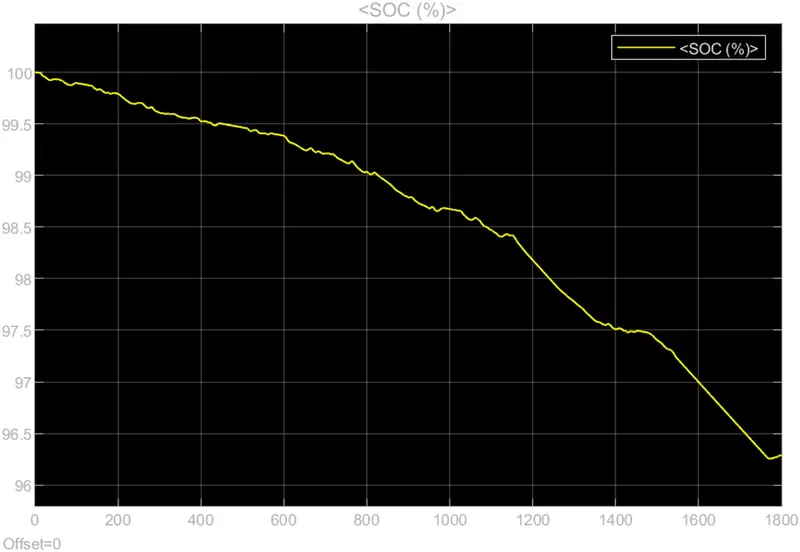
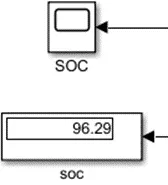
the charge of the battery gets decreased from 100 % to 96.29 %.
Distance covered=
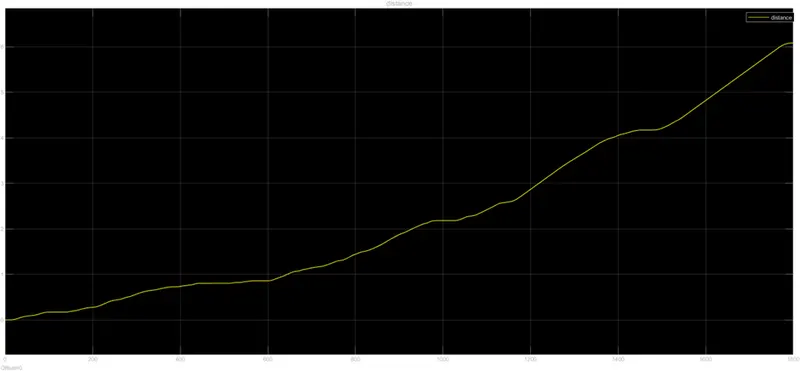
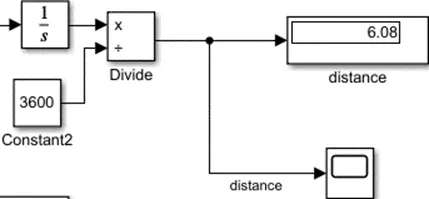
from this graph and display block, we have seen that the total distance covered during the period of 1800 seconds is 6.08 km.
Current scope=
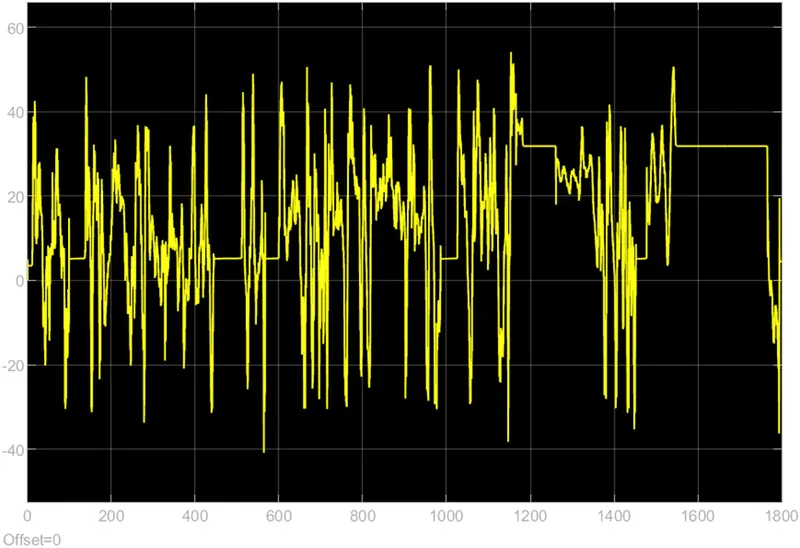
Energy consumption
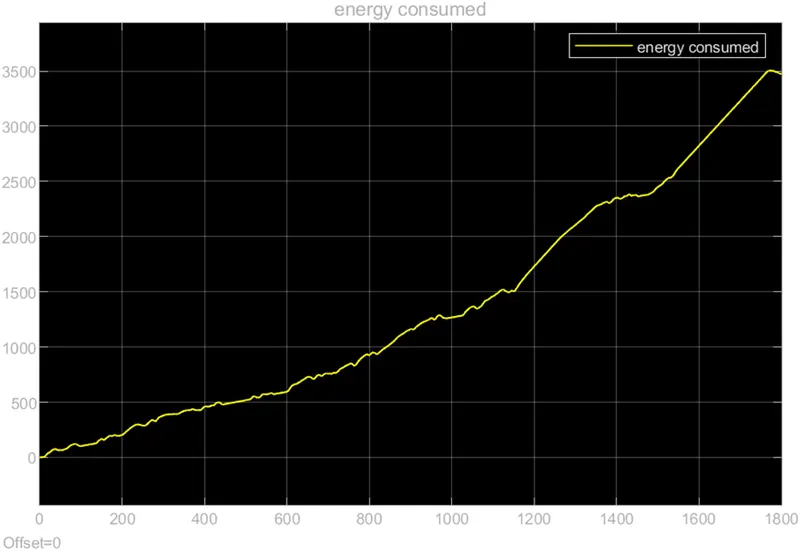
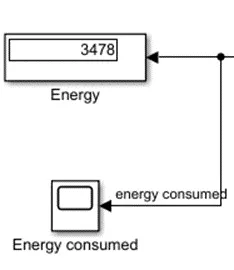
- The energy consumed by the battery is varied with respect to time and distance is 3478 Wh.
Motor and controller temperature
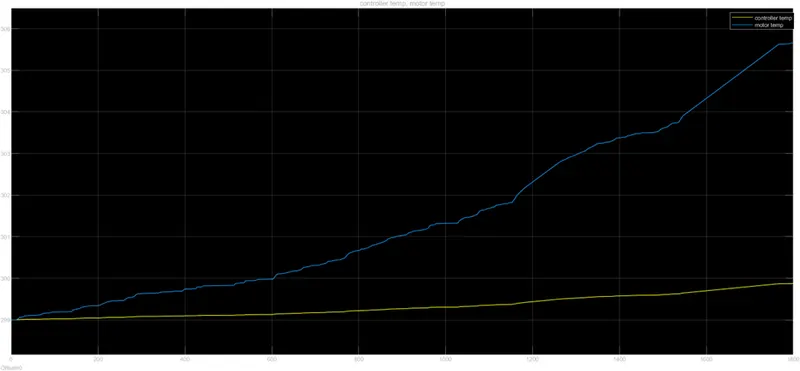
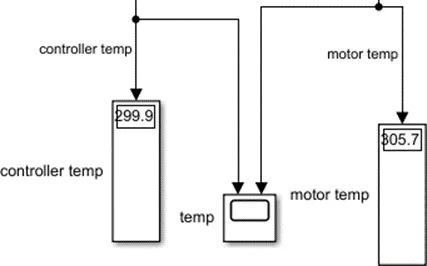
The controller temperature increases from 299 K to 299.9 K.at the same time, The motor temperature increases from 299 K to 305.7 K.
Case no 4) WOT ,100 Km @45 Kmph or 12.5 m/s drive cycle .the duration for this cycle is 28828 second.
Vehicle speed scope=
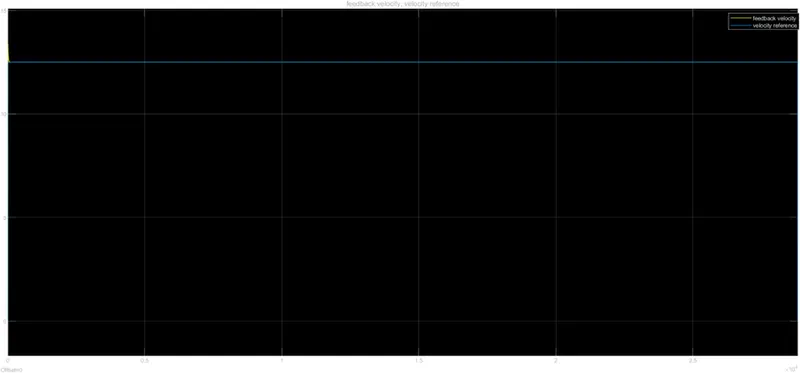
From the velocity graph for this drive cycle, we can see that it follows the drive cycle and stays at 12.5 m/s throughout the simulation time.
SOC Scope =
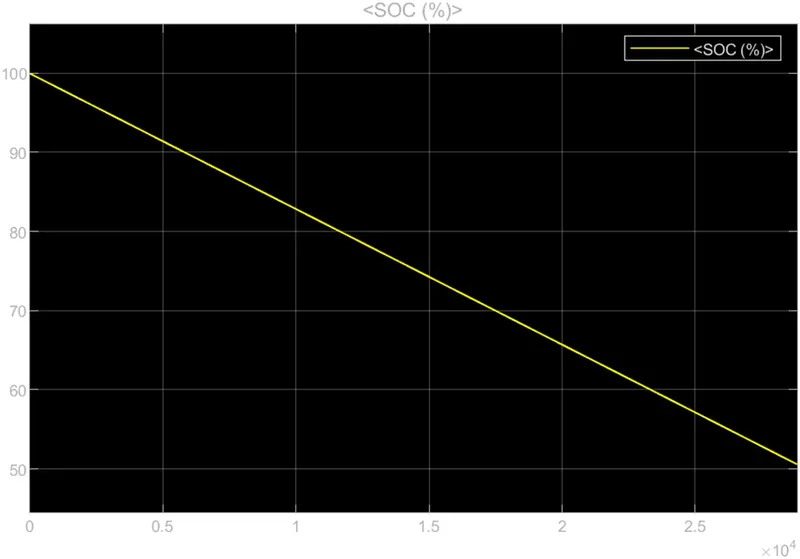
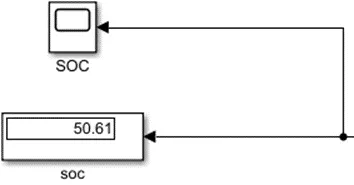
The SOC graph for this drive cycle is pretty straight forward because there is no braking or deceleration taking place. So, the SOC value decreased proportional to the distance covered. Only 50.61% of the battery capacity was remaining after completing this drive cycle.
Distance covered=
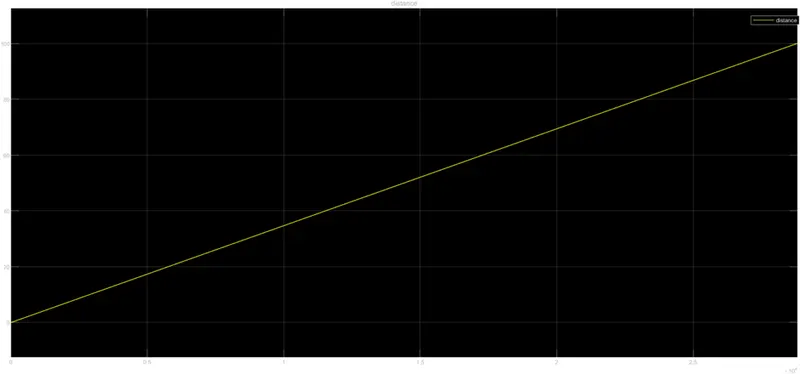
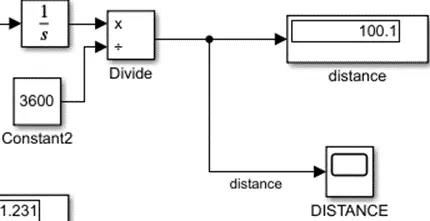
from this graph and display block, we have seen that the total distance covered during the period of 1800 seconds is 100.1 km.
Current scope=
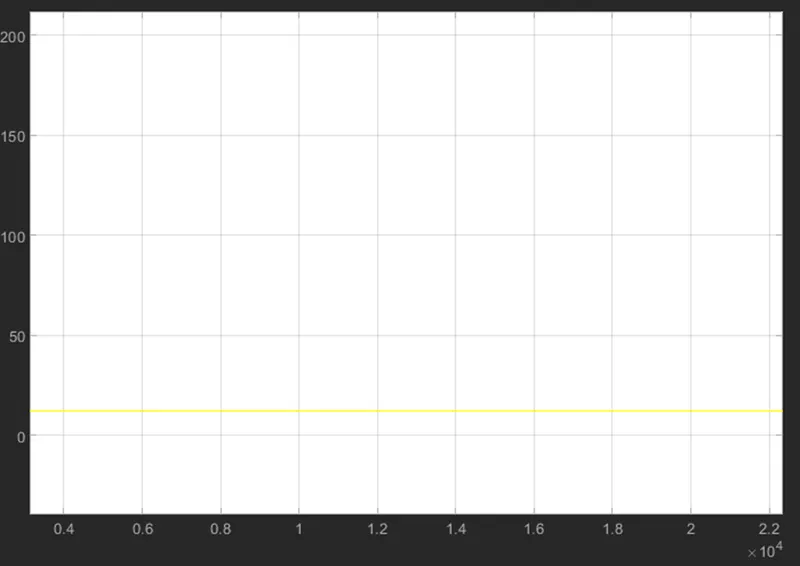
Looking at the current variation graph we can see that at the start of the simulation, the current reached very high value to attain the 12.5 m/s mark in an instant but after that the current drastically decreased and reached at constant level and it stayed at this value till the end of the simulation.
Energy consumption
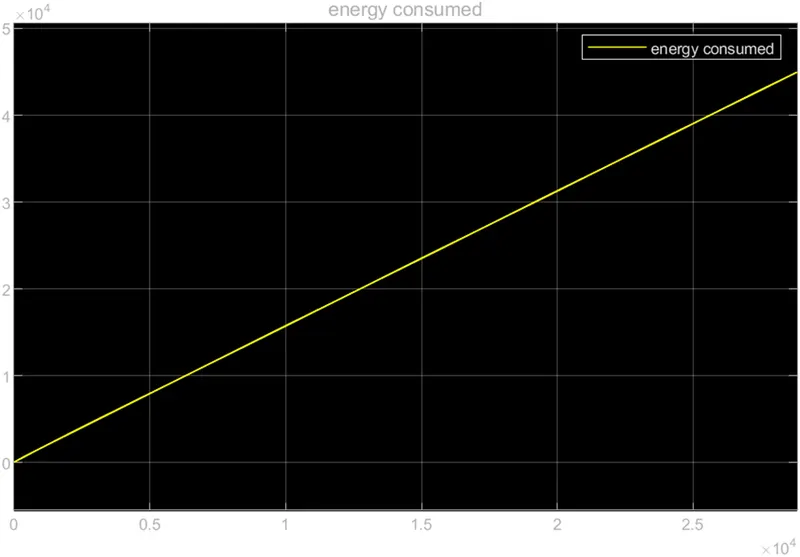
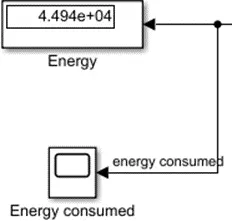
- The energy consumed by the battery is varied with respect to time and distance is 44,940 Wh.
Motor and controller temperature=
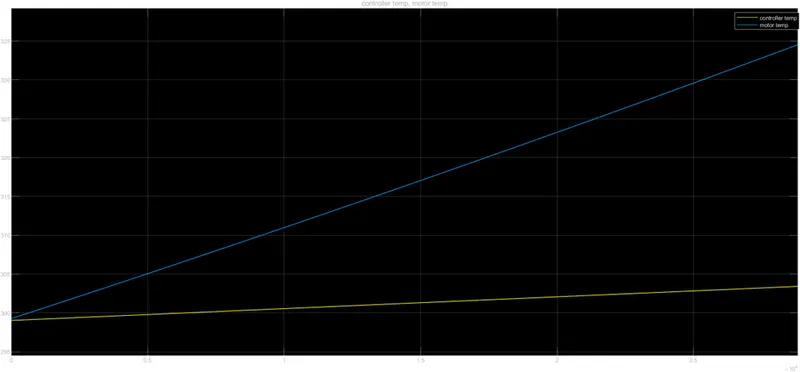
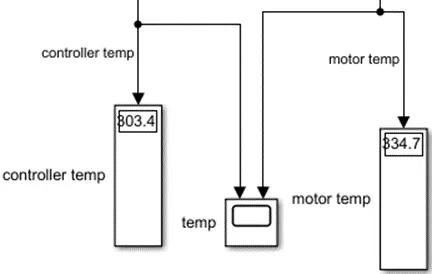
The controller temperature increases from 299 K to 303.4 K.at the same time, The motor temperature increases from 299 K to 334.7 K.
Results of all four cases=
The below table shows the distance covered by the vehicle during the drive cycle, energy consumed, motor temperature and converter temperature, state of charge percentage of the battery in three drive cycle sources.
| PERFORMANCE RESULT OF VARIOUS DRIVE CYCLE | ||||||
| DRIVE CYCLE | DISTANCE | ENERGY | MOTOR TEMP. | CONVERTER TEMP. | SOC% | |
| FTP 75(2474 sec) | 4.935 Km | 3145 Wh | 305.2 K | 299.8 K | 96.65% | |
| UDDS(1369 sec) | 3.33 Km | 1905 Wh | 303.1 K | 299.5 K | 97.99% | |
| WLTP (1800 sec) | 6.08 Km | 3478 Wh | 305.7 K | 299.9 K | 96.29% | |
| WOT (28828 sec),100 Km @45 Kmph or 12.5 m/s | 100.1 KM | 44,940 Wh | 334.7 K | 303.4 K | 50.61% | |
MODEL LINK=
https://drive.google.com/file/d/11SZn6X0TpzFZ-HXayF-3v8VqEbCKV1-W/view?usp=share_link
Conclusion=
- An Electric Rikshaw (three wheeled passenger vehicle) is designed using a Permanent magnet DC brushed Motor and a lithium-ion battery as per given condition with three different drive cycles namely FTP75, UDDS, WLTP Class 3 and WOT for 100Km @45 Kmph or 12.5 m/s, also calculated energy consumed by the motor, motor temperature. converter temperature, state of charge percentage of the battery for each drive cycle and all this results analysed.
- here I have compromised with the temperature of motor and controller to achieve vehicle speed is near to reference speed. Since I have not used any cooling system in this model in the real time application as these temperature values are within the operating temperature range and hence no issues.
- In the real time application, the motor, battery and controller temperature are controlled by air cooling. Hence, the temperature of this components is not increased to this extent.
- For every respective cycle we saw the velocity profile following the given drive cycle data, and attaining the close value to the actual speed of the drive cycle.
-The SOC of the battery for each cycle depends on various factors. The coefficient of rolling resistance, Thermal mass, Gear ratio, etc. By varying these parameters, we can change the SOC of the battery for the particular drive cycle.
- In this study, Electric Rickshaw and its components have been simulated in order to investigate the energy flow, performance and efficiency. Good results for Battery Voltage, Current, and Power were shown by using MATLAB-Simulink.
- From the simulation we can say that the Electric Rickshaws are much more efficient compared to the traditional Auto-rickshaw as they are non-polluting and the power loss is comparatively less.
- This Battery-powered Rickshaw will be the most popular mode of transport in the future.