Project - Data Handling and Interpolation
%% data handling and interpolation
clear all
close all
clc
A= xlsread('VI.xlsx'); % importing the xlxs from xl to matlab
v= A(:,1); % voltage values from xl column 1
i= A(:,2); % current values from xl column 2
v1= -17.3:0.1:0.9; % range given in quetion
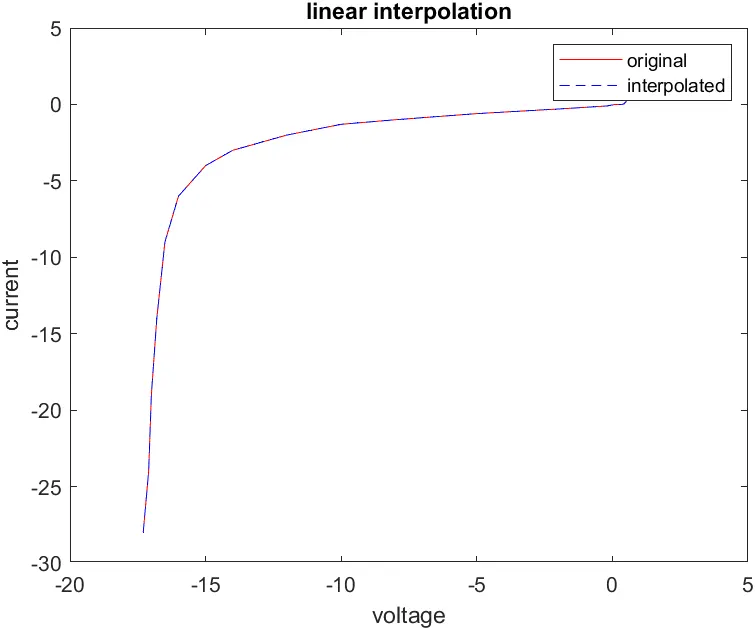
ib1= interp1(v,i,v1); %interpolating the values
figure(1)
plot(v,i,'r',v1,ib1,'b--'); % plotting the interpolated values with the voltage and current.
title('linear interpolation'); %title of figure 1
xlabel('voltage');
ylabel('current');
legend('original','interpolated');
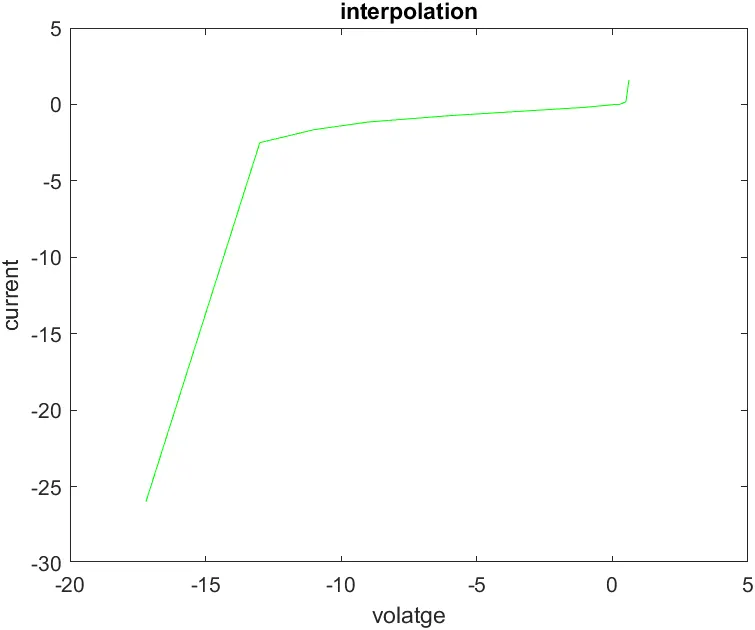
vs=[-17.2000 -13 -11 -9 -6 -1 0.1100 0.2500 0.5000 0.6100 0.6600]; % given values in quetion
i2=interp1(v,i,vs);
figure(2)
plot(vs,i2,'g');
title('interpolation'); %title of figure 2
xlabel('volatge');
ylabel('current');
vsi2=[vs;i2];
fid=fopen('voltage_current.txt','w'); % save in text file
fprintf(fid,'%55s %10s\n','voltage','current');
fprintf(fid,'%5f %10f\n',vsi2);
fclose(fid);