Week-4 Challenge WOT Condition Part-2
1) Mapped model : A mapped model is based out on predefined lookup tables which are assigned with definite values obtained by experimenting and repeating the experiments. These models do not work on real time scenarios and depend on data from the lookup tables and provide results accordingly. As a result, these models aren't highly efficient, but, they help in reducing the simulation time thereby giving the results quickly.
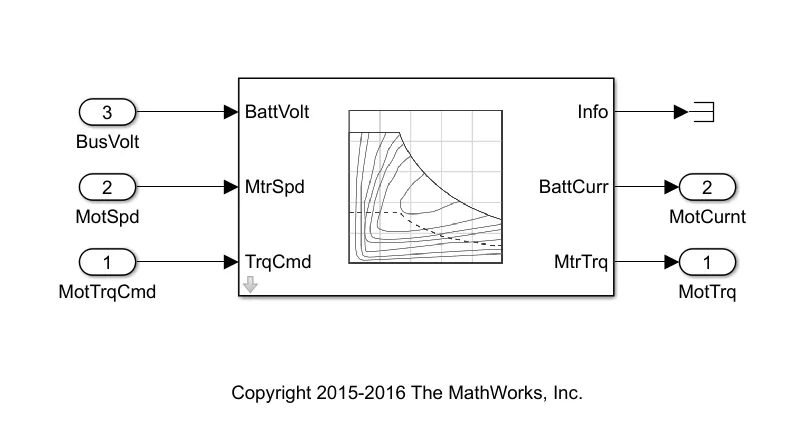
The above figure shows a mapped model of a motor. To increase the efficiency of these models, lots of experimentation and accurate data needs to collected and fed into the look up tables.
Dynamic Model: A dynamic model works on real time scenarios where outputs of model are again fed into the model and real time values are used instead of predefined values to obtain the final results. The values are fed into the model by user in the beginning and later the model takes the values according to the scenarios being run during simulation and changing conditions.
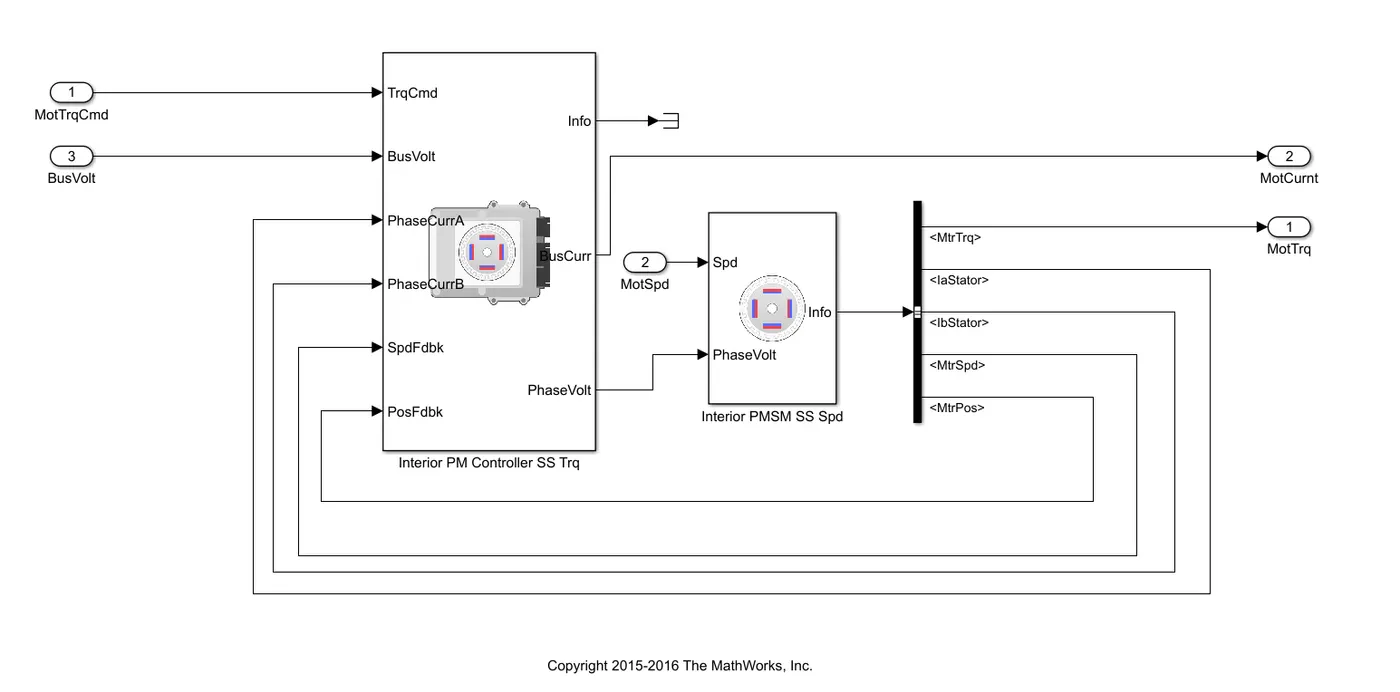
The aboce figure shows the dynamic model of a motor. Since the values taken are in real time, the model gives out solutions close to real world scenarios and thus this variant is accurate and efficient, with only problem being long simulation times.
In the simulink model. we have both mapped and dynamic variants for engine, motor and generator. To choose either one, we need to select the corresponding block, right clicking gives an option of variant to choose from and we can override the variant with another in selection as follows:
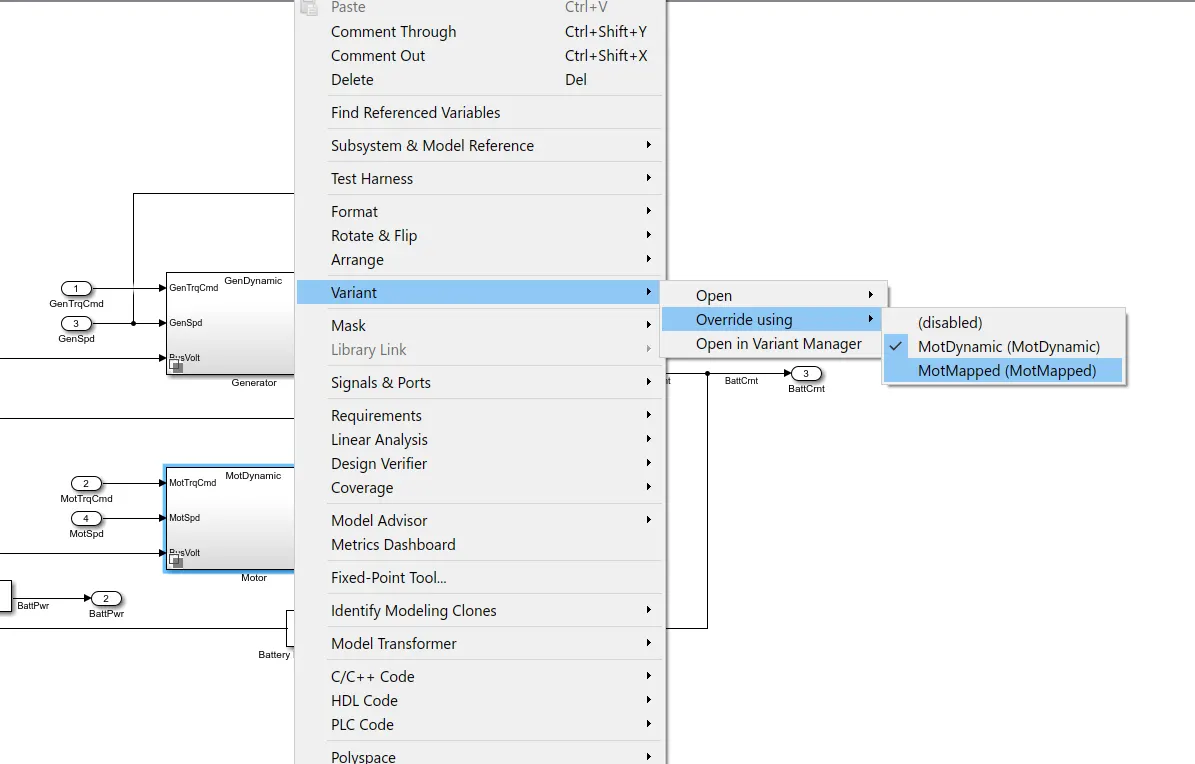
The same can be done using variant manager.
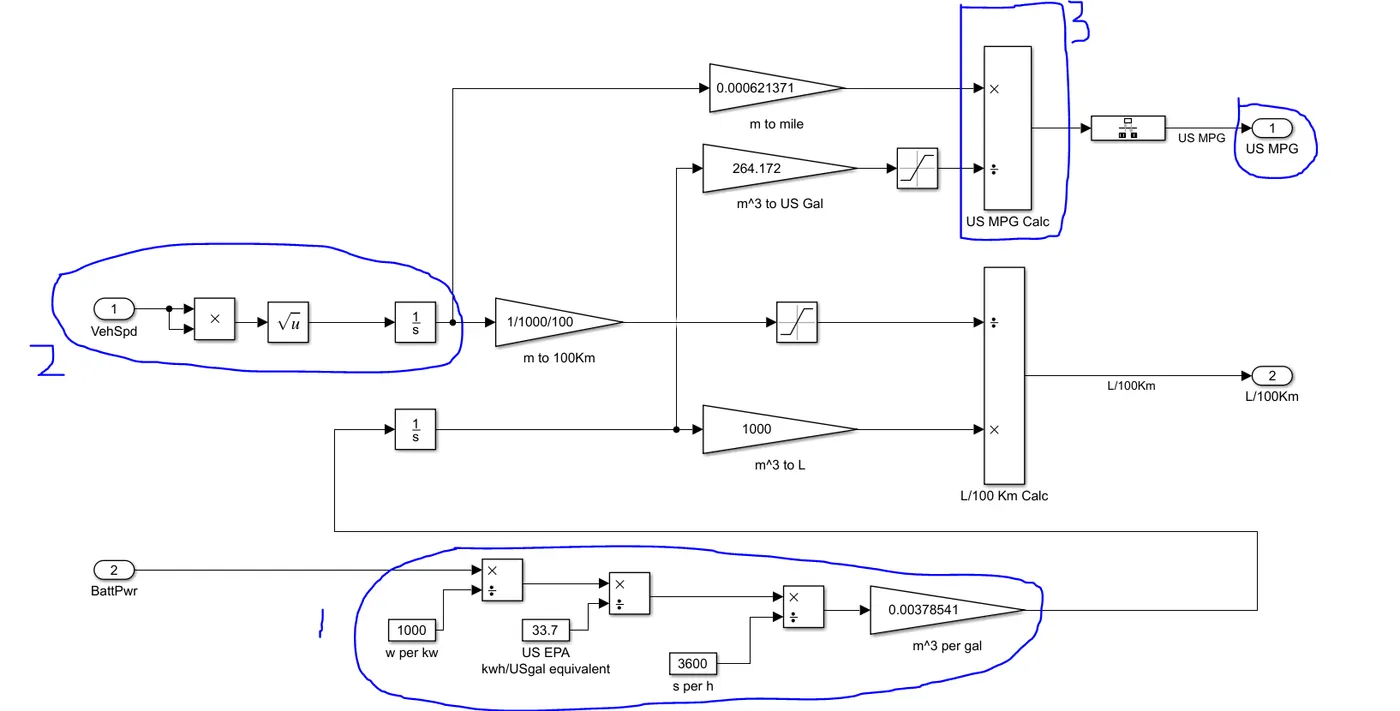
2)miles per gallon of gasoline equivalent or MPGE means the number of miles a vehicle runnning on non gasoline fuel could reach by using energy which is equivalent to chemical energy stored in 1 gallon of gasoline. The conversion is done using KW units.
In the model, the energy used from the battery by the vehicle is counted in KWh by integrating battery power over time. The chemical energy stored in 1 gallon of gasoline is 33.7 kWh and the battery energy is converted accordingly.
The vehicle speed is integrated over the same time period and converted to miles. This is then divided by the value of energy obtained in the energy calculation mentioned above. The result gives the MPGevalue.
3)The model HEV Reference Application is opened and WOR drive cycle is selected from drive cycle block. The drive cycle paramters can be defined accordingly. To change the grade angle and wind velocity, environment block is double clicked and values are changed.
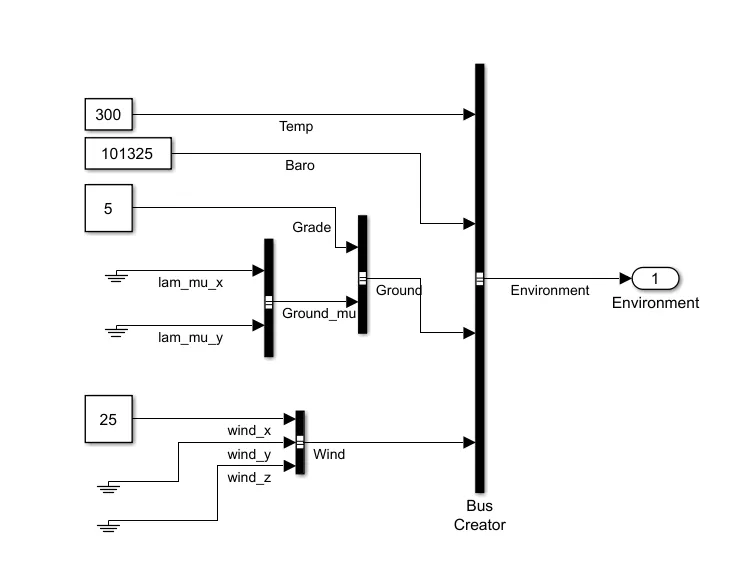
The model parameters are as follows:
start time - 5
grade-1
wind velocity 15
simulation time -100
deceleration start time - 70
reference speed - 100
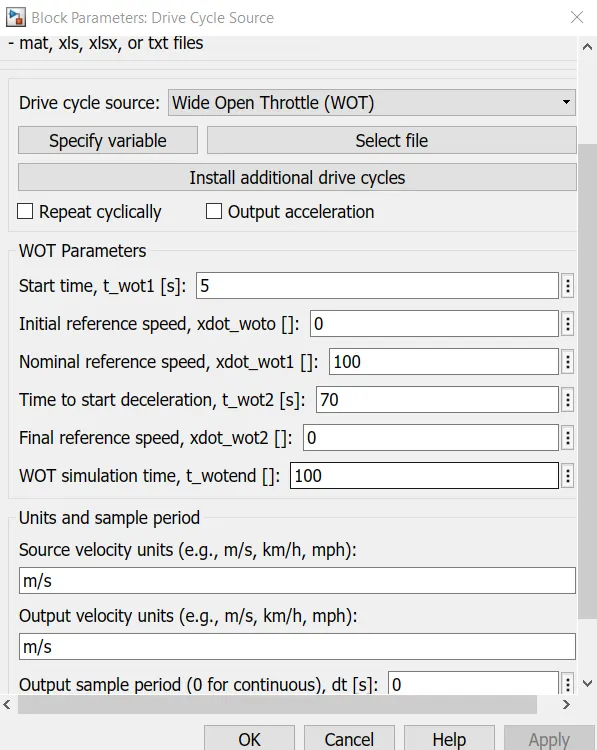
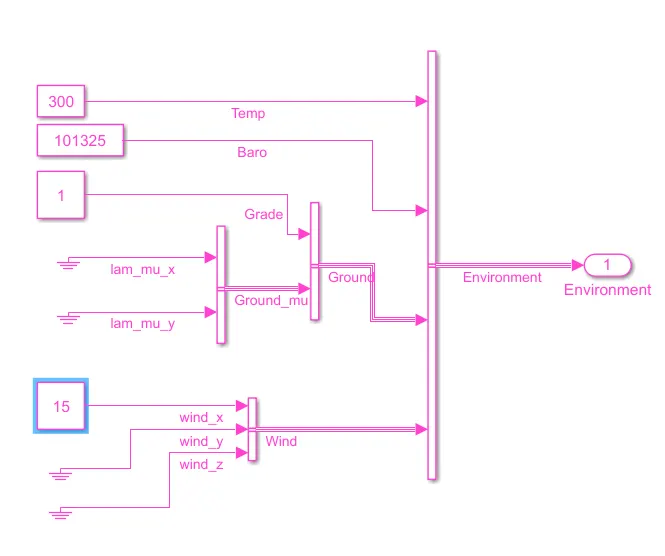
Upon simulating , the following is the result obtained:
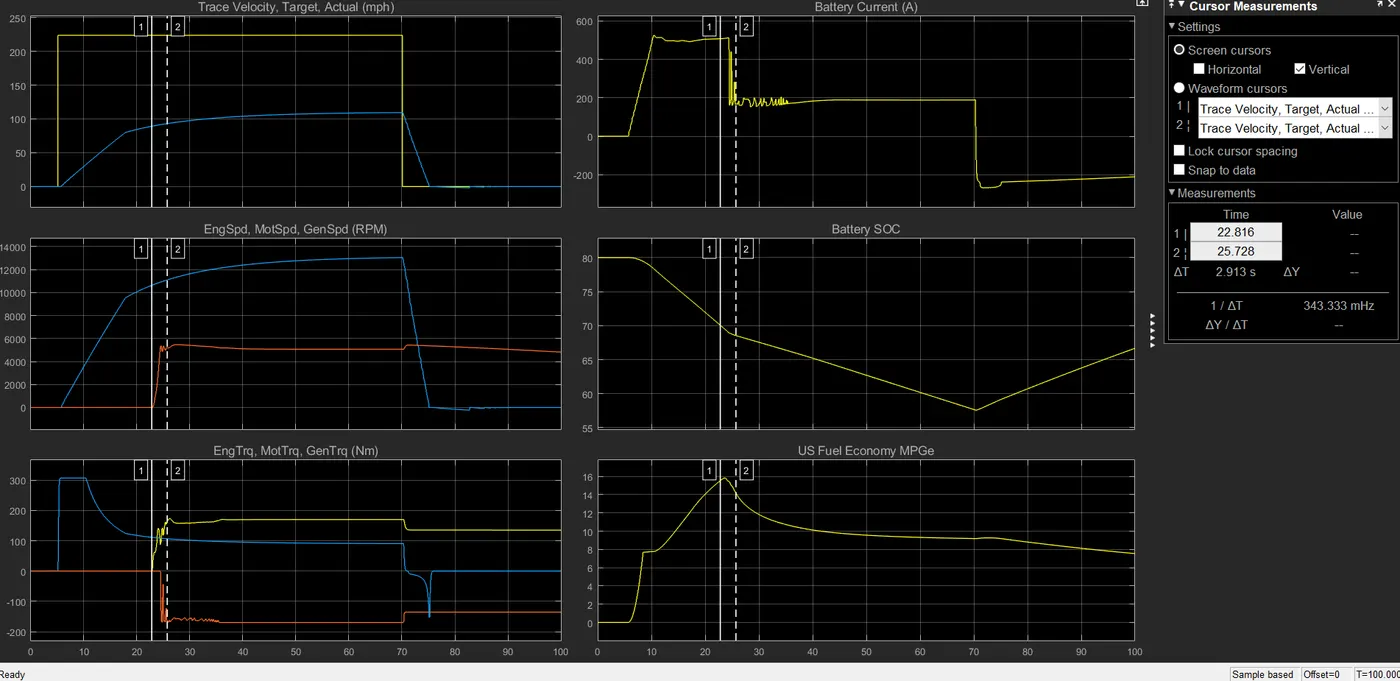
PLot 1 shows the vehicle reaches the reference speed before 20 seconds, a bit later than in the model with no grade and wind velocity.
in plot 2, the change in generator, motor and engine speed is shown. The engine and generator graphs are overlapped here shown in red and yellow.
plot 3 shows the torque of the gen, motor and engine. After 20 sec mark, the engine is turned on and the generator starts producing power. The motor and engine both work in propelling the vehicle and after sometime the engine dominates the power production.At 70 secs, the throttle is cut off and the motor goes in regen and engine power is reduced. At this point, the engine is only used to run the generator and charge the battery.
Plot 4 depicts battery current and how it varies. When the engine is turned on, the current from battery is reduced and after 70 secs, when the throttle is cut off, the motor goes into regen producing negative current which is supplied to battery.
PLot 6 and 7 show the SOC of the battery and the MPGe fuel consumption for the drive cycle respectively.
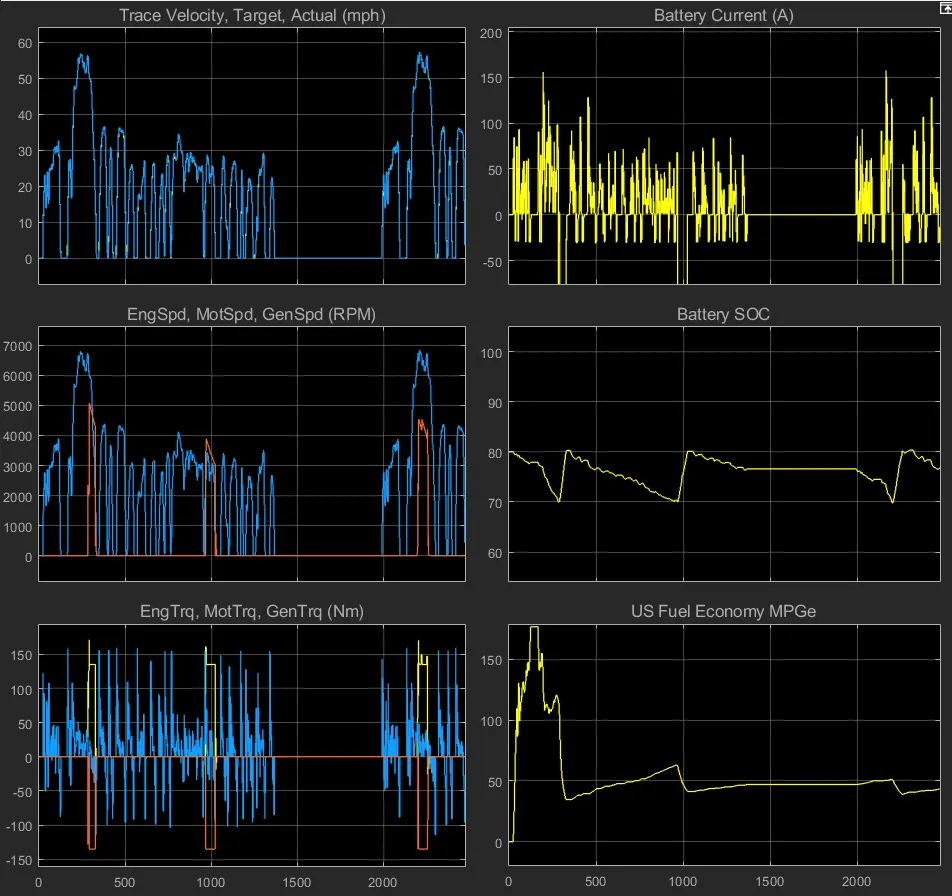
4) The following is the result obtained for HEV model.
The following is the result obtained for EV model reference.
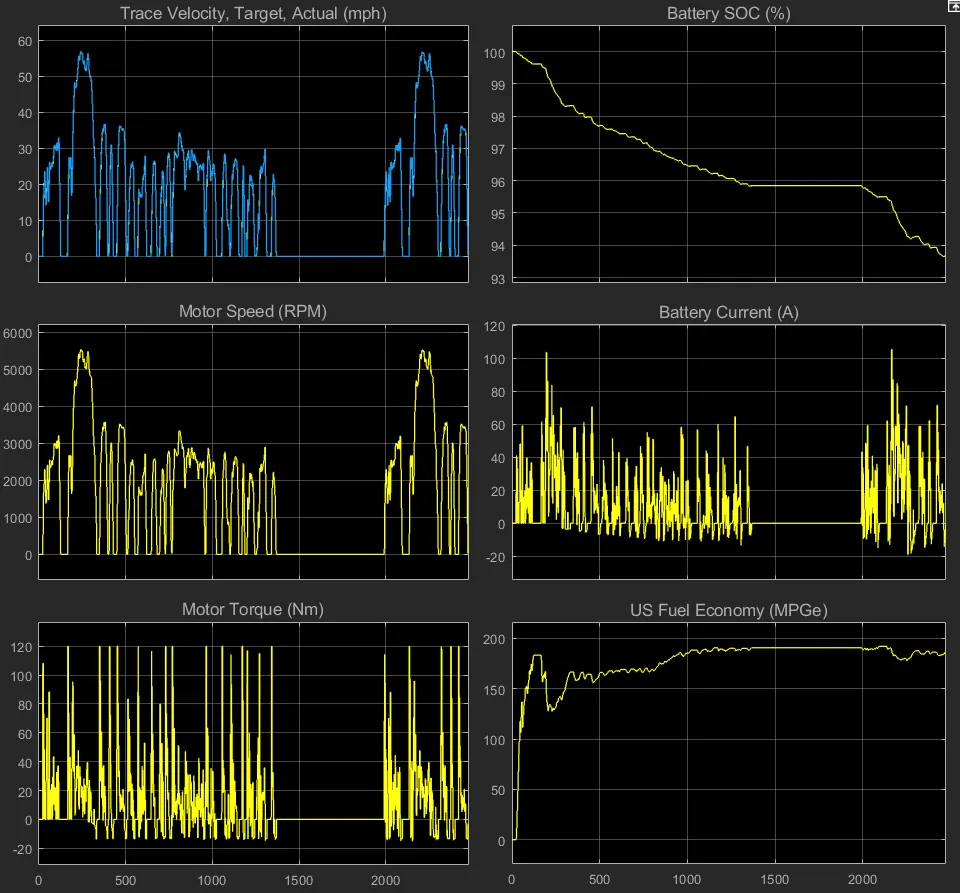
Both the cases are simulated using FTP drive cycle for same paramters.
The only difference is, EV uses battery and motor to achieve the propulsion, whereas the hev uses different modes of motor, engine, generator, fuel and battery to achieve the propulsion.
in the hev model, the SOC of the battery is maintained between 80 and 70. Whenever the battery soc reaches 70%, the battery is charged by generator using engine. The thermostat mode is used in this case. This can be seen by the timing of engine turining on and off in the 2nd and 3rd plot, which drives the generator which inturn charges the battery.
In EV, the battery is charged only under regen when vehicle is slowed down which can be seen in rise in SOC under steep deceleration.
The MPGe value of the EV is higher as there is no fuel used in EV.