Week - 4
#PART 1 - IMPLEMENT CONTROL LOGIC OF A 'WASHING MACHINE' USING STATEFLOW
AIM -
- Implement control logic of a “washing machine” using Stateflow as per given sequence:
- If the power supply is available, the system gets activated.
- If the Water supply is not available, stop the process & indicate through LED.
- Soaking time should be 200s followed by Washing time of 100s.
- Then rinsing happens for next 20s & dryer runs for 50s.
- After all the processes have completed turn on the finished LED.
MODEL -
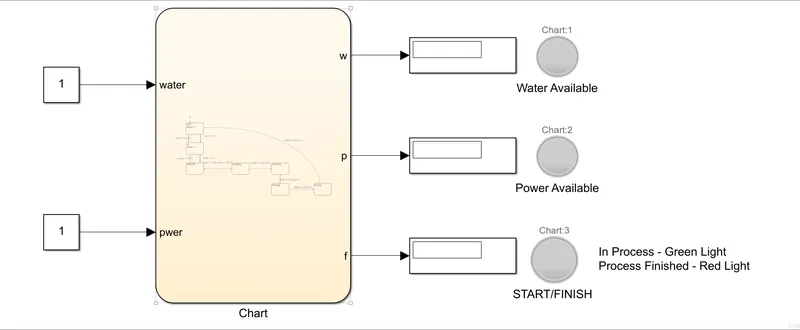
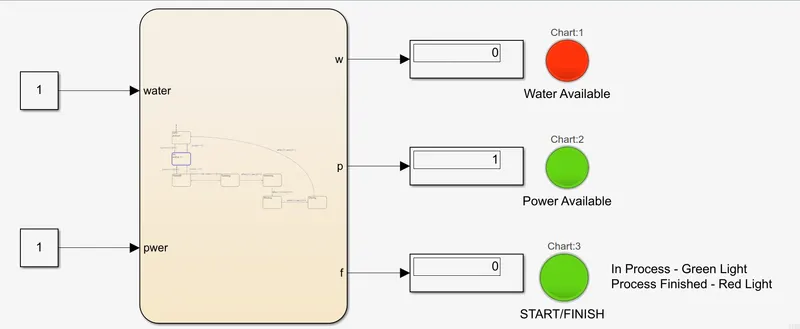
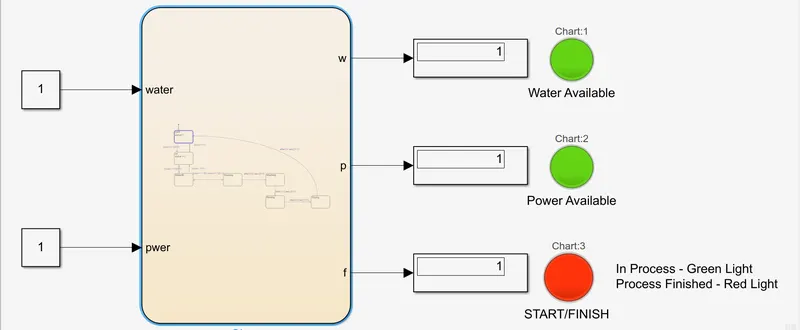
Figure 1 - Simulink model for implementing control logic of 'Washing Machine'
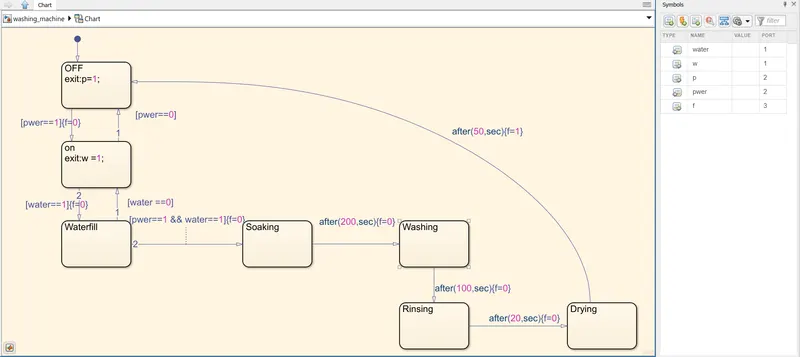
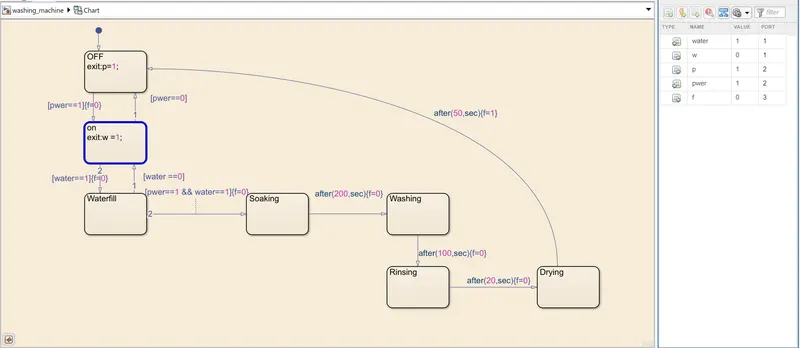
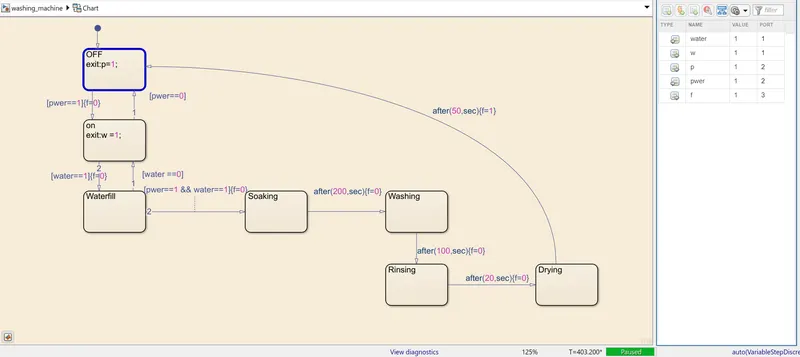
Figure 2 - Stateflow sequence inside the chart block
PROCESS/MODEL EXPLAINATION -
- We have defined some input and output variables for the implementaition of the control logic.
- 'pwer' and 'water' are the input data/variables for the power supply and water supply respectively at the input.
- 'p','w' and 'f' are the output variables defined for signalling power availability, water availability and finished/in process operation at the output side. The same can be seen in the symbols pane on the right hand side of figure 2.
- Following are the meaning for various conditions and actions -
- pwer = 0 - No power supply (At input)
- pwer = 1 - Power supply available(At input)
- water = 0 - No water supply(At input)
- water = 1 - Water supply available (At input)
- p = 0 - Red LED signal for no power available (At the ouput side)
- p = 1 -Green LED signal for power available (At the output side)
- w = 0 - Red LED signal for no water supply available (At the ouput side)
- w = 1 - Green LED signal for water supply available (At the output side)
- f = 0 - Various operations of the machine are in process (Green LED signal)
- f = 1 - All the operations are finished (Red LED signal)
- We have linked the LED lamps with respective display blocks. Like 'Water Available' LED with 'w' Display block, 'Power Available' LED with 'p' Display block and 'START/FINISH' LED with 'f' Display block
- Starting with the chart block in which we have defined states sequentially for the operations of the washing machine. Firstly, we have defined 'OFF' state in which we have given exit condition from 'OFF' state as p=1 if pwer==1 (if power suply is available) and action f = 0 (in process condition,Green LED at output). If conditions are satisfied the process will move to next state which 'ON' state and 'Power Available LED' will glow green at the output. The process is shown in below snippet -
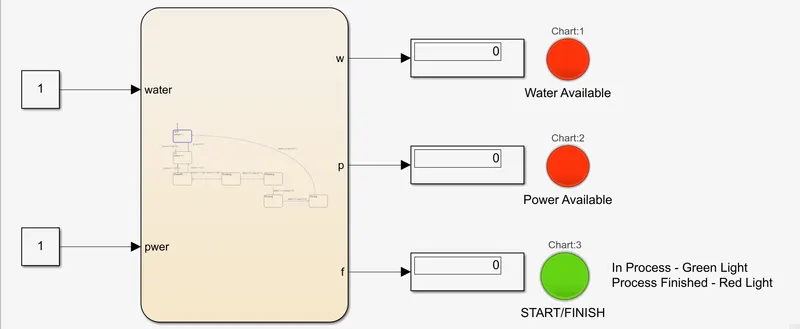
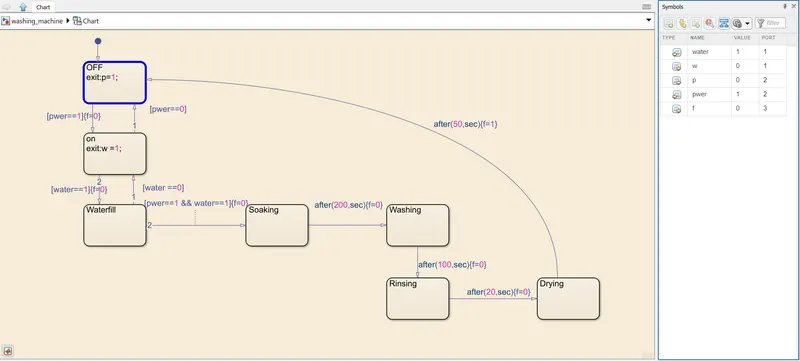
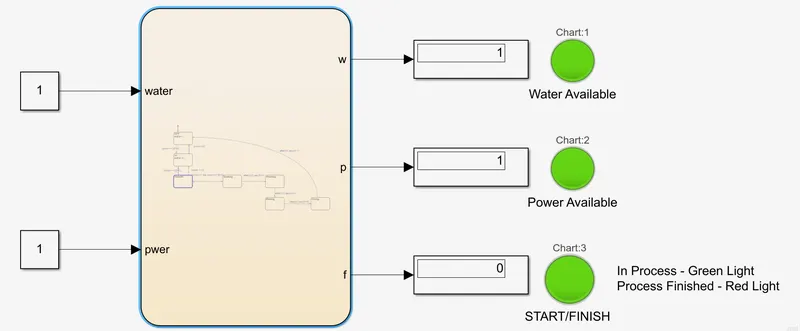
Transition from OFF (above fig) to ON (below fig) state -
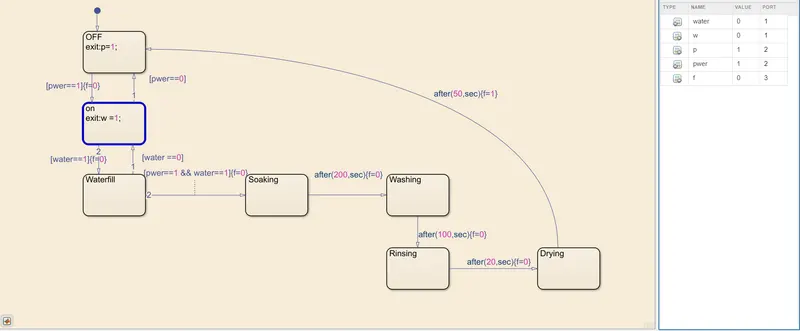
- Now in the 'ON' state in which we have given exit condition from 'ON' state as w=1 if water==1 (if water suply is available) and action f = 0 (in process condition).If condition is satisfied the process will move to next state of 'Waterfill' and 'Water Available LED' will glow green at the output. Below is the snippet -
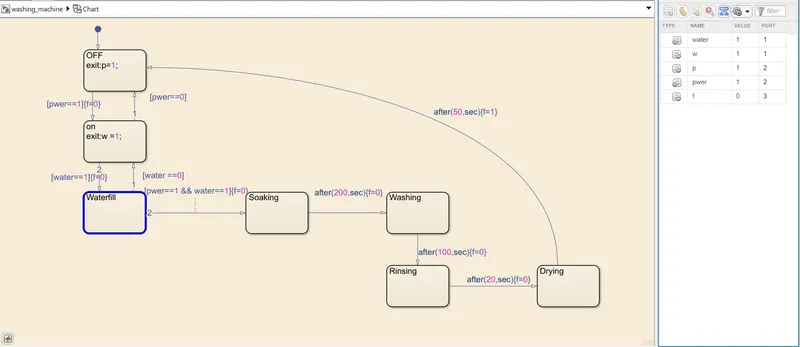
- After 'Waterfill' state, as both the condtions of 'pwer ==1' and 'water==1' is satisfied the process will move to the next state of 'Soaking'. Below is the snippet -
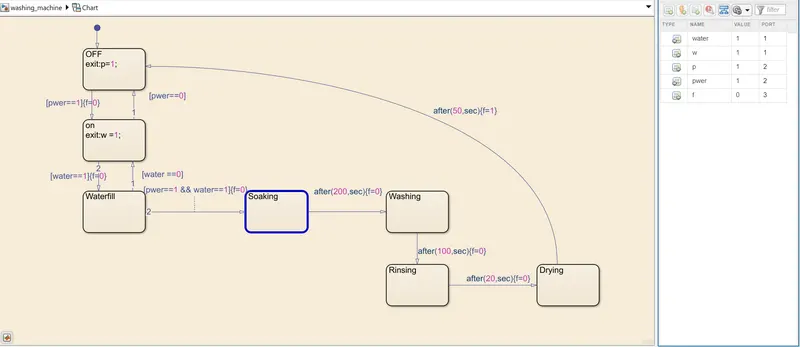
- After 200 seconds of 'Soaking' operation, the process will move to the next state of 'Washing'. Below is the snippet -
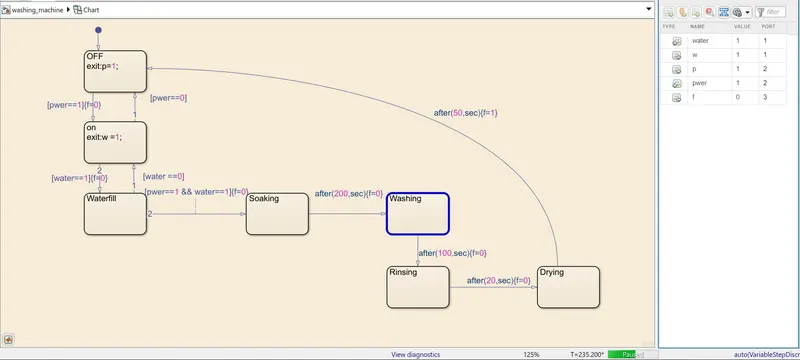
- After 100 seconds of 'Washing' operation, the process will move to the next state of 'Rinsing'. Below is the snippet -
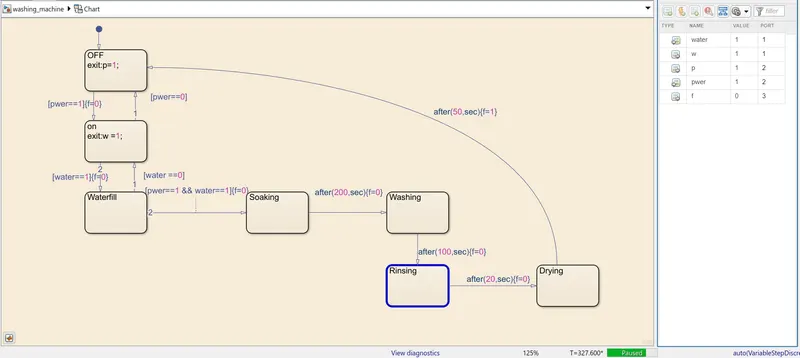
- After 20 seconds of 'Rinsing' operation, the process will move to the next state of 'Drying'. Below is the snippet -
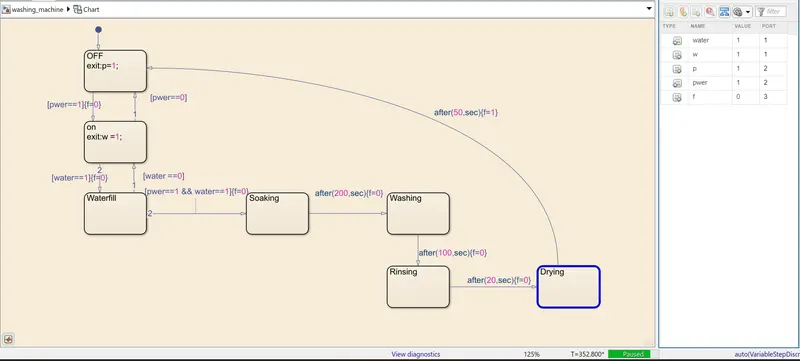
- After 50 seconds of 'Drying' operation, the process will move to 'OFF' state and all the operations will be finished. We have also defined actions as {f=1} which signifies end of all operations and glow Red LED. Below is the snippet -
- In all the operations, we have defined action {f=0} which signifies that the operations are in process and glows Green LED till the end of 'Drying' operation.
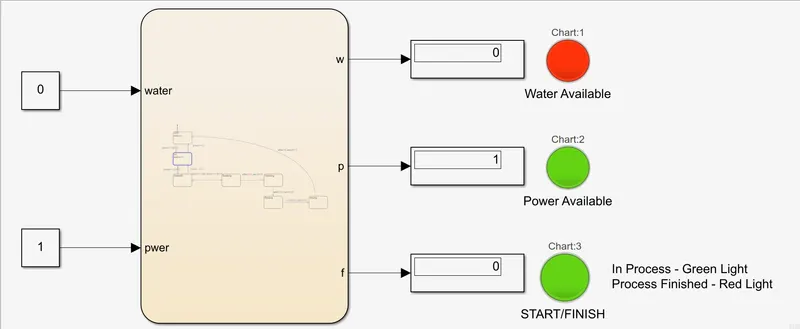
- Lets say, we dont have water supply available but power supply is available at the input side, then the process will not move ahead of the 'ON' state and 'Water Available LED' will glow red. Below is the snippet -
#PART 2 - SIMULINK CHART FOR 'GEAR SHIFT' LOGIC
AIM -
Make a Simulink chart for the “Gear shift” logic as per below conditions:
Speed Range(kmph) Gear
0 to 15 1
16 to 25 2
26 to 40 3
41 to 60 4
Above 61 5
Give speed input while the simulation is running & display the gear number.
MODEL/CHART -
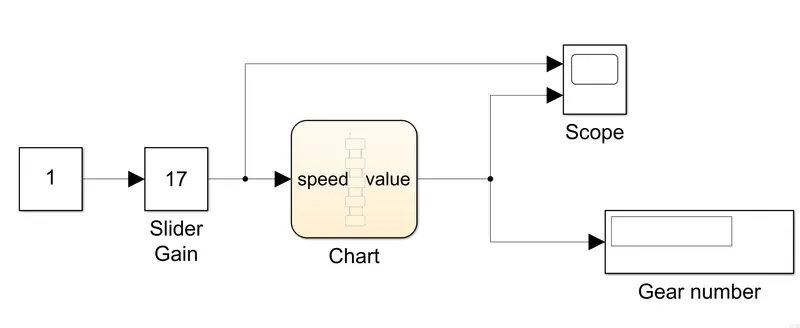
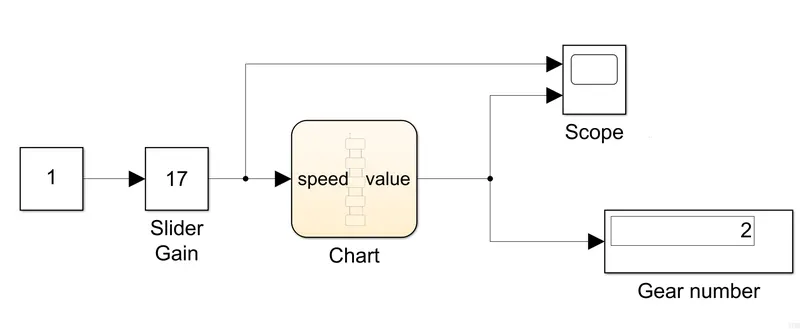
Figure 1 - Model for implementing 'Gear Shift' logic
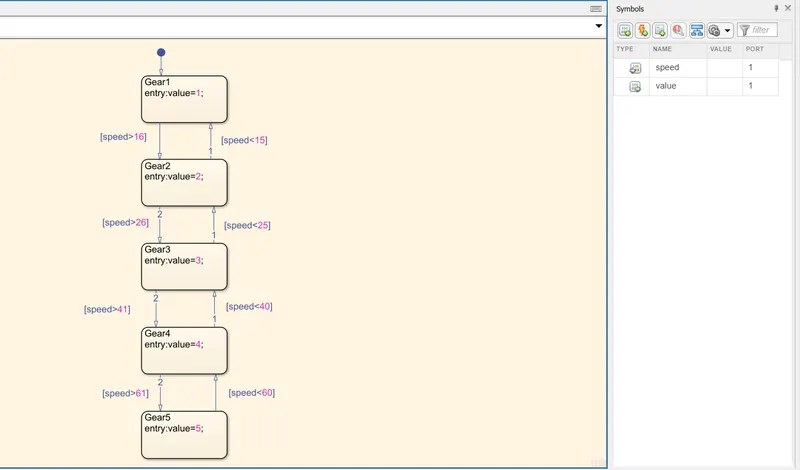
Figure 2 - Defining states for 'Gear Shift' logic
MODEL/PROCESS EXPLAINATION -
- We have defined 'value' as the output varaible and 'speed' as the input variable.We can see the same in the Symbols pane in the right hand side of above figure 2.
- In the chart block,we have defined 5 states as 5 gears for the simplicity. For 1st state, which is Gear1 we have defined output value of 1 which means if the speed is within 0 to 15 kmph then the process will be in 1st state and 1 will be displayed at the Display block at output.If the speed is above 16 kmph, the process will move to next state which is Gear2. Below is the snippet of the same -
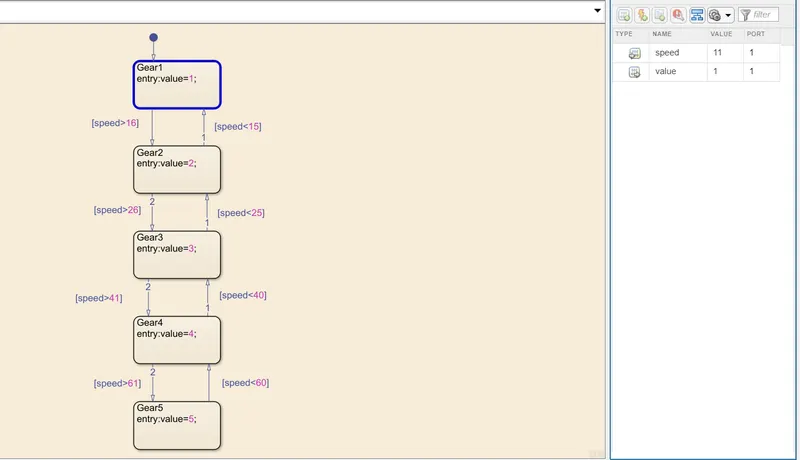
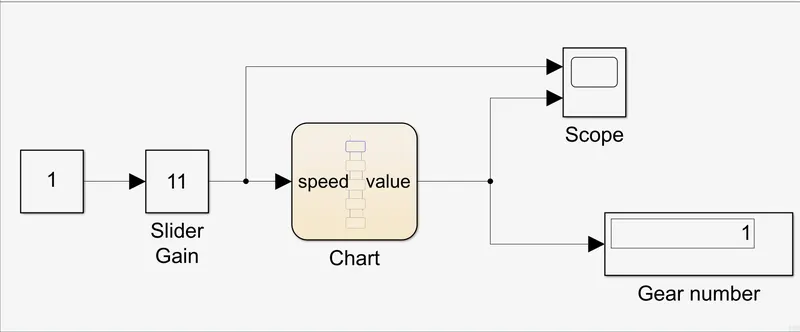
- If the speed is greater than 16 kmph and less than 25 kmph then, the process will be in 2nd state or Gear2 which will display 2 at the Display block at the output.If the speed is above 26 kmph then the process will move to next state of Gear3. Below is the snippet -
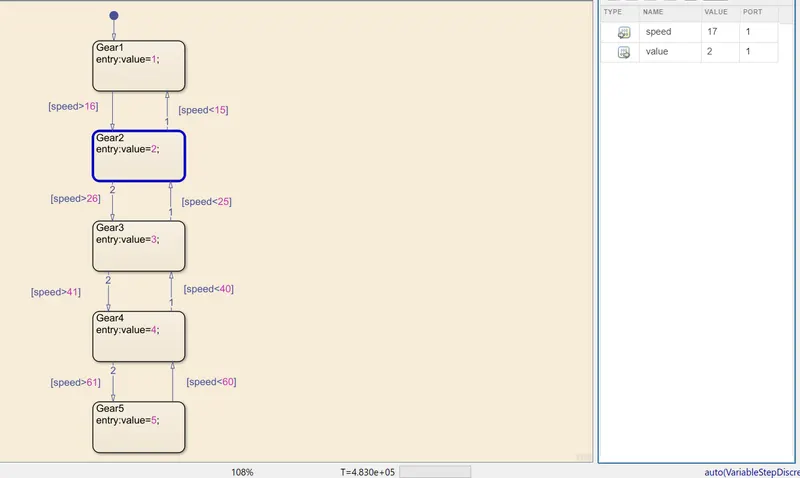
- If the speed is greater than 26 kmph and less than 40 kmph then, the process will be in 3rd state or Gear3 which will display 3 at the Display block at the output.
- For 4th state, if the speed is above 41 kmph and less than 60 kmph then process will be in Gear4 and 4 will be displayed at the Display block at ouptut.
- For 5th state, if the speed is above 61 kmph then process will be in Gear5 and 5 will be displayed at the Display block at output.
- In the model, at the input side we have connected Slider gain block where we can input multiples values with the help of slider and at the output side we have connected Scope to observe change of gear with respect to change in speed and Display block to display gear number at mentioned speed.
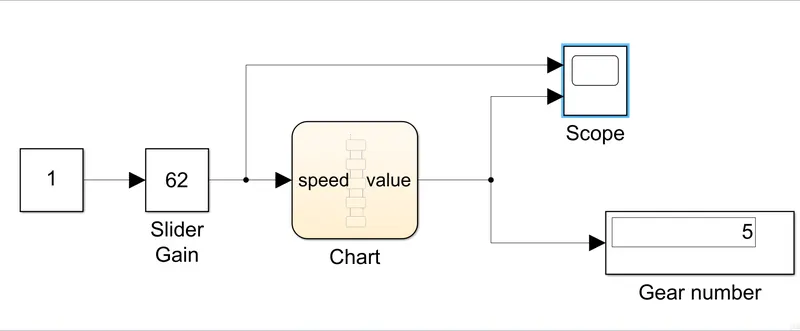
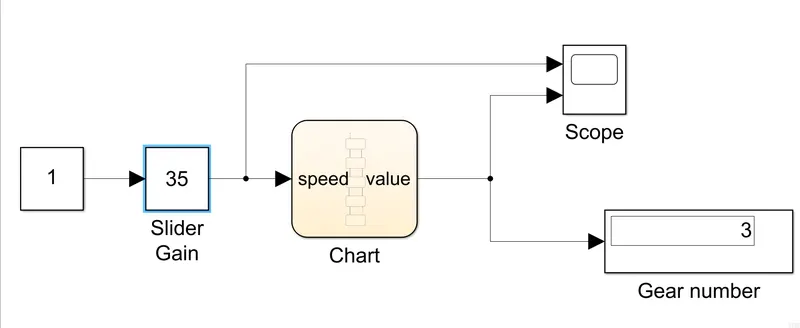
- Below are the results for different speeds -
- When speed is 62 kmph -
- When speed is 35 kmph -
- When speed is 62 kmph -
- When speed is 51 kmph -
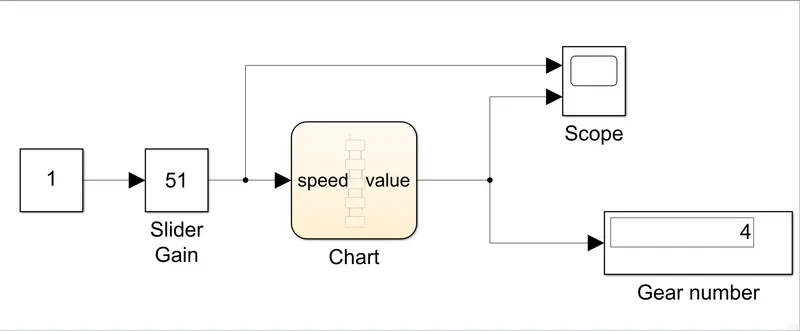
- A simulation video is also attached below for reference.
SCOPE RESULTS -
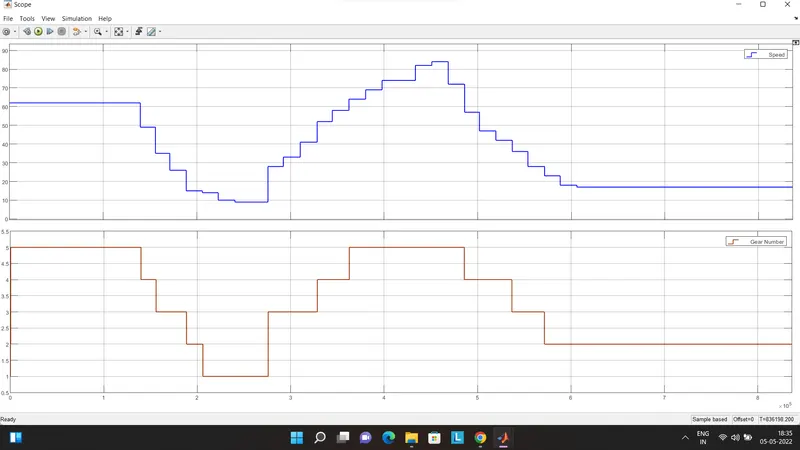
Figure 3 - Change of Gear with change in speed.
REFERENCES -
- Video Lectures
- Help section of Matlab/Simulink