Project 1 - Parsing NASA thermodynamic data
We AIM -
1. To write a function that extracts the 14 co-efficients and calculates the enthalpy, entropy and specific heats for all the species in the data file. The formulae are shown below.
Here R is the universal gas constant, T is the temeprature
The FIRST 7 coefficients are HIGH-temperature coefficients and the SECOND 7 coefficients are LOW-temperature coefficients.
Using the LOCAL TEMPERATURE RANGES which is unique for each individual species, we need to calculate the above values.
2. To calculate the molecular weight of each species and display it in the command window.
3. To plot the Cp, Enthalpy and Entropy for the local temperature range (low temperature : high temperature) specific for each species.
4. To save the plots as images with appropriate names and dump them in separate folders for each species with suitable name.
CODE/PROGRAM -
clear all
close all
clc

%Opening the file and reading the data
f1 = fopen('THERMO.dat','r')
fgetl(f1);

%Reading and recording the global temp
global_temp = fgetl(f1);
A = strsplit(global_temp, '  ')
global_low_temp = str2num(A{2});
global_mid_temp = str2num(A{3});
global_high_temp = str2num(A{4});

% Skipping the comment lines
fgetl(f1);
fgetl(f1);
fgetl(f1);

%Getting information for the species
%Creating for loop for the 53 species
for i =1:53;
species_info = fgetl(f1);
B = strsplit(species_info, ' ')
species_name = B{1};
z = length(B);

%Recording local temperatures
local_low_temp = str2num(B{z-3});
local_high_temp = str2num(B{z-2});
local_mid_temp = str2num(B{z-1});

%Reading 1st line of the coefficients
species_coeff_line1 = fgetl(f1);
a = findstr(species_coeff_line1, 'E');
a1h = str2num(species_coeff_line1(1:a(1)+3));
a2h = str2num(species_coeff_line1(a(1)+4:a(2)+3));
a3h = str2num(species_coeff_line1(a(2)+4:a(3)+3));
a4h = str2num(species_coeff_line1(a(3)+4:a(4)+3));
a5h = str2num(species_coeff_line1(a(4)+4:a(5)+3));

%Reading 2nd line of the coefficients
species_coeff_line2 = fgetl(f1);
b = findstr(species_coeff_line2, 'E');
a6h = str2num(species_coeff_line2(1:b(1)+3));
a7h = str2num(species_coeff_line2(b(1)+4:b(2)+3));
a8l = str2num(species_coeff_line2(b(2)+4:b(3)+3));
a9l = str2num(species_coeff_line2(b(3)+4:b(4)+3));
a10l = str2num(species_coeff_line2(b(4)+4:b(5)+3));

%Reading 3rd line of the coefficients
species_coeff_line3 = fgetl(f1);
c = findstr(species_coeff_line3, 'E');
a11l = str2num(species_coeff_line3(1:c(1)+3));
a12l = str2num(species_coeff_line3(c(1)+4:c(2)+3));
a13l = str2num(species_coeff_line3(c(2)+4:c(3)+3));
a14l = str2num(species_coeff_line3(c(3)+4:c(4)+3));

%Creating local temperature ranges
T = linspace(local_low_temp,local_high_temp,1000);

%R -Characterisitc Gas Constant R = 8.314
R = 8.314;
if (T<=local_mid_temp)
  Cp = (a8l+(a9l*T)+(a10l*T.^2)+(a11l*T.^3)+(a12l*T.^4))*R;
  H = (a8l +((a9l*T)/2)+((a10l*(T.^2))/3)+((a11l*(T.^3))/4)+((a12l*(T.^4))/5)+(a13l./T))*R.*T;
  S = ((a8l*log(T))+(a9l*T)+(a10l*((T.^2)/2))+(a11l*((T.^3)/3))+(a12l*((T.^4)/4))+(a14l))*R;

else
  Cp = (a1h+(a2h*T)+(a3h*T.^2)+(a4h*T.^3)+(a5h*T.^4))*R;
  H = (a1h+((a2h*T)/2)+((a3h*(T.^2))/3)+((a4h*(T.^3))/4)+((a5h*(T.^4))/5)+(a6h./T))*R.*T;
  S = ((a1h*log(T))+(a2h*T)+(a3h*((T.^2)/2))+(a4h*((T.^3)/3))+(a5h*((T.^4)/4))+a7h)*R;
end

%Creating folder by species name and then using 'cd' command saving figures
mkdir(species_name)
cd(species_name)

%Plotting
figure(1)
plot(T,Cp,'linewidth',3)
grid on
title(species_name)
xlabel('Temperature')
ylabel('Specific Heat')

figure(2)
plot(T,H,'linewidth',3)
grid on
title(species_name)
xlabel('Temperature')
ylabel('Enthalpy')

figure(3)
plot(T,S,'linewidth',3)
grid on
title(species_name)
xlabel('Temperature')
ylabel('Entropy')

saveas(1,'Specific heat','jpg')
saveas(2,'Enthaply','jpg')
saveas(3,'Entropy','jpg')
cd ..

% Molecular mass calculation
elements =['H','C','O','N','A'];
atomic_weight = [1.008 12.011 15.999 14.007 39.948];
mol_mass=0;
for i = 1:length(species_name)
      for j = 1:length(atomic_weight)
          if strcmp(species_name(i),elements(j))
              mol_mass = mol_mass+atomic_weight(j)
              position =j;
          end
      end
      n= str2double(species_name(i));
      if n >1
          mol_mass =mol_mass + atomic_weight(position)*(n-1);

      end
end
sprintf('Moleclar Weight of %s:%f u', species_name,mol_mass)
end

fclose(f1)
Code 1
CODE EXPLAINATION -
- We have started our code with clear all, close all, clc which clears all the previous data, close all the open charts or plots and clears the workspace window data.
- We have used fopen command to open the file 'THERMO.dat' and since we want read the data in the file, we have set the permission as read 'r'. We have assigned this to a variabel f1.
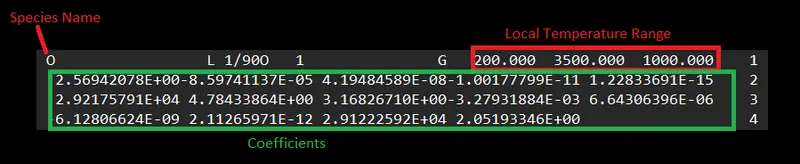
- We are using fgetl(f1) command to access the 1st line of the file which is the name of the file. Again we are using fgetl(f1) to access the second line which gives us the global temperature range. See snippet below.
- Now the third,forth and the fifth line are comments are not required for the calculations.
- Now using string split command 'strsplit' we are splitting the string into array of strings from a single string and assigning it to variable A.
- Now since we need numbers for our calculations, we have converted the strings into numbers by using 'str2num' command. We have saved the global temperatures in variable global_low_temp, global_mid_temp and global_high_temp respectively. The next three lines which are only comments can be skipped as shown in above snippet
- Now are extracting data specific to the species.Below is the snippet to give the overview of the data to be read
- We have sepcies name, local temperature range and coefficients to be extracted from the file.Refer Code 1
- Since we have 53 species data to be read, so we have set the number iteration for the for loop to be 53.
- There are 14 coefficeints to be read, out of which 1st seven are high temperature coefficients and 2nd seven are low temperature coefficients. So naming of the coefficients is done accordingly, eg - a1h (1st high temp coefficient),a8l(8th low temp coefficient)
- We have read the coefficient based on the position of 'E' and using 'findstr' find string command. Using str2num command, we have converted all the string coefficients to numbers.
- After recording all the coefficients, we are now defining an array of local temperature (T) specific to the respective species using 'linspace' command. We have taken the value of gas constant (R) - 8.314 J/mol-K.
- We have to now calculate Cp,H and S. The formula for calculations are as below -
- We have put a 'if else'conditions in which if the temp (T) is above the Local mid temperature then the calculation should happen based on high temperature coefficients and if the (T) is below Local mid temperature then the calculation should happen based on low temperature coefficients.
- Now we before plotting, we are creating a directory/folder for saving all the plots by using 'mkdir' and 'cd' command. Here 'mkdir(species_name)' command is creating a folder having the species name and the 'cd(species_name) will open the species folder and save the plots in the folder.
- Using plot command we are plotting the Specific heat, Enthalpy and Entropy plots by giving proper labels and tiltles and saving all the polts in 'jpg' format.
- For molecular weight calculation we have selected elements like Hydrogen (H), Carbon (C), Monoatomic Oxygen (O), Nitrogen (N) and Argon (A) which are common between all the species mentioned in the file and defined all these elements into an array.
- We have also defined the atomic weights of the above elements into an array sequentially as mentioned above.
- To start with we have considered the intial molecular mass to be zero and then defined 1st 'for' loop where it will access every species in sequential manner. In the 2nd 'for' loop we are accessing the atomic weights of the elements which we have defined.
- We are then comparing the element of the species name from 1st loop and the elements atomic weight from the 2nd loop whether they are same using 'strcmp' command. If the condition is satisfied then molecular mass for that element is getting calculated. Now places where elements/molecules are more than one in number (eg O2, H3), we have defined different set of conditon for them. See Code 1.
- Using 'sprintf' command we are printing the Molecular weights of all the species in the command window.
- Finally, we are using 'fclose' command to close the file.

OUTPUT WINDOW AFTER RUNNING CODE-
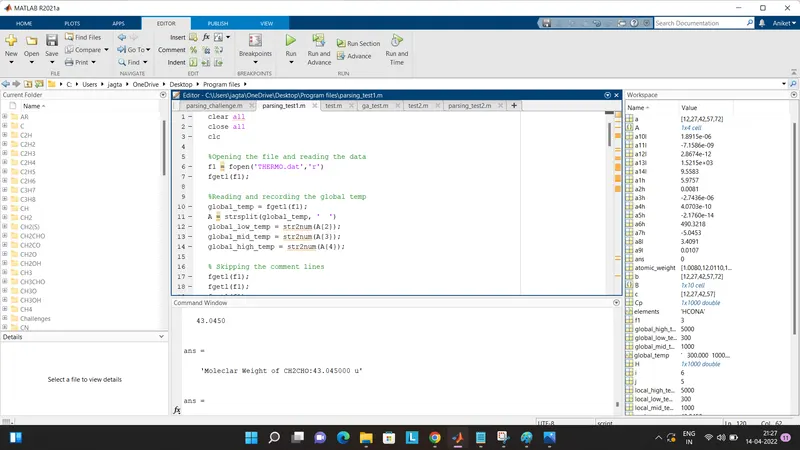
MOLECULAR WEIGHTS DISPLAYED IN COMMAND WINDOW -
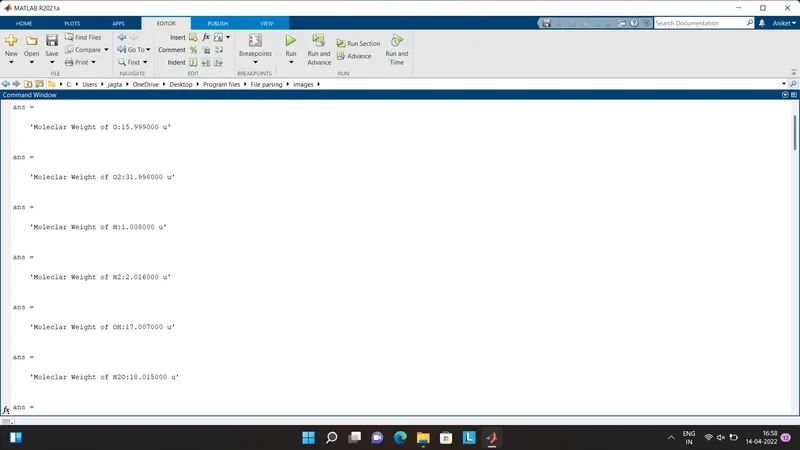
Figure a - Molecular weights of O,O2,H,H2,OH,H20
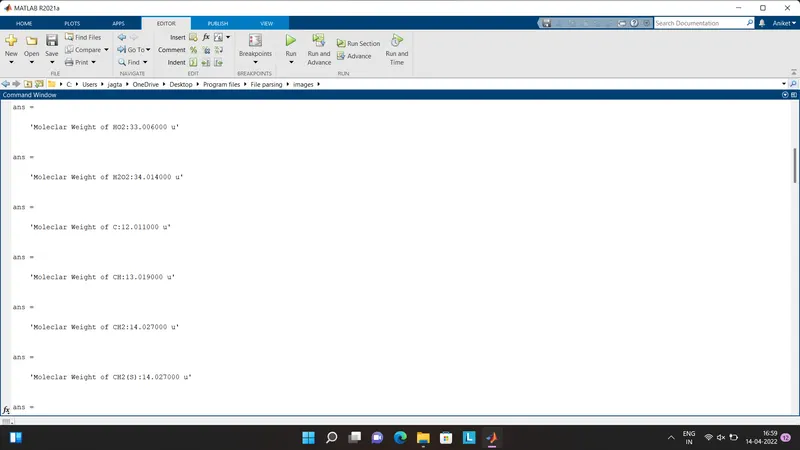
Figure b - Molecular weights of HO2,H2O2,C,CH,CH2,CH2(S)
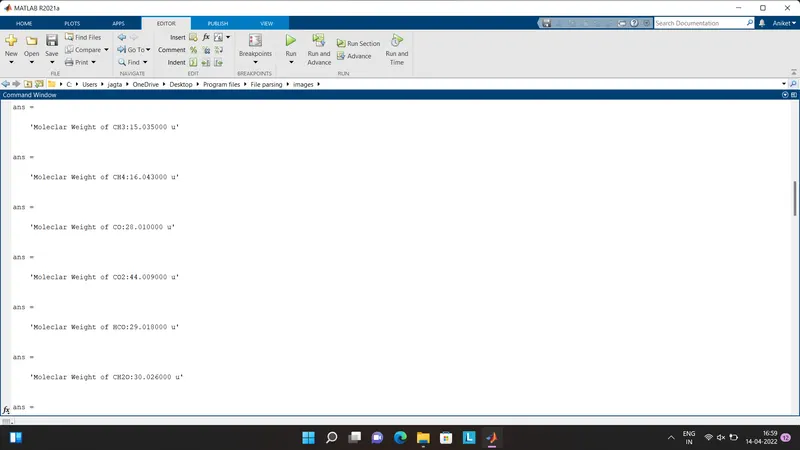
Figure c - Molecular weights of CH3,CH4,CO,CO2,HCO,CH20
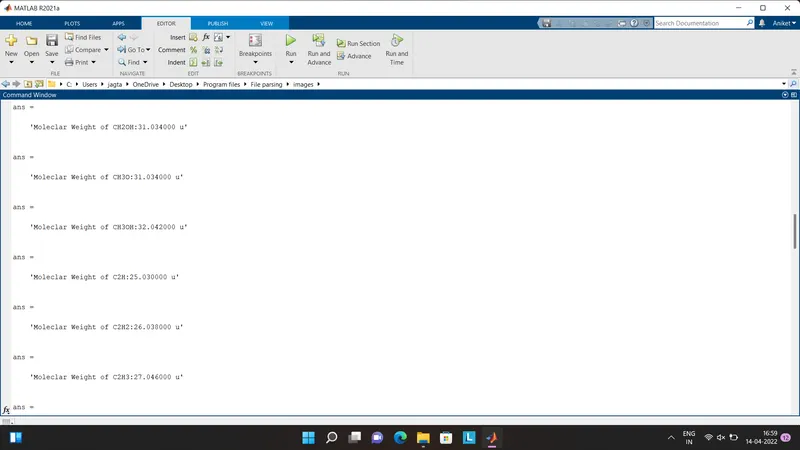
Figure d- Molecular weights of CH2OH,CH3O,CH3OH,C2H,C2H2,C2H3
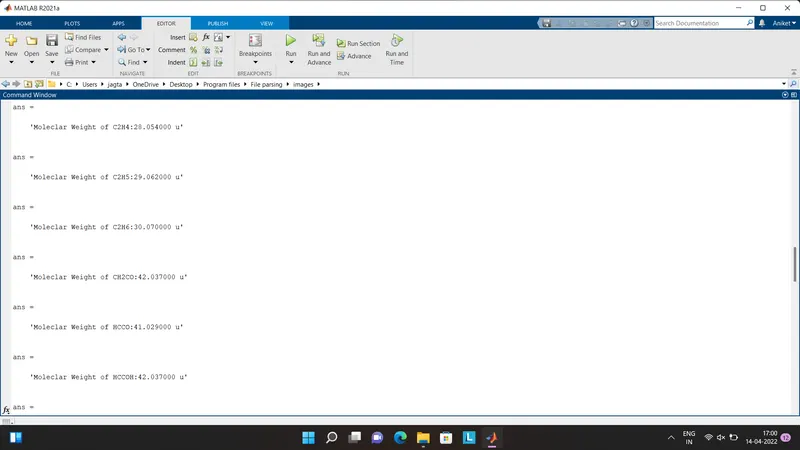
Figure e - Molecular weights of C2H4,C2H5,C2H6,CH2CO,HCCO,HCCOH
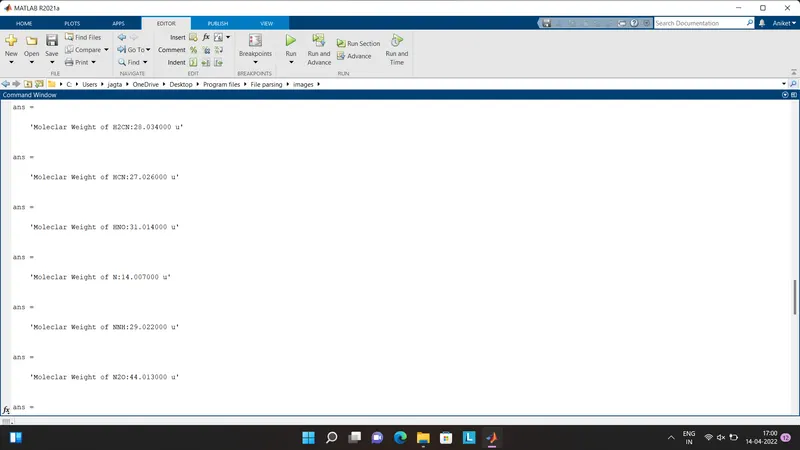
Figure f - Molecular weights of H2CN,HCN,HNO,N,NNH,N2O
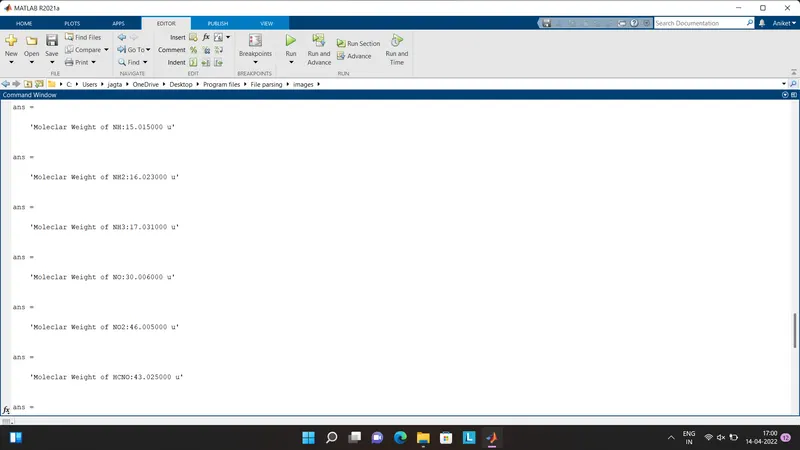
Figure g- Molecular weights of NH,NH2,NH3,NO,NO2,HCNO
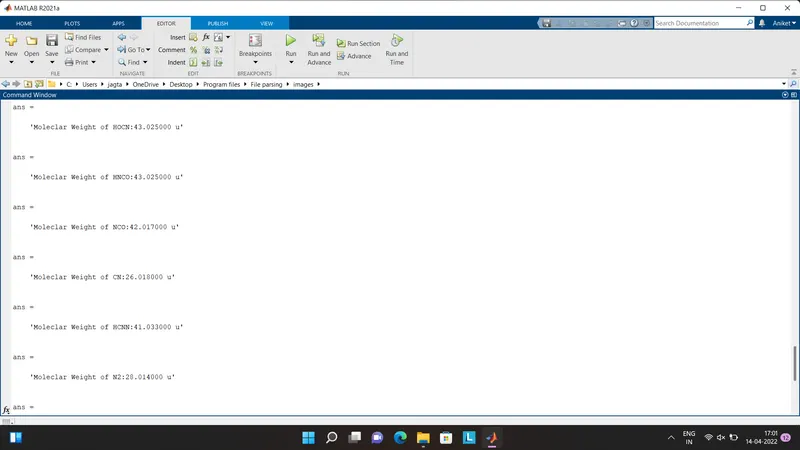
Figure h - Molecular weights of HOCN,HNCO,NCO,CN,HCNN,N2
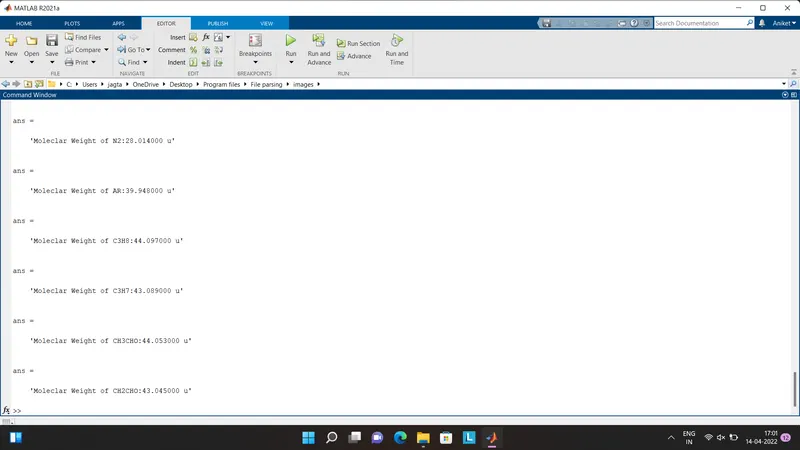
Figure i - Molecular weights of AR,C3H8,C3H7,CH3CHO,CH2CHO
FOLDER SCREENSHOT WHERE ALL THE SPECIES FILE GOT CREATED -

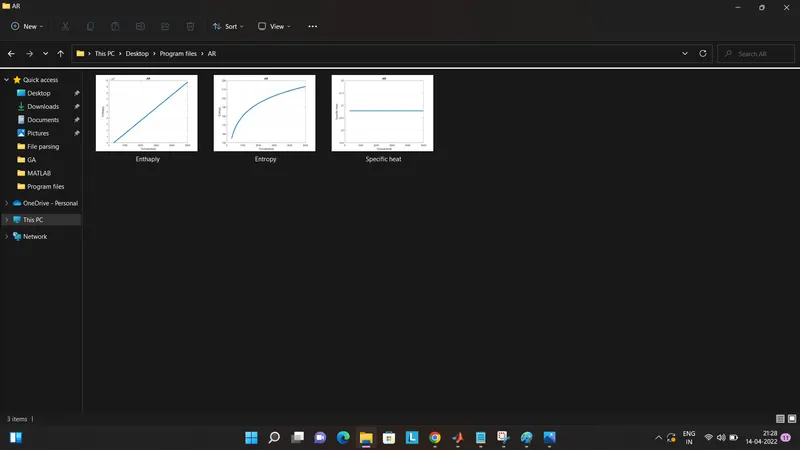
Figure j - Inside species AR folder. Plots for Enthalpy, Entropy and Specific heat.
PLOTS FOR O2,N2 AND CO2 SPECIES -
- Plots for O2
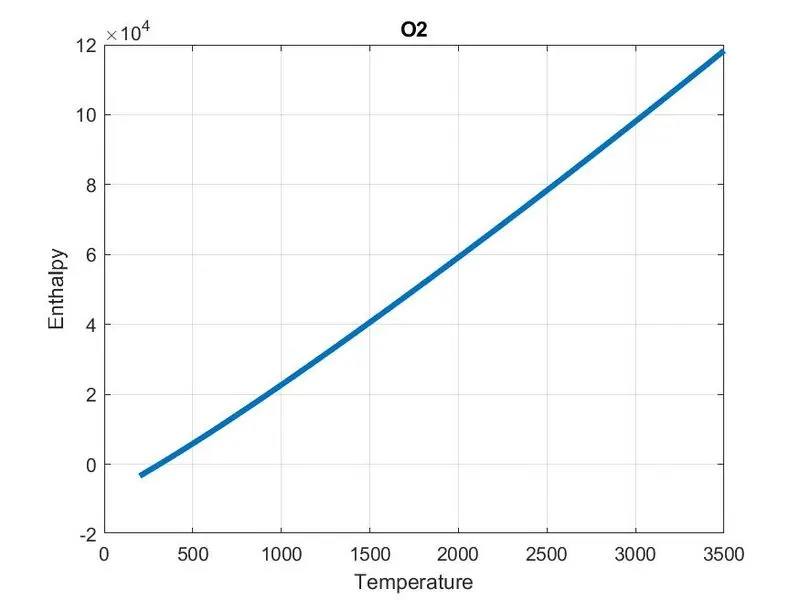
Figure k - Temperature vs Enthalpy for O2
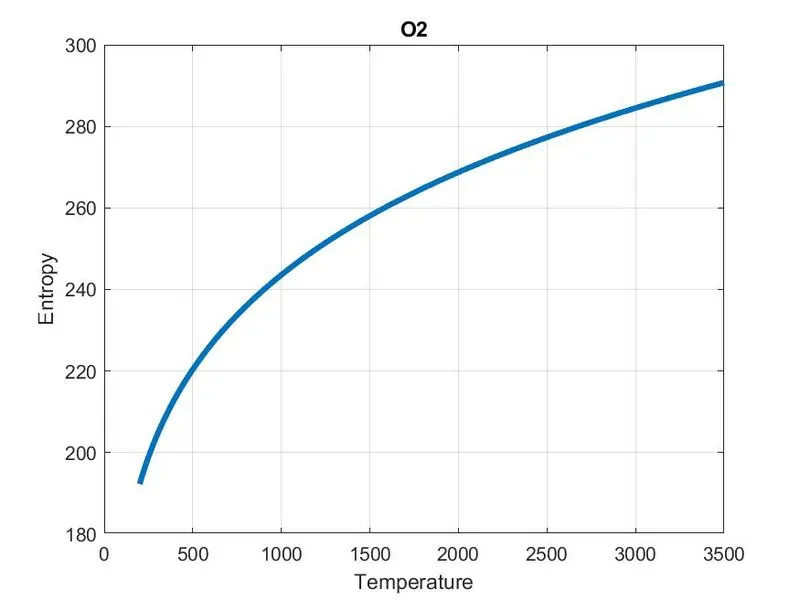
Figure l - Temperature vs Entropy for O2
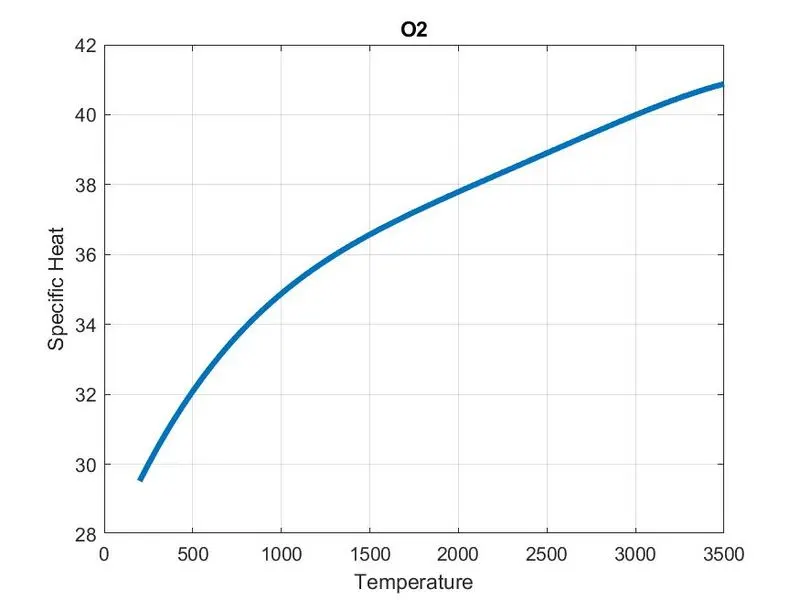
Figure m - Temperature vs Specific heat for O2
- Plots for N2
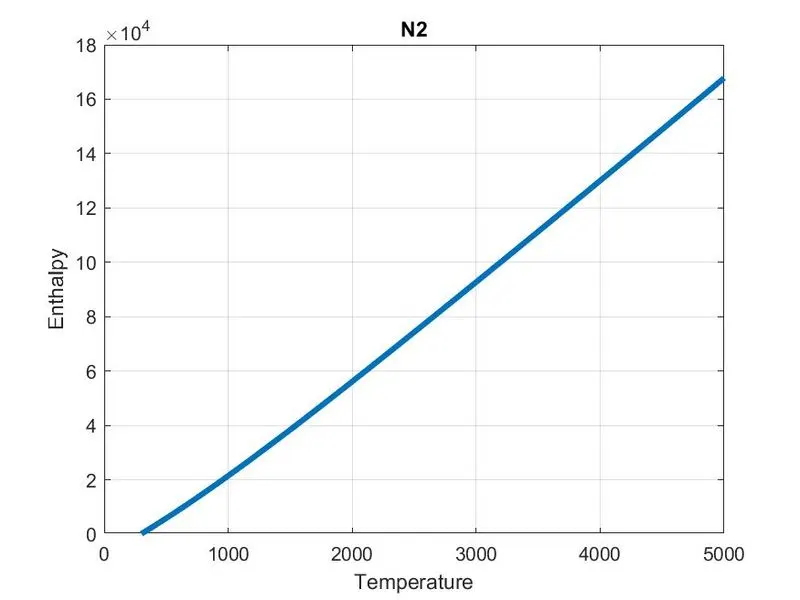
Figure n - Temperature vs Enthalpy for N2
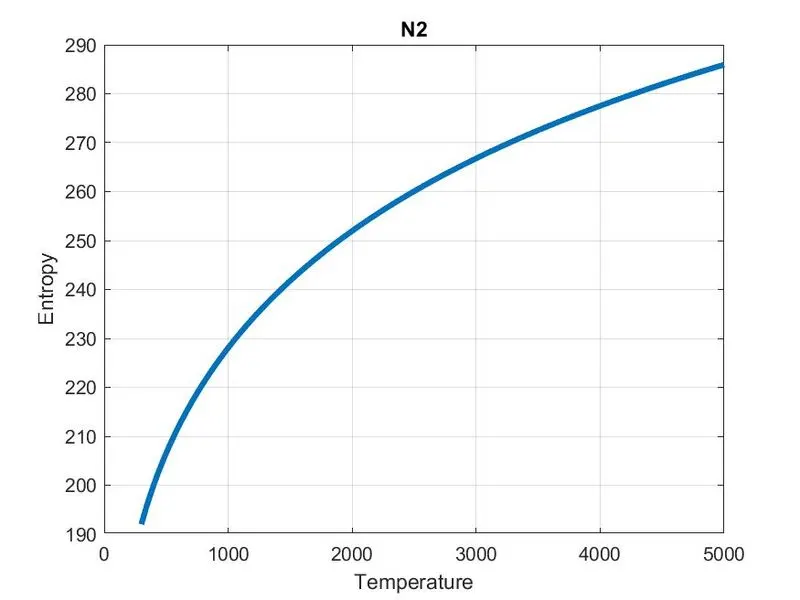
Figure o - Temperature vs Entropy for N2
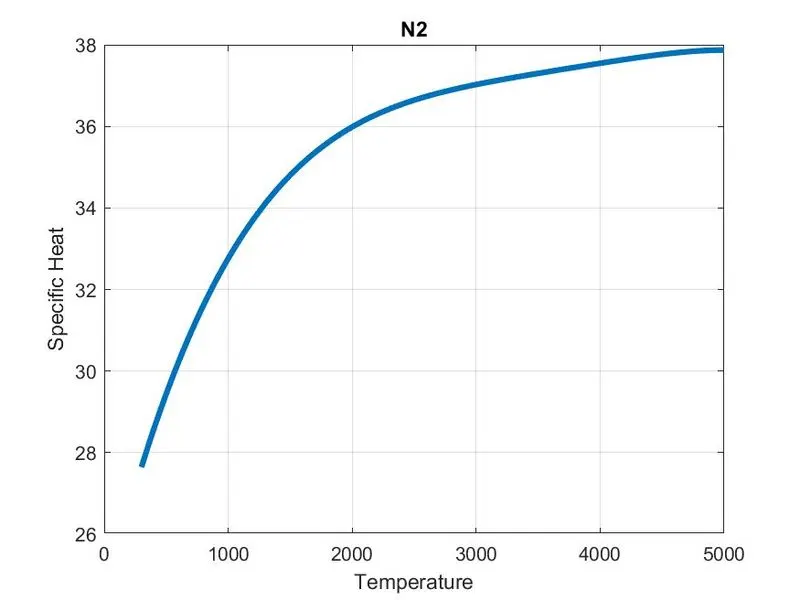
Figure p - Temperature vs Specific heat for N2
- Plots for CO2
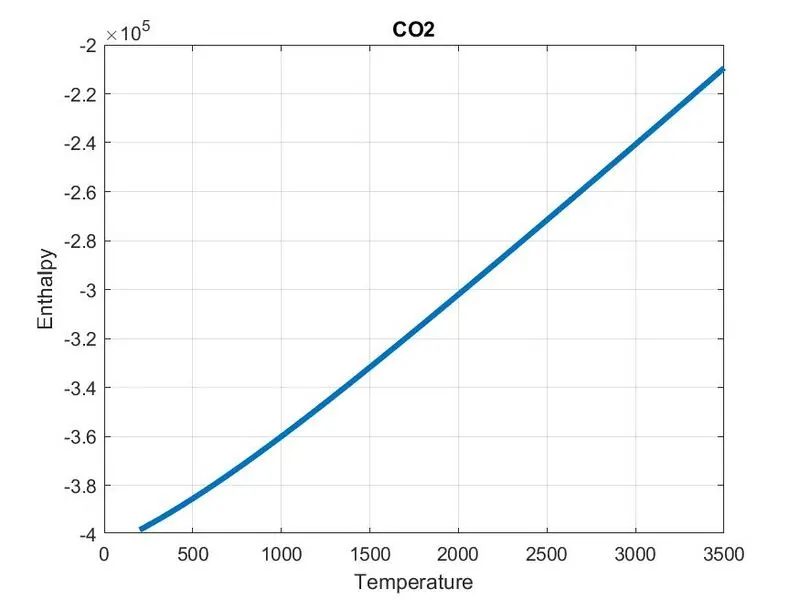
Figure q - Temperature vs Enthalpy for CO2
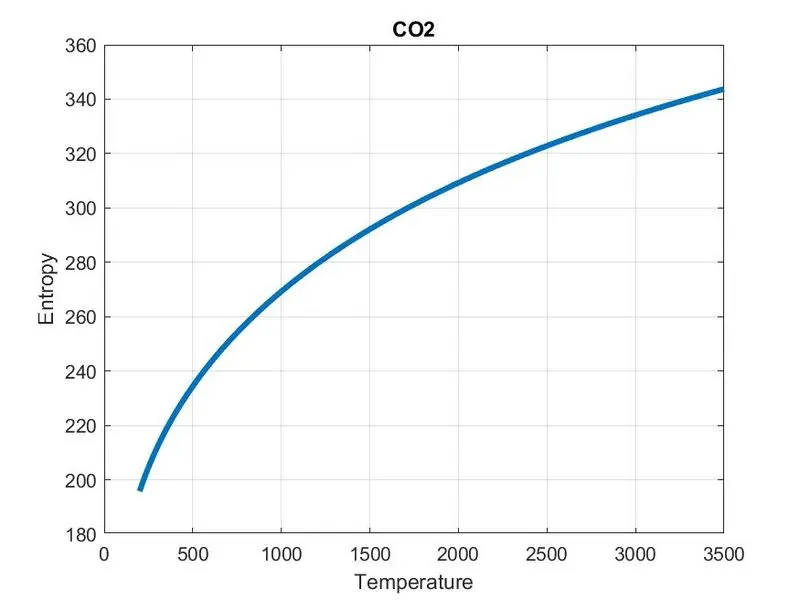
Figure r - Temperature vs Entropy for CO2
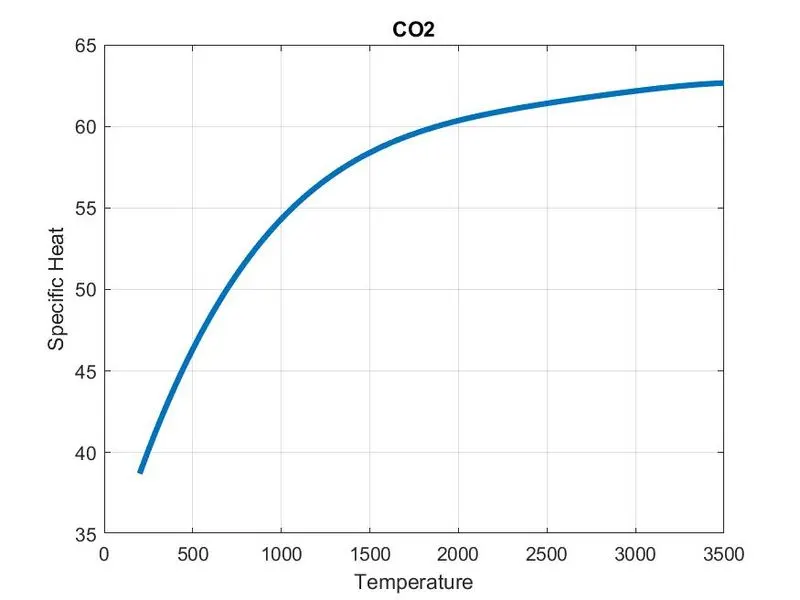
Figure s - Temperature vs Specific Heat for CO2
ERRORS AND SOLUTIONS -
ERROR 1 - Error using / (Matrix dimensions must agree)
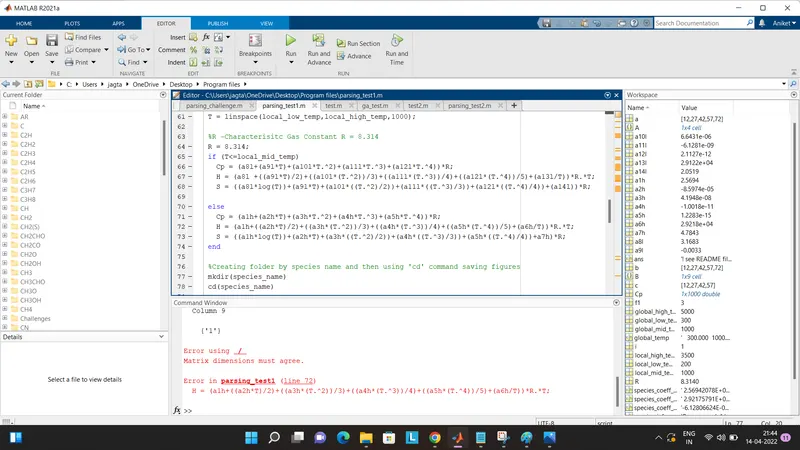
Solution - Appropriate dot operator was provided in line no.67 and line no.72
Error 2 - Use of Parantheses
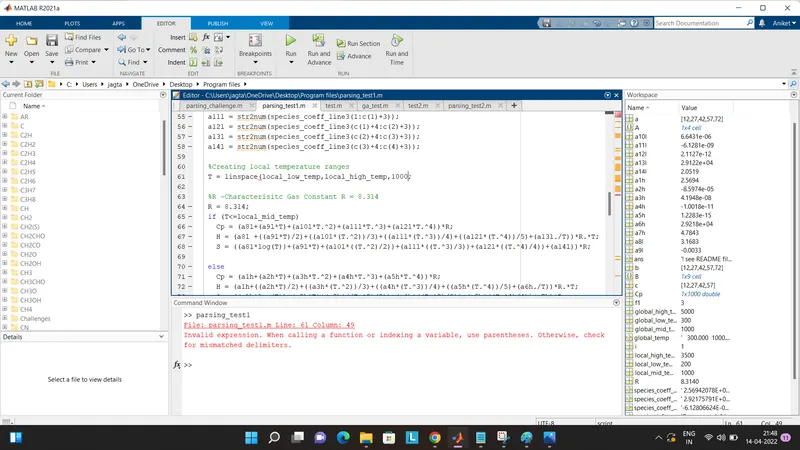
Solution - Parantheses were provided
REFERENCES -
- Matlab Documentation in the help section for mkdir and cd command .
- Lecture videos.