Week - 4
CONTROL LOGIC FOR WASHING MACHINE USING STATEFLOW :
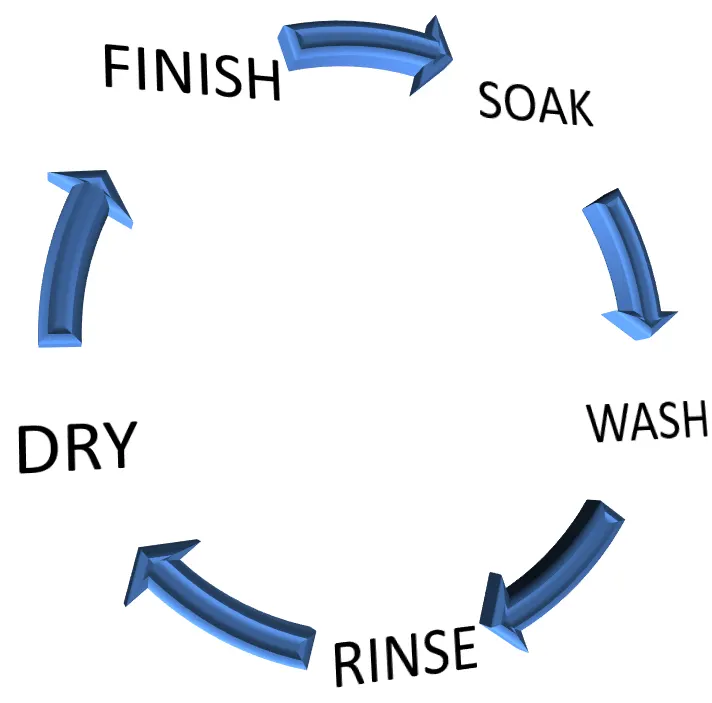
A washing machine has these major process cycles for proper functioning of machine.
1. Clothes are soaked with water finside the drum for certain specified amount of time with a constant discharge
2. Washing is a process followed by spinning the drum in both directions using soap detergent with a specific amount of time specified
3. Then rinsing is done by spinning with clean water back and forth with a specified time set for this process
4. Drying of clothes is done by spinning the drum with no water and increased drum temperature for better water absorption with a specified time set for this process.
5. Process is set to reach finish state after dry state is complete and drum comes to rest.
STATEFLOW :
A finite state machine is a representation of an event-driven (reactive) system. In an event-driven system, the system responds to an event by making a transition from one state (mode) to another. This transition occurs if the condition defining the change is trueStateflow is a control logic tool used to model reactive systems via state machines and flow charts within a Simulink model.
Our state machine in this example is Washing Machine
Simulation conditions :
- If the power supply is available, the system gets activated
- If the Water supply is not available, stop the process & indicate through LED
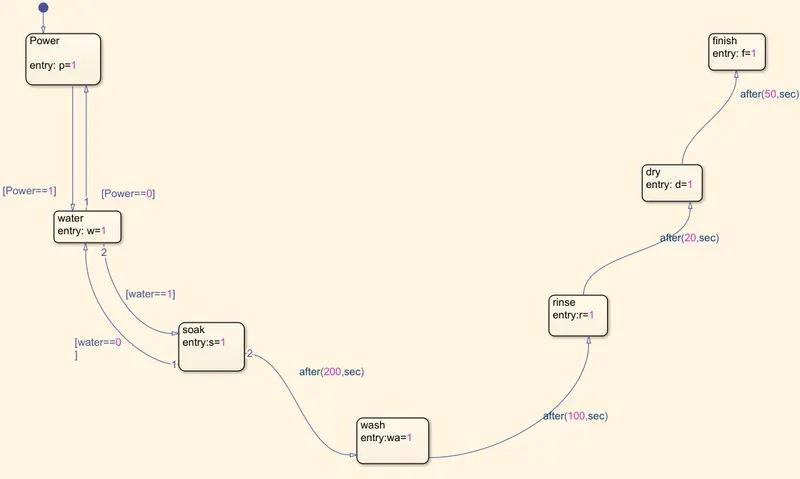
- Soaking time should be 200s followed by Washing time of 100s.
- Then rinsing happens for next 20s & dryer runs for 50s
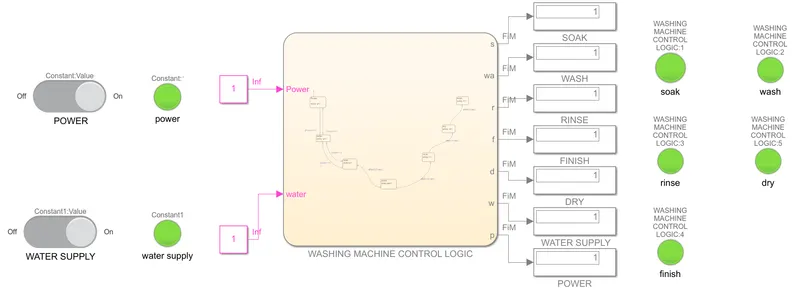
SIMULINK MODEL OF WASHING MACHINE CONTROL LOGIC :
Stateflow Chart :
Procedures :
1. Logic / Algorithm can be built using a block named Chart Block. These block can be used to control a physical plant in response to events such as a temperature and pressure sensors, clocks, and user-driven events. A Stateflow chart can use MATLAB or C as the action language to implement control logic.

2. Specific chart block name is given to make better clarification of processes invloved. Entry value is employed with a value & followed by the condition to be given with the arrow to move the process to the next state. This reamins to be the state value for next chart block if previous chart block passes the condition to enter the next chart block
3. It can also be employed with time delay condition also by using 'after(t,sec)' code
4. Each of the seven processes are assigned with symbols using symbol panes for dicretizing between input & output values
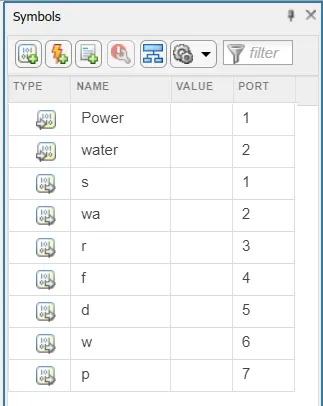
5. Input vales are assigned with a constant block depending on the state value for active state and passive state
6. Output values are connected to the display block to check whether output is ON of OFF with value being 1 or 0 respectively
7. Slider switch is employed to ON/OFF the input values. The Slider Switch block toggles the value of the connected block parameter between two values during simulation.

8. Lamp Block is used to indicate whether the process is in ON state or OFF State with conditions given inside the parametric conditions of lamp block. Colour combinations are also set respectively with the value assigned for ON / OFF State.
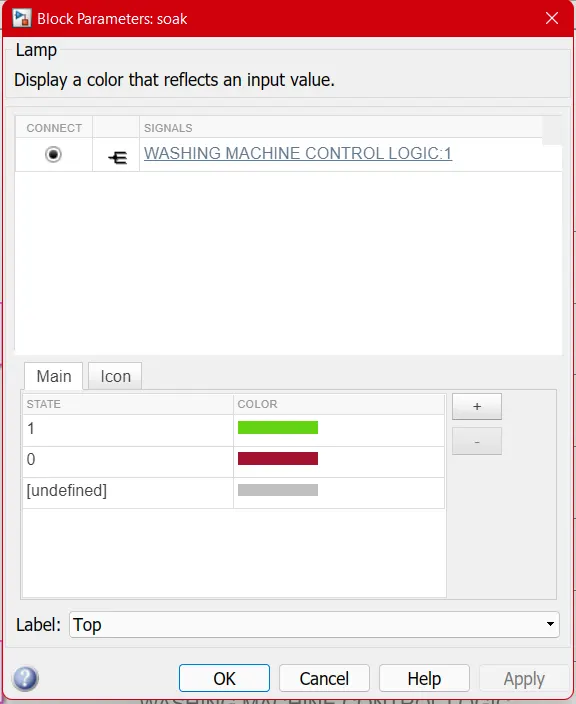
9. Simulation time is set such that the simulation time is greater than the time taken by the machine to finish the process. Simulation time is given as an input of 500 sec
RESULTS :
CASE I : Power supply is ON, Water Supply is ON, Simulation time = 500s
CASE II : Power supply is ON, Water Supply is OFF, Simulation time = 500s
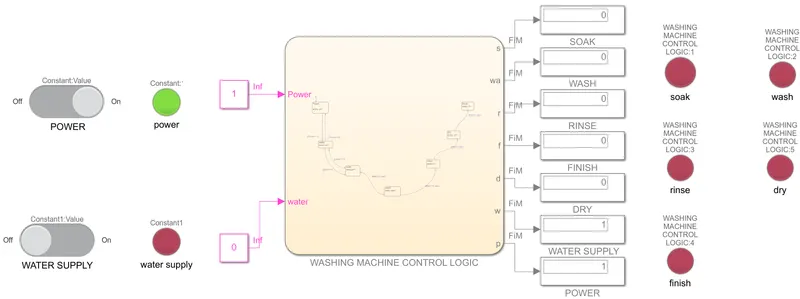
CASE III : Power supply is ON, Water Supply is ON, Simulation time = 250S
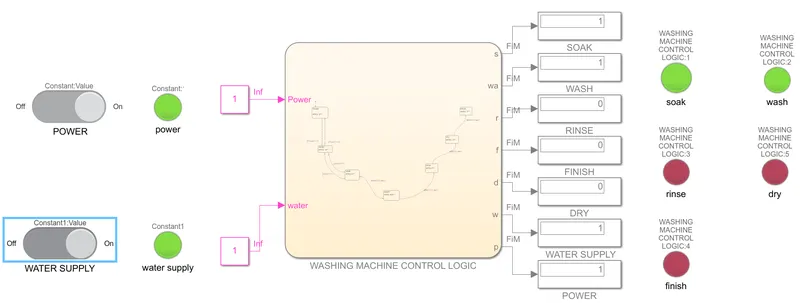
___________________________________________________________________________________________________________________________________________________________________________________________________________________________________________________________________________________________________________________________________________________________
GEAR-SHIFT USING STATEFLOW :
Simulation conditions :
Speed Range(kmph) Gear
0 to 15 1
16 to 25 2
26 to 40 3
41 to 60 4
Above 61 5
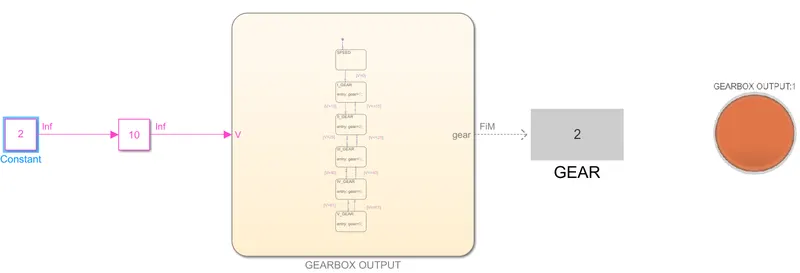
SIMULINK MODEL OF GEAR-SHIFT LOGIC :
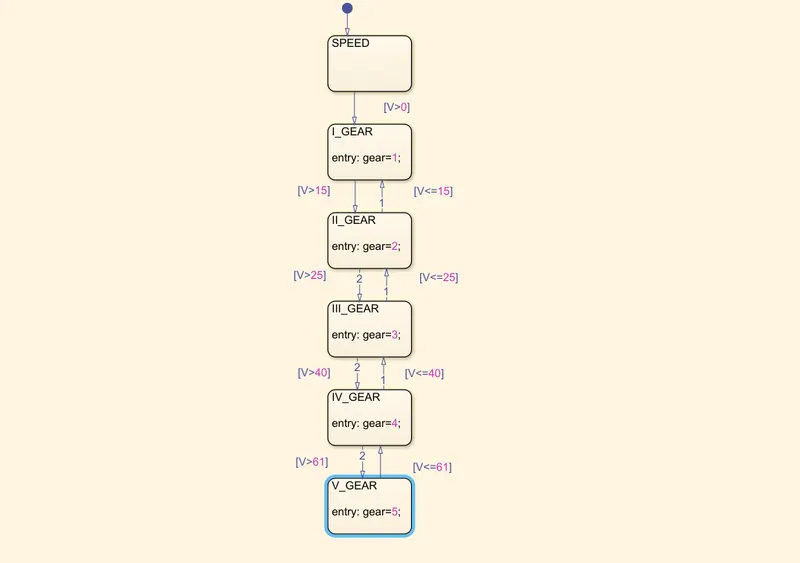
STATEFLOW CHART :
Procedures :
1. Logic / Algorithm can be built using a block named Chart Block. These block can be used to control a physical plant in response to events such as a temperature and pressure sensors, clocks, and user-driven events. A Stateflow chart can use MATLAB or C as the action language to implement control logic.
2. Specific chart block name is given to make better clarification of processes invloved. Entry value is employed with a value & followed by the condition to be given with the arrow to move the process to the next state. This reamins to be the state value for next chart block if previous chart block passes the condition to enter the next chart block
3. Speed conditions are employed each block to pass to the next block and end its state with 'V' being variable
4. Each of the six processes are assigned with symbols using symbol panes for dicretizing between input & output values
5. Input vales are assigned with a constant block depending on the state value for active state and passive state
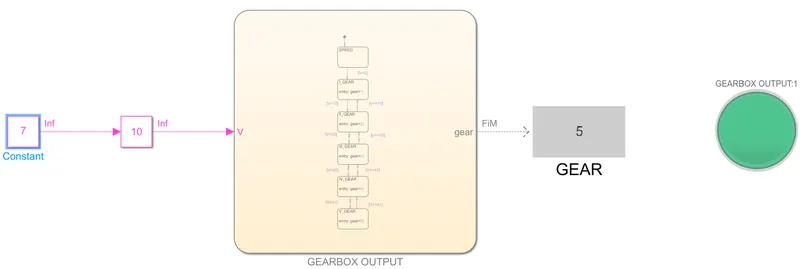
6. Output values are connected to the display block to check Gear output value
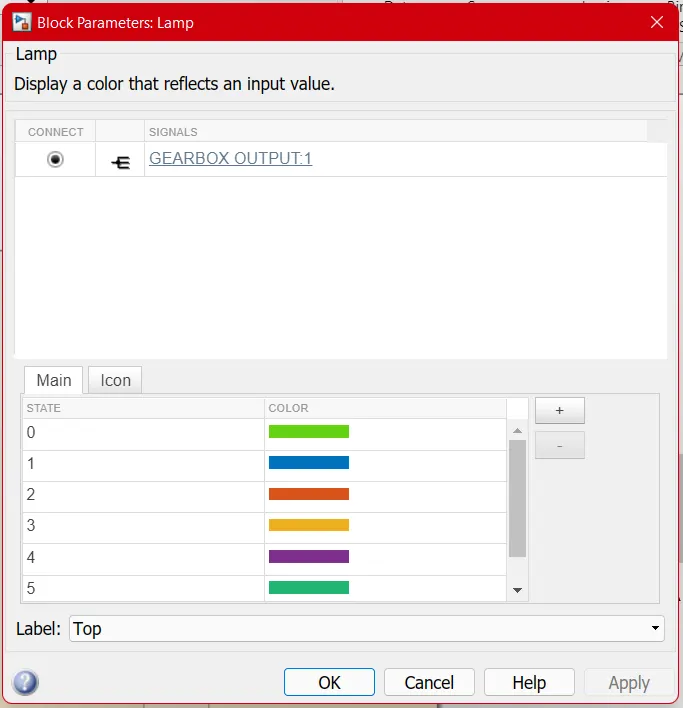
7. Lamp Block is used to indicate the colour assigned to a particular Gear. Colour combinations are also set respectively with the value assigned for gear number.
8. Slider Gain is used to vary the input during the simulation itself keeping simulation time to be infinte. But in this case a slide gain output of value 10 input speed is assigned
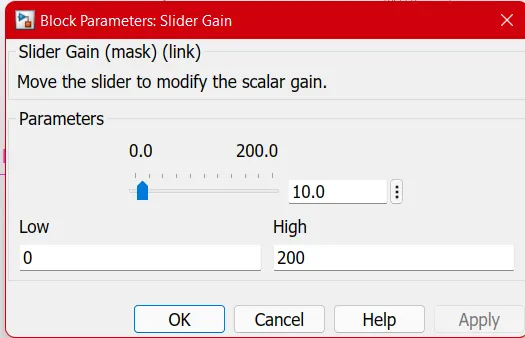
9. Constant block is assigned to slider gain as an amplification factor. Instead of using slider gain to increase speed, we can change the value of constant block to increase the speed
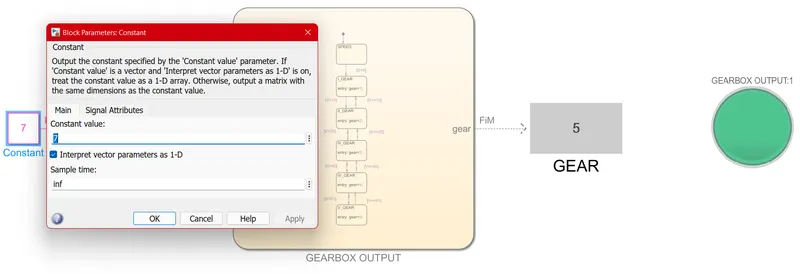
RESULTS :
CASE I : Speed = 10 kmph
Speed Range(kmph) Gear
0 to 15 1
16 to 25 2
26 to 40 3
41 to 60 4
Above 61 5
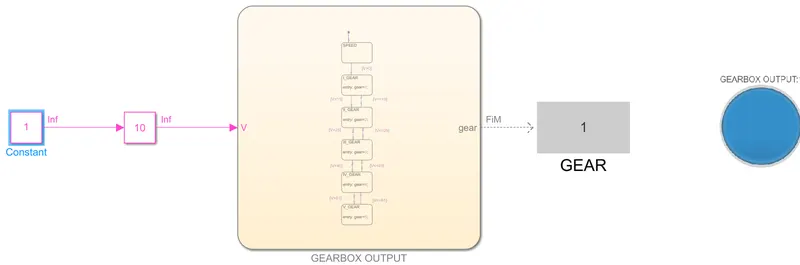
CASE II : Speed = 20 kmph
CASE III : Speed = 30 kmph
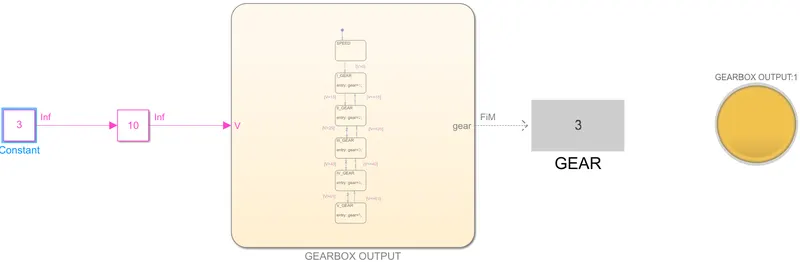
CASE IV : Speed = 30 kmph
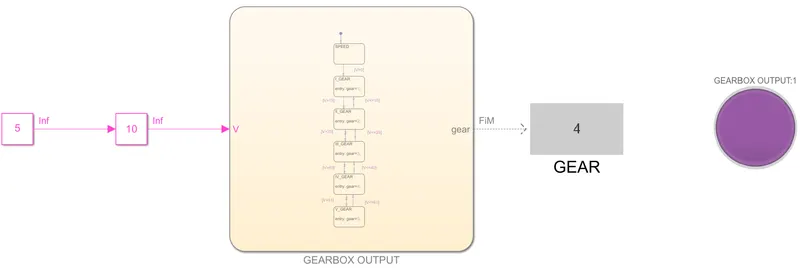
CASE V : Speed = 70 kmph