Project 1 - Parsing NASA thermodynamic data
AIM : To parse NASA thermal data, plot thermal properties vs Temperature & evaluate molecular mass of each element of thermal data.
Given Data :
Thermal Properties relationship with Temperature:

where
Cp - Specific Heat of Element
R - Universal Gas Constant = 8.314 KJ/kg mol K
H - Enthalpy
S - Entropy
T - Temperature (K)
NASA Thermal Data to be extracted & evaluated :
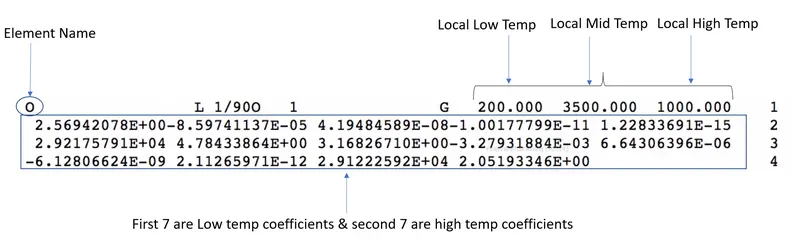
Our motive is extract these coefficients from data & evaluate thermal properties with the help of given relation & plot Thermal Properties vs Temperature graphs.
This has to performed for all 53 elements given & also molecular mass of each element/compound has to be evaluated.
Molecular Mass :
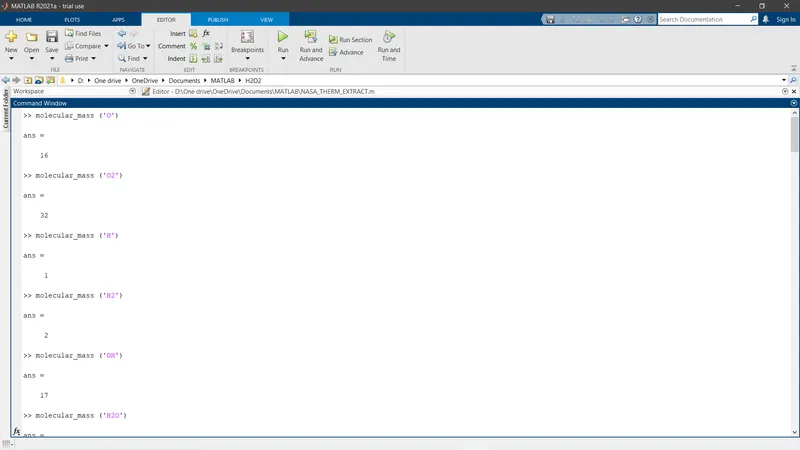
Molecular mass of an compound = (Atomic mass)*(No of Atoms in a molecule)
To perform this action, a 'for' loop is utilized
MatLab Code to extract,iterate,evaluate & plot :
close all
clear all
clc


%% Logic to read Header File...

% Defining the read file & permitting to 'read' mode...
THERM_DATA = fopen('THERMO.dat','r');

% Extracting the first line...
Header = fgetl(THERM_DATA);

%% Logic to extract Global Temperature Ranges...

% String variable gbl_temp holds the Temp range
gbl_temp = fgetl(THERM_DATA);

% Splitting the string & admitting it to each temp range using spacing between characters...
A = strsplit(gbl_temp,' ');

% Defining the Global Temperature Ranges....
gbl_low_temp = str2double(A{2});
gbl_mid_temp = str2double(A{3});
gbl_high_temp = str2double(A{4});

_______________________________________________________________________________________

% To read next 3 lines after defining Global Temperature ranges
for i = 1:3
    comment_lines = fgetl(THERM_DATA);
end


%% Logic to extract Coefficients of each species...

% To extract co-efficents of 53 Species a 'for' loop could be utilised...

for i = 1:53
  % Extracting the first line of Species data by fgetl command & storing it in the variable B...
B = fgetl(THERM_DATA);

% Logic to extract Local Temperatures of each species...
TEMP_DATA = strsplit(B,' ');

% Converting temp from strng to num & Defining Local Temperatures
local_low_temp = str2num(TEMP_DATA{end-3});
local_mid_temp = str2num(TEMP_DATA{end-1});
local_high_temp = str2num(TEMP_DATA{end-2});

% Defining temp as a variation from local_low to local_high...
local_temp_range = linspace(local_low_temp,local_high_temp,300);

% To get only the name of the element
species=TEMP_DATA{1};

% Extracting Coefficients of next three lines using fgetl from THERM_DATA
B1 = fgetl(THERM_DATA);
B2 = fgetl(THERM_DATA);
B3 = fgetl(THERM_DATA);

% Finding the position of 'E'...
b1 = strfind(B1,'E');
b2 = strfind(B2,'E');
b3 = strfind(B3,'E');

% Extracting High Temperature Coefficients
k1 = str2double(B1(1:b1(1)+3));
k2 = str2double(B1(b1(1)+4:b1(2)+3));
k3 = str2double(B1(b1(2)+4:b1(3)+3));
k4 = str2double(B1(b1(3)+4:b1(4)+3));
k5 = str2double(B1(b1(4)+4:b1(5)+3));
k6 = str2double(B2(1:b2(1)+3));
k7 = str2double(B2(b2(1)+4:b2(2)+3));

% Extracting Low Temperature Coefficients
m1 = str2double(B2(b2(2)+4:b2(3)+3));
m2 = str2double(B2(b2(3)+4:b2(4)+3));
m3 = str2double(B2(b2(4)+4:b2(5)+3));
m4 = str2double(B3(1:b3(1)+3));
m5 = str2double(B3(b3(1)+4:b3(2)+3));
m6 = str2double(B3(b3(2)+4:b3(3)+3));
m7 = str2double(B3(b3(3)+4:b3(4)+3));

%% Calling Thermal Properties Function to calculate cp,H & S ...
[cp,H,S] = thrm_prop(local_temp_range,k1,k2,k3,k4,k5,k6,k7,m1,m2,m3,m4,m5,m6,m7,local_mid_temp);


%% Calling Molecular mass Function to calculate molecular weight for each element
MW = molecular_mass(species);


%% Adding path to the MATLAB folder..

mkdir('D:\One drive\OneDrive\Documents\MATLAB',species)


%% Plotting Thermal Properties vs Temp Range...
% Plotting 'Temp_range' vs 'cp'

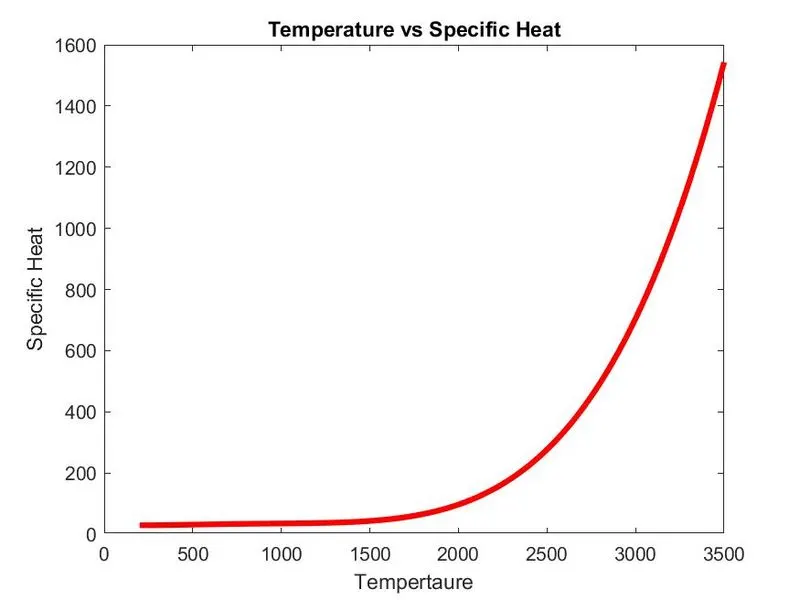
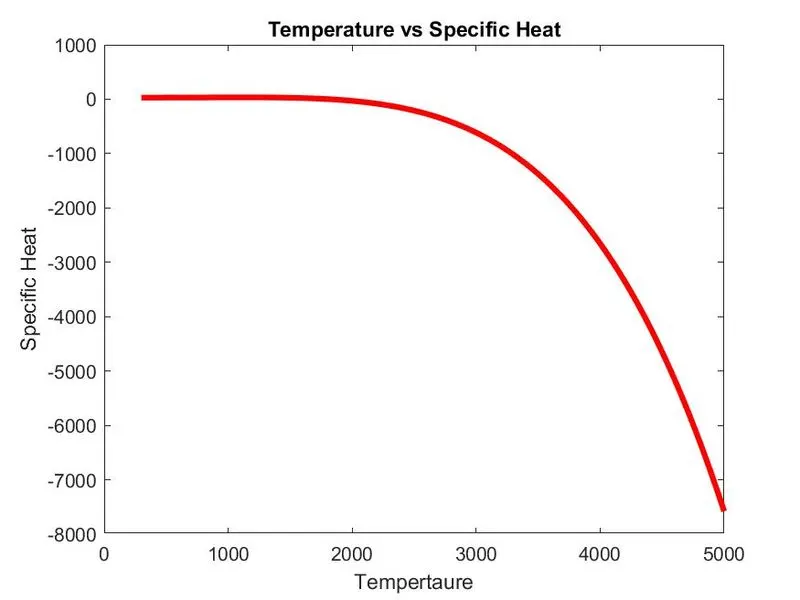
figure(1)
plot(local_temp_range,cp,'color','r','linewidth',3);
xlabel('Tempertaure');
ylabel('Specific Heat');


% Plotting 'Temp_range' vs 'H'

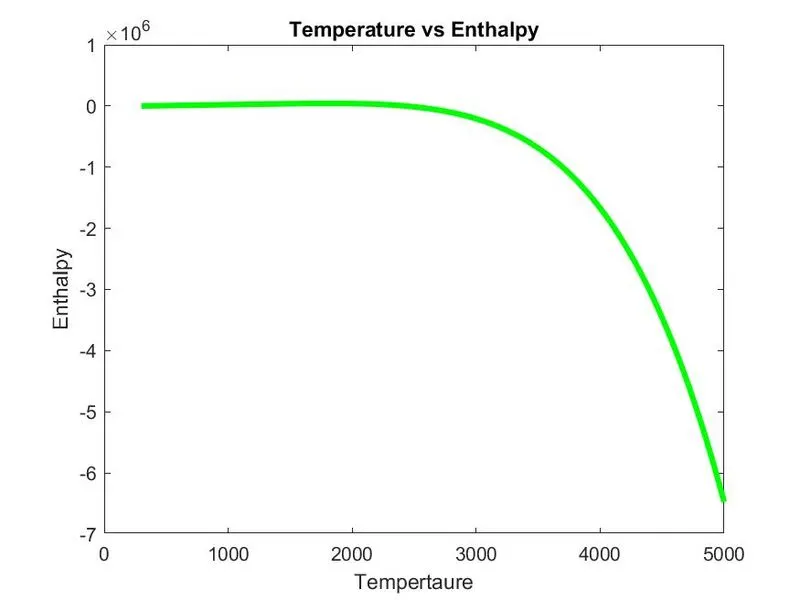
figure(2)
plot(local_temp_range,H,'color','g','linewidth',3);
xlabel('Tempertaure');
ylabel('Enthalpy');


% Plotting 'Temp_range' vs 'S'

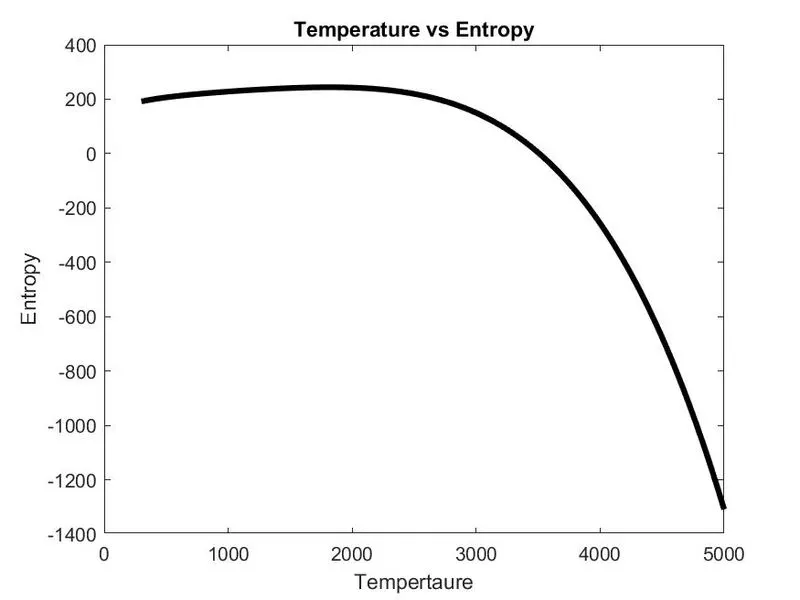
figure(3)
plot(local_temp_range,S,'color','k','linewidth',3);
xlabel('Tempertaure');
ylabel('Entropy');

%% Saving the plots in the MATLAB folder

cd(species)

% Saving the plots for Thermal Properties vs Temperature for every element

saveas(figure(1),'Temperature vs Specific Heat.jpg');
saveas(figure(2),'Temperature vs Enthalpy.jpg');
saveas(figure(3),'Temperature vs Entropy.jpg');

% Saving the plots in the MATLAB folder

cd('D:\One drive\OneDrive\Documents\MATLAB')


end
Function to calculate Thermal Properties :
MatLab Code for calculating Thermal Properties:
%% Function to define Thermal Properties relationship with Temperature
function[cp,enthalpy,entropy] = thrm_prop(local_temp_range,k1,k2,k3,k4,k5,k6,k7,m1,m2,m3,m4,m5,m6,m7,local_mid_temp)

% Given Data..
R = 8.3145;
T = local_temp_range;

% Categorizing high temp properties & low temp properties using 'if' statement..
if  local_temp_range <= local_mid_temp

   % Implementing Element wise operator for low temp thermal properties
   cp = (k1 + k2.*(T) + k3.*(T.^2) + k4.*(T.^3) + k5.*(T.^4))*R ;
   enthalpy = (k1 + k2.*(T./2) + k3.*(T.^2)./3 + k4.*(T.^3)./4 + k5.*(T.^4)./5 + k6./T)*R.*T;
   entropy = (k1.*log(T) + k2.*T + k3.*(T.^2)./2 + k4.*(T.^3)./3 + k5.*(T.^4)./4 + k7)*R;

else
   % Implementing Element wise operator for high temp thermal properties
   cp = (m1 + m2.*(T) + m3.*(T.^2) + m4.*(T.^3) + m5.*(T.^4))*R ;
   enthalpy = (m1 + m2.*(T./2) + m3.*(T.^2)./3 + m4.*(T.^3)./4 + m5.*(T.^4)./5 + m6./T)*R.*T;
   entropy = (m1.*log(T) + m2.*T + m3.*(T.^2)./2 + m4.*(T.^3)./3 + m5.*(T.^4)./4 + m7)*R;
end

end
Function to calculate Molecular Mass :
MatLab Code for calculating Molecular for all 53 Elements:
function MW = molecular_mass(species)

% Using upper making sure that the case of the Element name is always upper case
element_name = upper(species);

% Taking sample atoms
atoms = {'H','C','N','O','AR'};

% Atmoic Weight of these elements to be included in array
atomic_weight = [1 12 14 16 40];

% Initialising MW to be 0
MW = 0;

% Iterating 'for' loop for all species
for i = 1:length(species)
    for j = 1:length(atomic_weight)

        % Using 'strcmp' to compare the logical value for these strings, if they are equal then logic is 1, if not 0

        if strcmp(species(i),atoms(j))==1

            MW = MW + atomic_weight(j);
            u = j;

        end
    end

% Molecular mass formula
n = str2double(element_name(i));
    if n>1
        MW = MW + atomic_weight(u)*(n-1);
    end
end
OUTPUT :
Screenshot of the window for saving all species folder
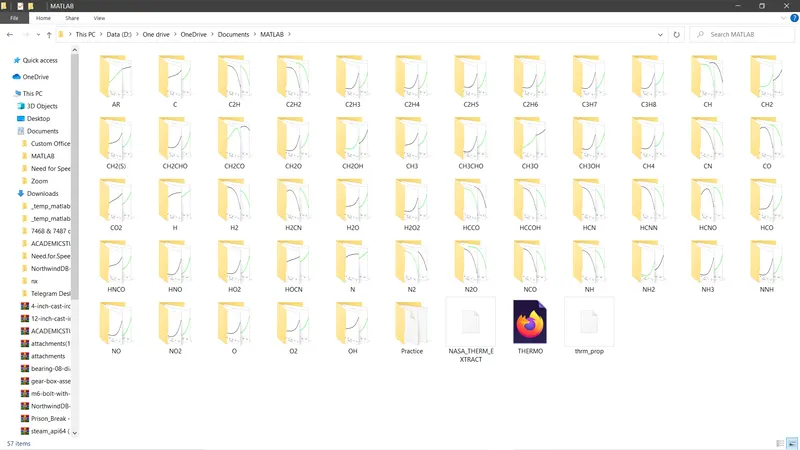
Plots for O2 :
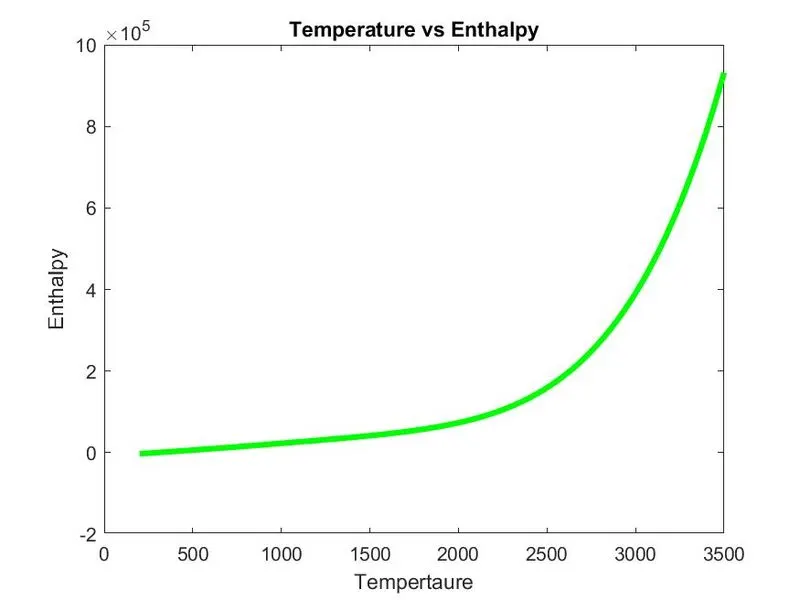
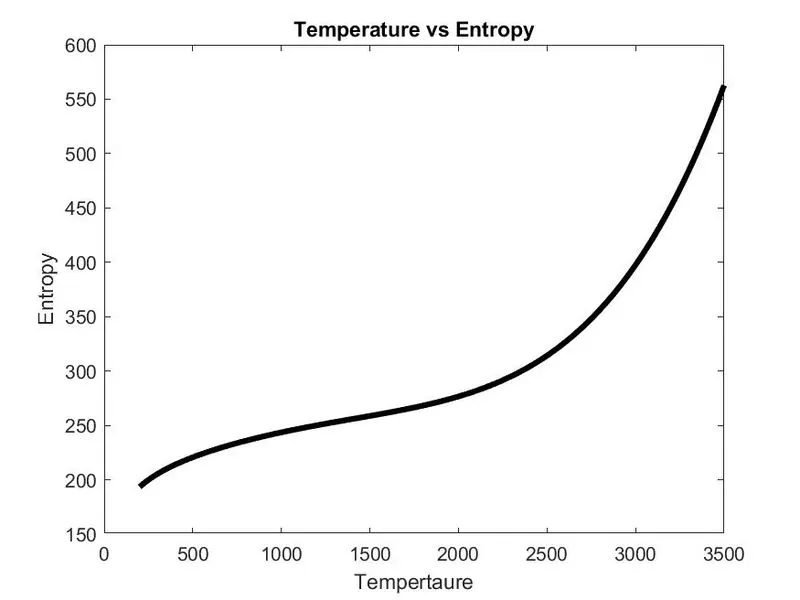
Plots for N2 :
Plots for CO2 :
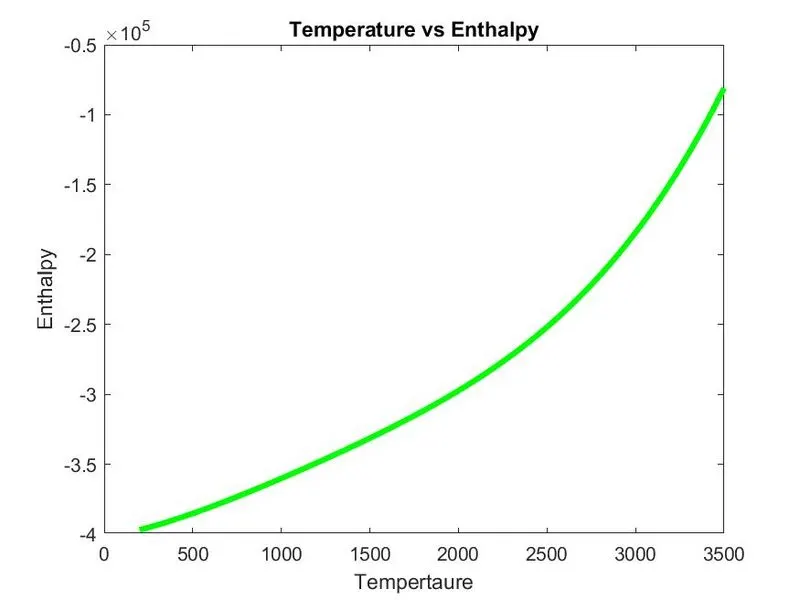
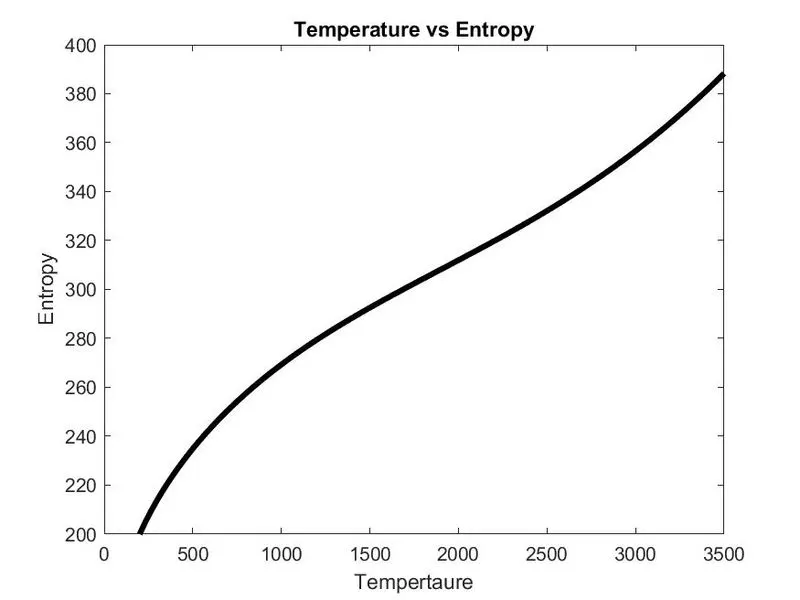
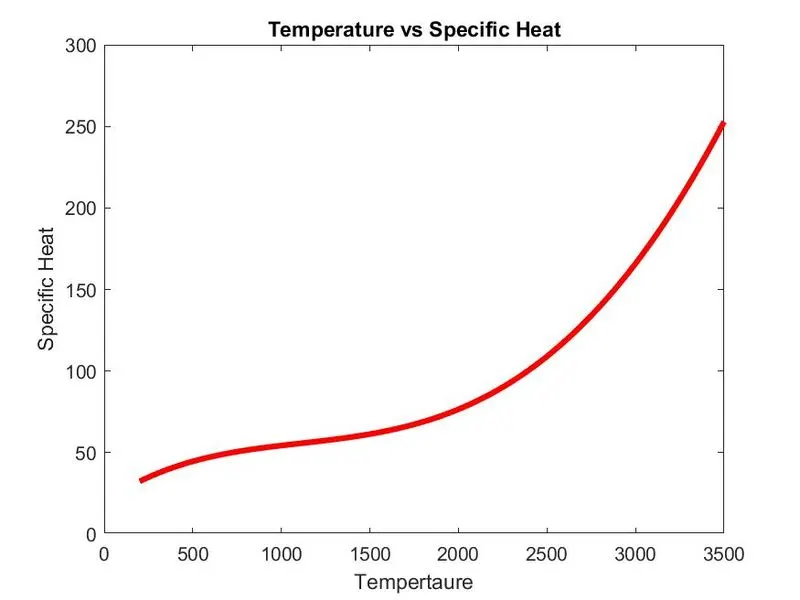
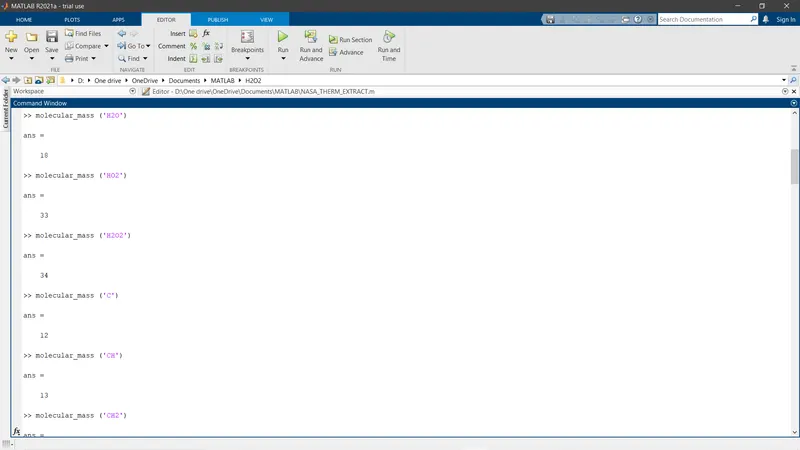
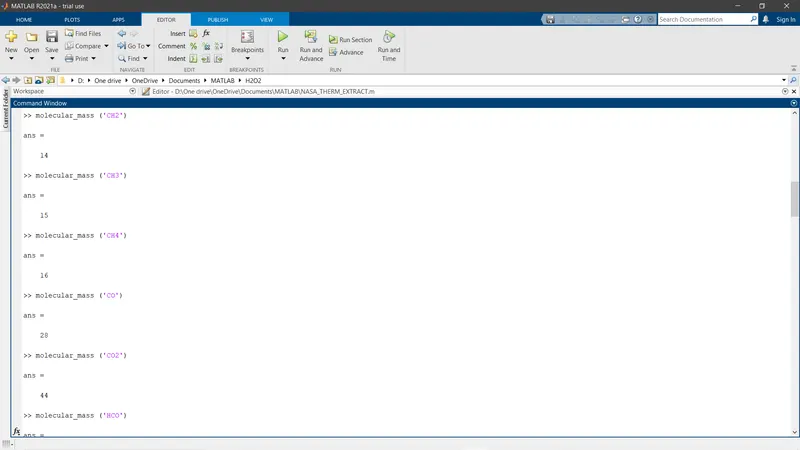
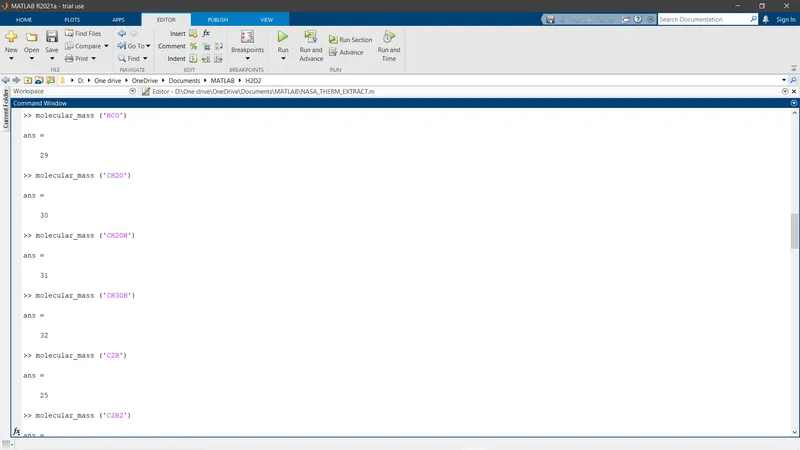
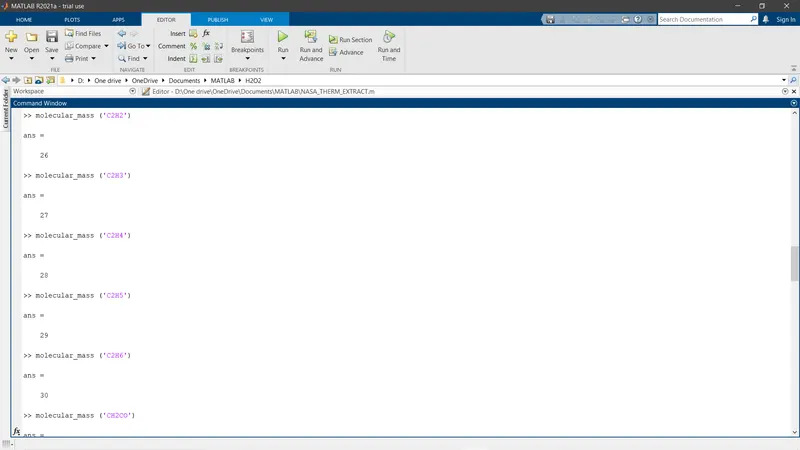
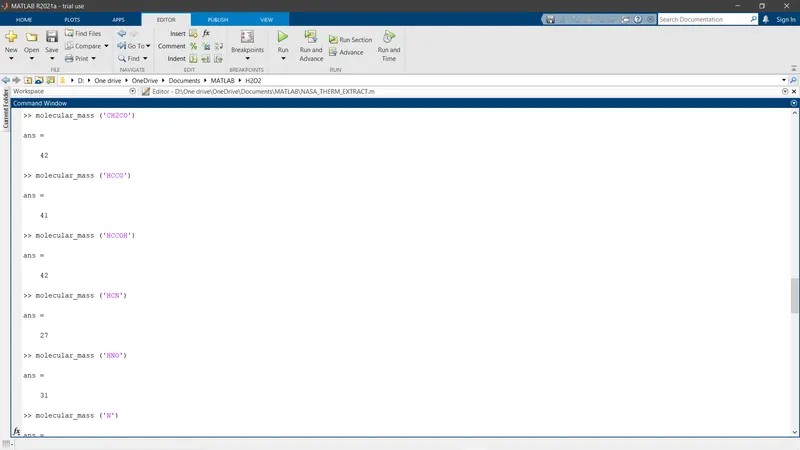
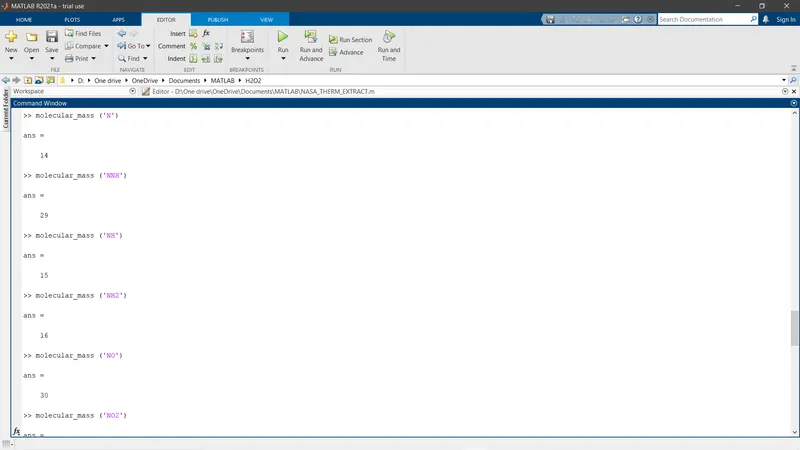
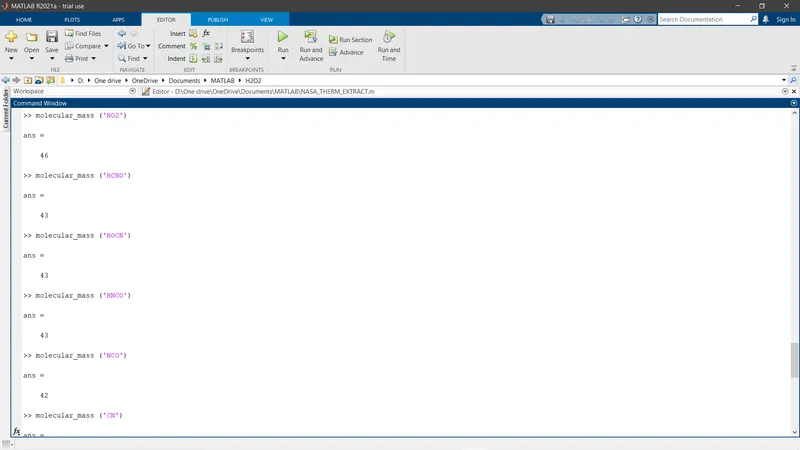
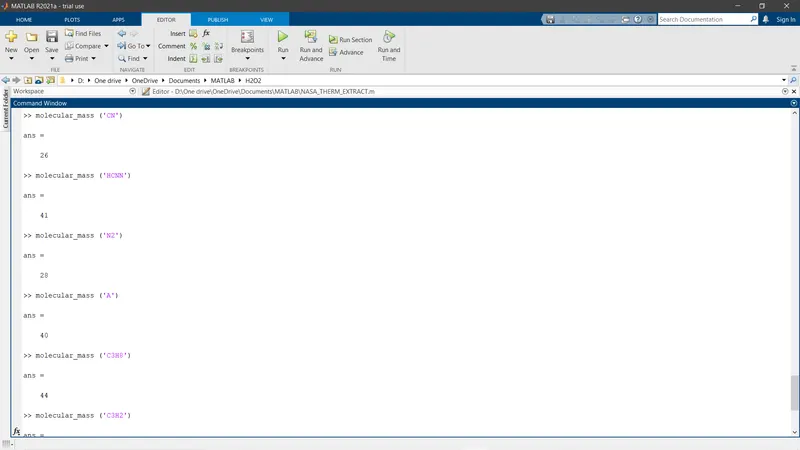
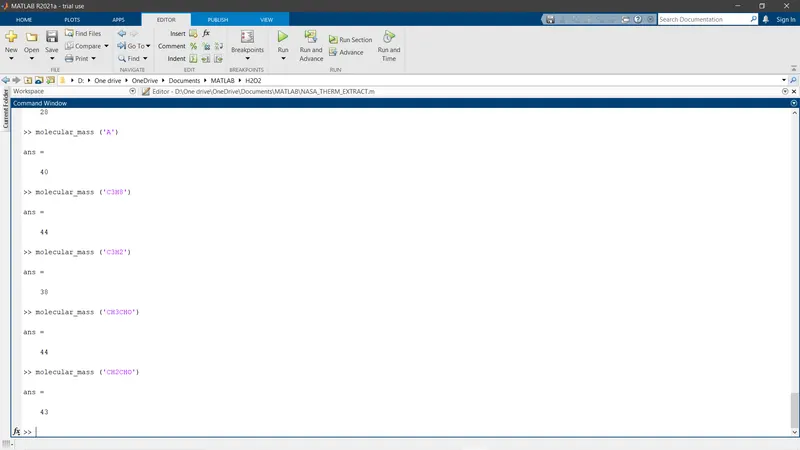
Molecular mass displayed in command window :
MatLab Code explaination :
STEP I : Extracting the file 'THERMO.dat' & saving it in a variable called 'THERM_DATA' using fopen and permitting fopen to read
STEP II : fgetl shall be utilized to get the first line and name this as 'Header'
STEP III : Again fgetl shall be utilised to get global temperature ranges given in the second line but these temp have to seperated using 'strsplit' command where blank space space ' ' shall be the delimiter to identify & provide gaping and then it has to be converted from string to num case using 'str2num' where a cell aray is being convereted hence the usage of '{}'.
STEP IV : Since the next three lines of the data are comment lines, it can be ignored by reading these lines directly using 'fgetl'. Fo easier usage ive used a 'for' loop to repeart fgetl 3 times to extraxt 3 lines.
STEP V : Here from this step all the processes have to be iterated for all 53 elements/compounds. Hence a 'for' loop starts
Next step involves extracting element/compound data. Since the first line involes the element/compound name and their local temperature ranges. We have to carefully extract these and name them seperately for future use of our code. Ive called this line using 'fget' and then ive seperated this line using 'strsplit' and called temp and assigned it to seperate variables.
For keeping the element/compound name, saved it in a seperate variable calle 'species'
STEP VI : Coefficients are extracted by 'fgetl' and they are carefully using ':' Range operator
STEP VII : Using the Thermal Properties relationship with Temperature, a function is evaluated & called to calculate these therm properties & similarly for molecular mas calculation
STEP VIII : The data is added to a new folder by giving the path using 'mkdir'
STEP IX : Plotting of Thermal Properties vs Temperature & using 'saveas' to save the plots as a jpeg format picture
STEP X : Saving all the data in to current folder using 'cd' to added path
Errors face while coding :
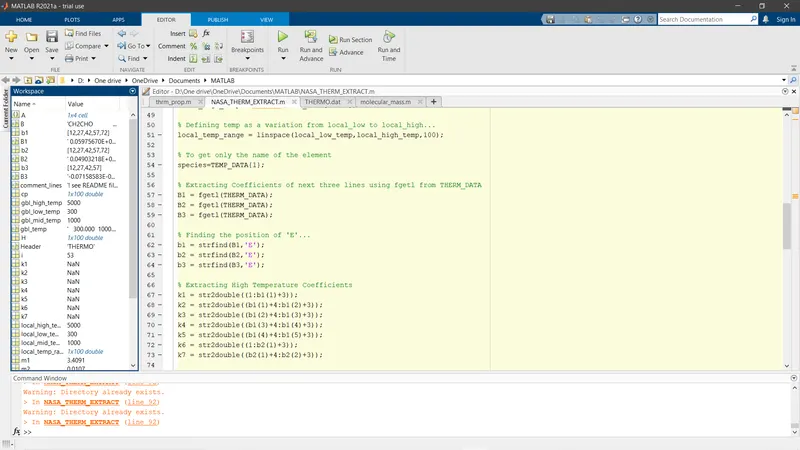
Incorrect method of extracting coefficients resulted in undefined answers 'Nan' 'Not a number'. This was corrected after using right method by calling the string that has to converted from str to double
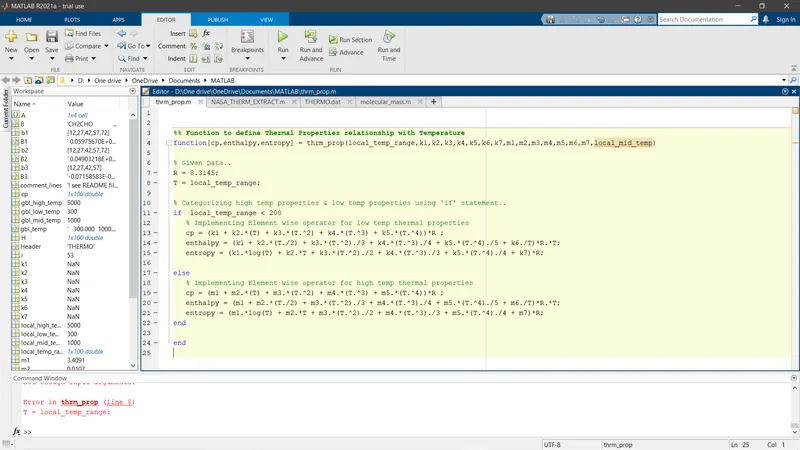
Incorrect input of temp range for categorizing coefficients from High temp to low temp. This was corrected by using mid temperature.
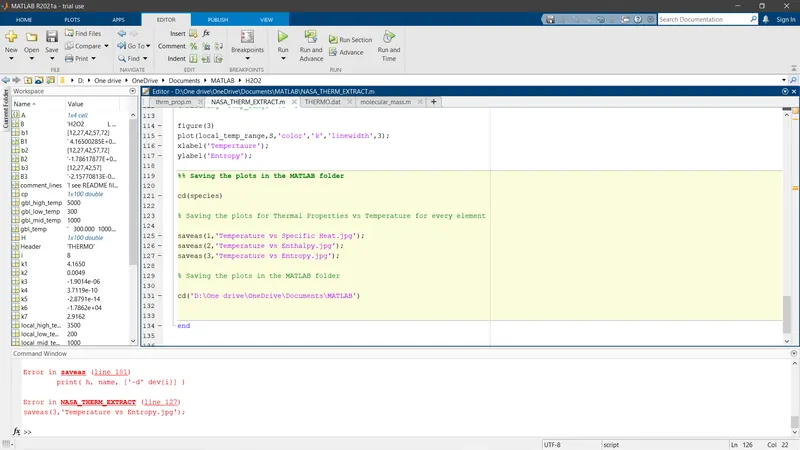
Save as command was not properly called. It was corrcted by calling the right figure number format.