Week -2
Simulink Modelling of a Doorbell using Spring Actuated Solenoid
AIM : To obtain the Position (x) vs Time (t) graph for solenoid actuation for various solenoid masses
ELECTRIC BELL WORKING BLOCK DIAGRAM :
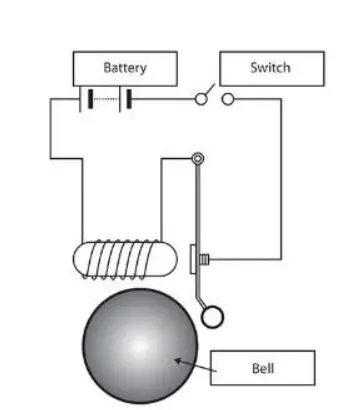
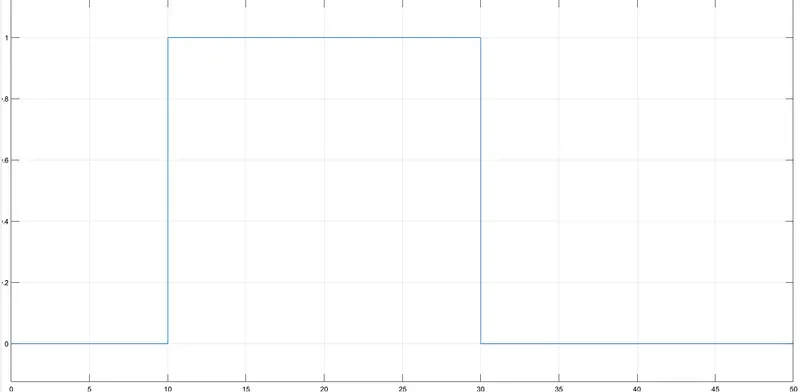
Our ultimate motive is to make the hammer touch the bell and retract as per given time. The switch for the solenoid to push the hammer is closed for 2 seconds & then retracts back. Hence we must design a pulse generator which produce such signal.
Solenoid Working Mechanism :
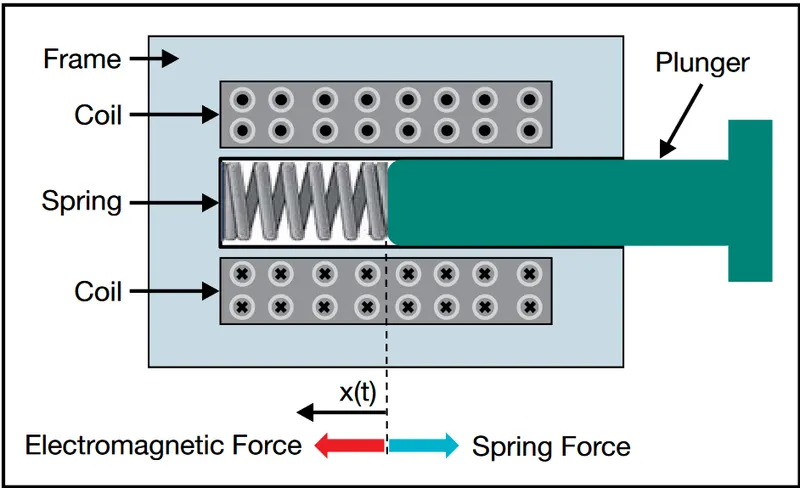
Solenoid consists of an electromagnetically inductive coil wound around a translating plunger. The coil is shaped such that the armature can be moved in and out of its center, producing an interactive flux around the coil’s inductance that closes through the solenoid’s housing, air gap, plunger forming a magnetic circuit.
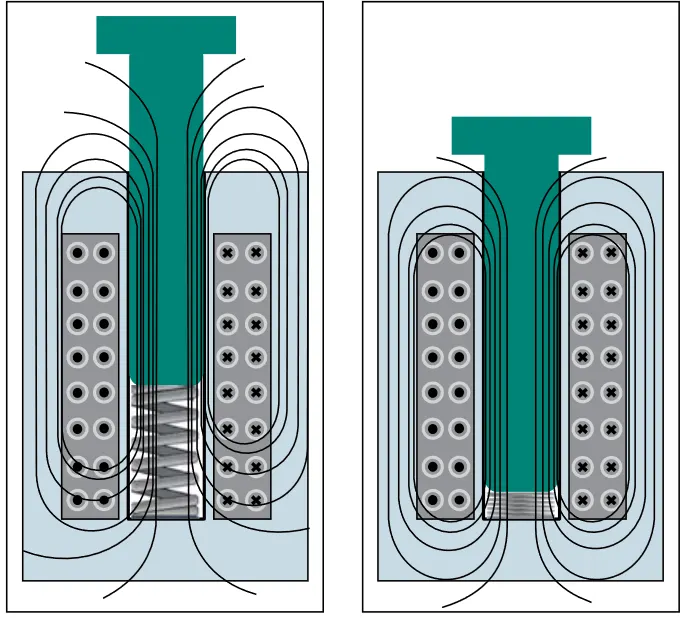
The magnetic field, through the main air gap, exerts an attractive force on the plunger to pull it inside the solenoid main housing. In thsi way, plunger inturn induces mechanical force to activate the control mechanism, for example opening and closing of a valve. In this case its used for operation of hammer to strike bell.
Simulink Model :
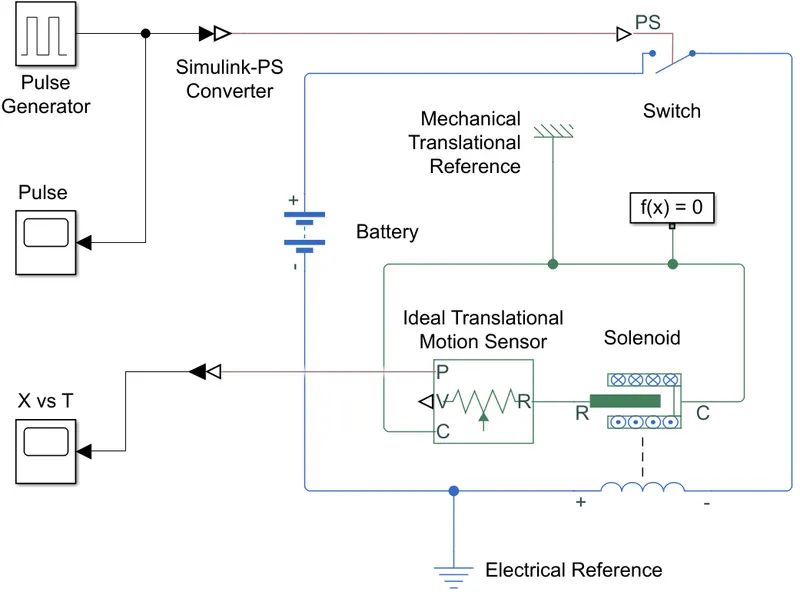
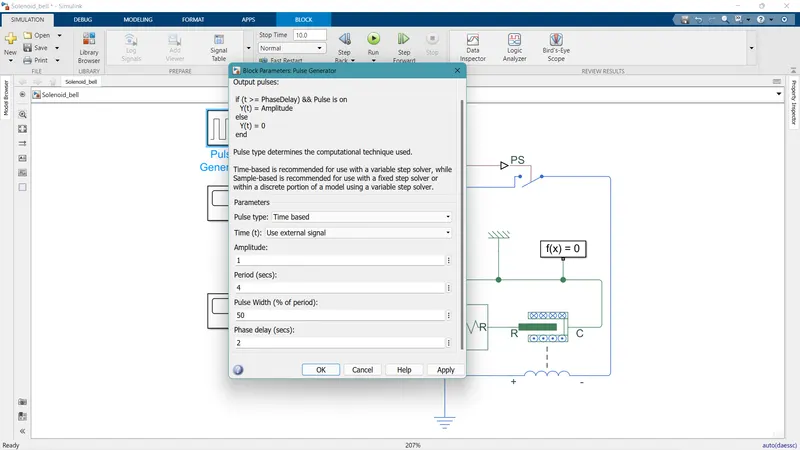
A pulse generator block is designed with a 4 seconds time period where it has its amplitude of 1 for 2 seconds and remaining period its amplitude is set to 0 & phase delay of 2 seconds for better visual & comparison.
Signal output from the pulse generator :
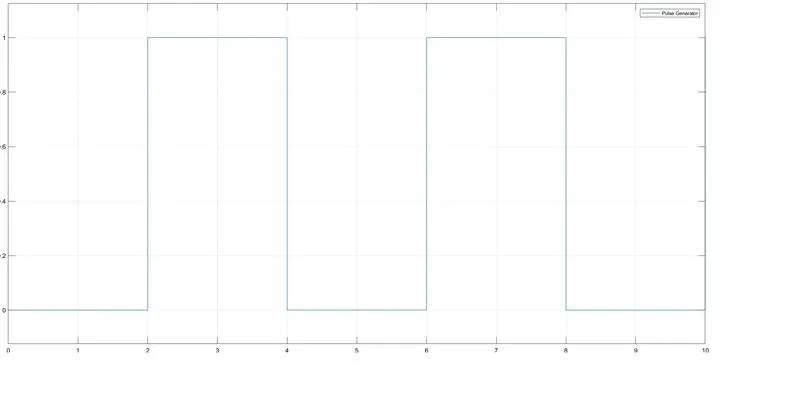
This desired output is given as an input instruction for the switch to operate. Hence we can use a switch block to send this as an input. But since a switch is a physical system, the simulink data from pulse generator has to converted to a physical signal. Therefore one uses Simulink-PS converter block to transcend data from simulink block to physical system block.
The switch is connected to the battery for a DC supply since the solenoid is a 24V DC operating spring actuated device. Terminal of the battery is connected to the solenoid through grounding which is an essential electrical reference & then back to the negative of switch.
Solenoid Actuation Data : 1. Actuation period = 2 sec
2. Pull in travel = 5 mm
3. Pull out travel = 1 mm
4. Pull in force = 0.75 N
5. Pull out force = 7.5 N
In order to analyze & visualize the actuator data, we can connect the actuator which is port 'R' of solenoid to the Ideal translational motion sensor. All the reference 'C' ports must be connected to same common mechanical translational reference to 0.
On can analyze Position & Velocity data from the Ideal Translational Motion Sensor, since we are interested in analyzing Position vs Time data for acuator, we connect scope for only 'P' port of the solenoid output port & 'V' port is unconnected.
The result has to analysed for different conditions of solenoid parameters.
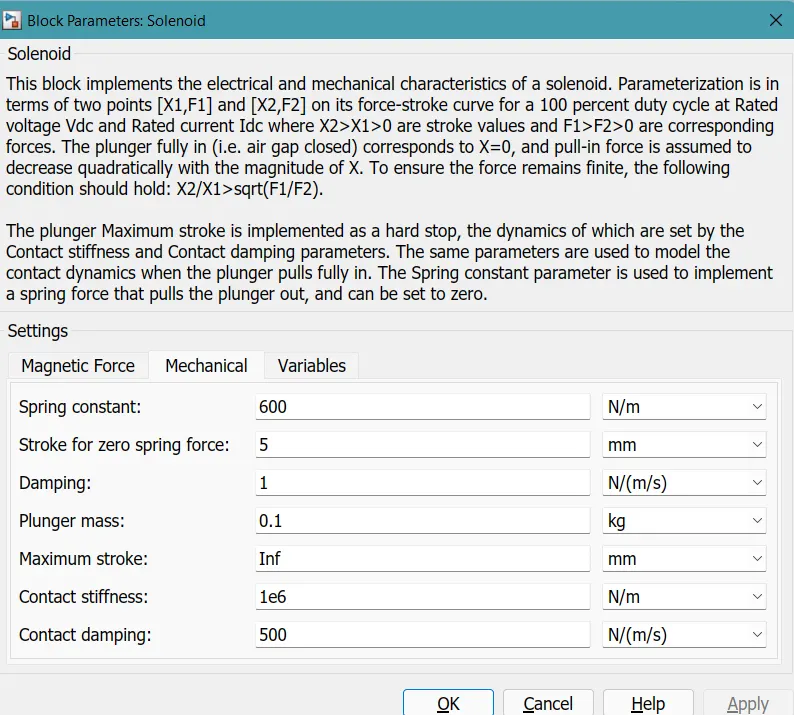
CASE I : For plunger mass of 0.1kg & spring stiffness of 600 N/m :
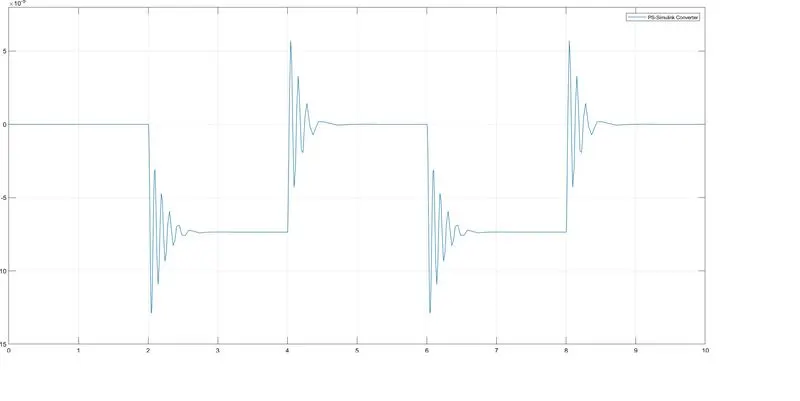
One can clearly see that, the actuator is exhibiting the SHM damping characteristics as this solenoid is actuated using a spring. From t=2s to t=4s, the solenoid is actuated in outward direction to push the hammer for striking. Since we have given a damping factor of 1 N/m/s the damping in the plot has been shown as above. The damping during pushing outward is more than retracting due to higher push force of 7.5 N & the spring senses a reduced damping effect when it retracts back due to less force of 0.75 N
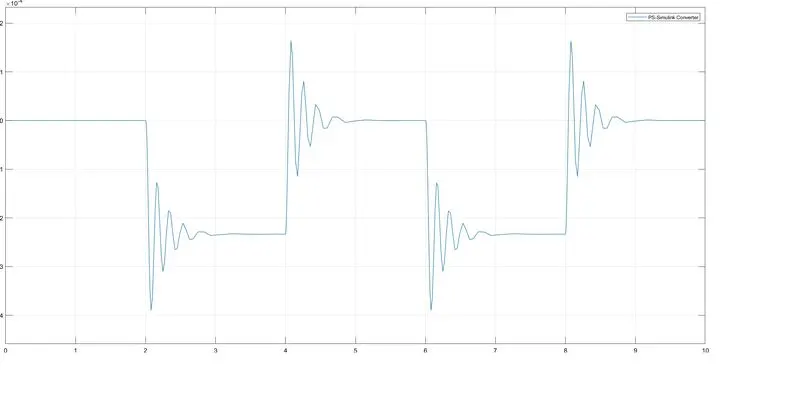
CASE II : For plunger mass of 0.1 kg & spring stiffness of 200 N/m :
 .
.
In thsi case we have reduced the stiffness of spring to 200 N/m & the position data of the actuator has changed 100 units from 10e^-5 mm to 10e^-4 mm for decreasing the spring stiffness from 600 N/m to 200 N/m. Due to less stiffness, the damping effect has also reduced to a significant amount and takes a lot time to come back to its intial state.
CASE III : For plunger mass of 0.5 kg & spring stiffness of 200 N/m :
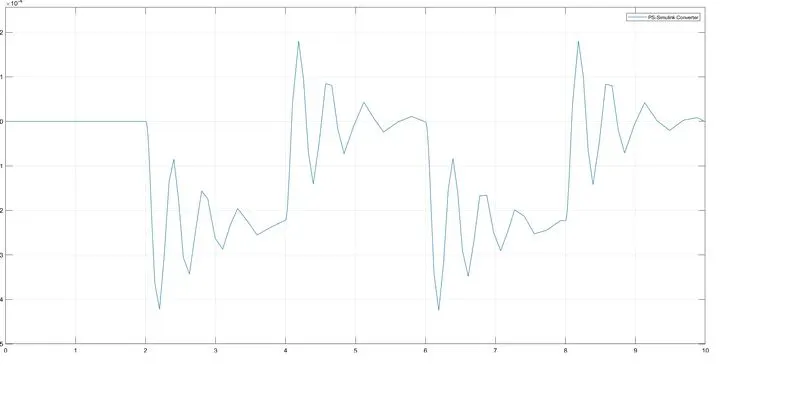
Due to increase in mass of the plunger, the distortion of the plunger is much higher and damping is negligible. The time taken for the spring to get back to its original state is nearly its time to actuate.
Automation of fan by Themistor using Simulink :
AIM : Automating a fan using temperature parameters with the help of temperature sensitive device 'Thermistor'
Temperature Data :
* T1 = 20 deg Celsius for 0-10s
* T2 = 27 deg Celsius for 10-30s
* T3 = 23 deg Celsius for 30-50s
Automation Parameters :
* The fan must be turned ON when T > 25 deg celsius, if not the fan is turned OFF.
Temperature Sensitive Devices :
These devices are used for caliberating temperature as these devices are sensitive to temperature change around the surrounding. As the temperature changes, the resistance of the material also changes accordingly. Usng this change in resistance, the corresponding voltage is driven and from this current parameters can be controlled. In this case, the DC motor of fan or voltage output from the voltage sensor from Thermistor.
Classification of Temperature Sensitive Devices :
1. Positive Temperature Co-efficient devices - The resistance of the material increases on increase in temperature around it. The temperature is sensed by convective heat transfer around the surface of thermistor.
Eg : RTD (Resistance Temperature Detector)
2. Negative Temperature Co-efficient devices - The resistance of the material decreases on increase in temperature around it. The temperature is sensed by convective heat transfer around the surface of thermistor. These materials are usually semiconductor devices where this behaviour is reversed.
Eg : Thermistor
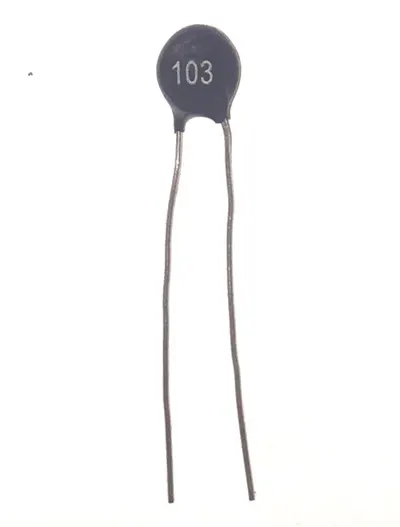
The governiong equation for temperature-resistance relationship is as follows.
`R = R_0*e^(β(1/T−1/T_0 ))`
where R is the resistance of the thermistor at required temperature
`R_0` is the resistance of the temperature at 298.15 K
β is the temperature coefficient for thermistor
`T_0` is 298.15 K &
T is the temperature data recorded
Temperature vs Resistance Characteristic curve for Thermistor :
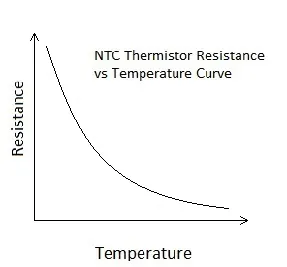
The slope of the curve is negative indicating decreased values of resistance over an increase in temperature values. The characteristic curve follows a negative slope exponential curve as we have determined from the governing equation above.
Simulink Model for Automation of Electric Fan :
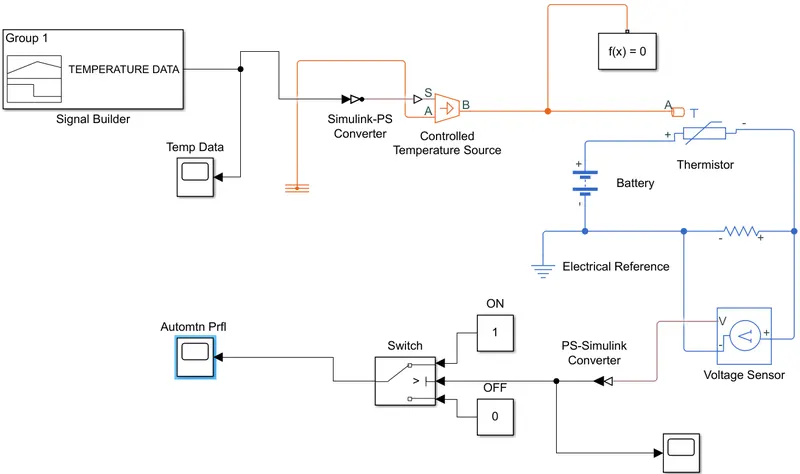
Modelling procedures & blocks used :
1. Controlled temperature source: A heater is simulated using a block named Controlled temperature source , which inhibits characters of heater with a constant source of heat. It has three ports mainly with port A being thermal reference point and B port as the output heat source. Port S is meant to give an input characteristic of the behaviour of thermal output.
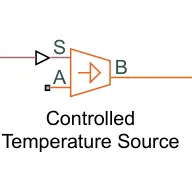
Therefore we need to provide a signal to port S, which simulates the automation data given above.
2. Signal Generation using Signal Builder :
In order to generate signals for Temperature data given above, we must use a block named Signal Builder. We can generate signals based on our needs giving X & Y axes limits to the plot in the function block.
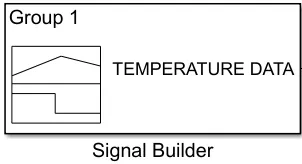
Giving the Temperature automation data as axes limits for port S input signal.
NOTE :
* One needs to make sure that temperature in Simulink is taken in units of Kelvin as default, so the units on Y axis must be in the order of Kelvin for better visula of result plot.
* Each time period on the graph must contain only one of its associated point on temperature axis. No intermediate points can be used.
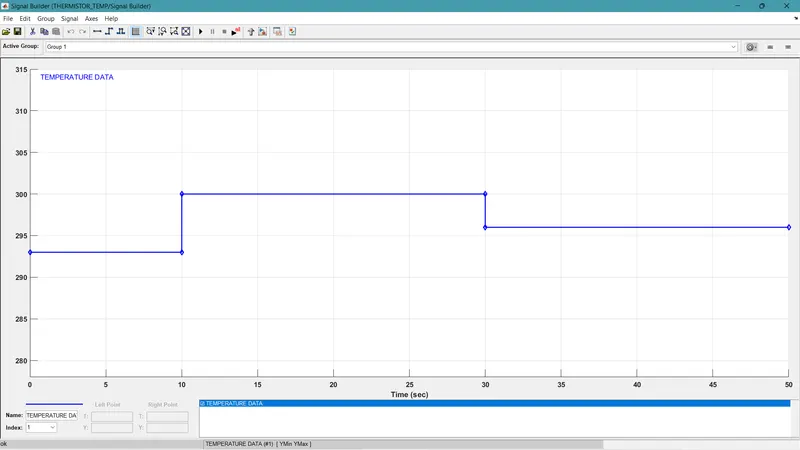
Output plot from Signal Builder for Port S signal Input :
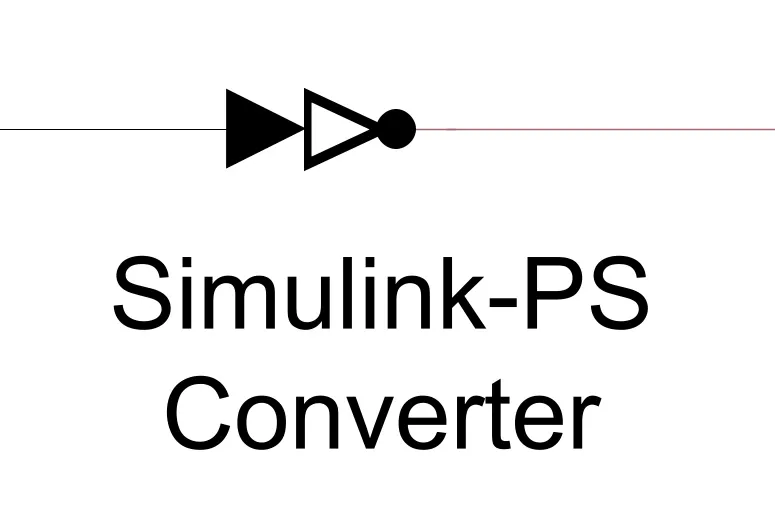
3. Simulink-PS Converter & its configuration :
The output from signal builder needs to be an input to the controlled temperature source block. Since, the signal builder is a simulink, the data needs to converted to physical signal block using Simulink-PS Converter.
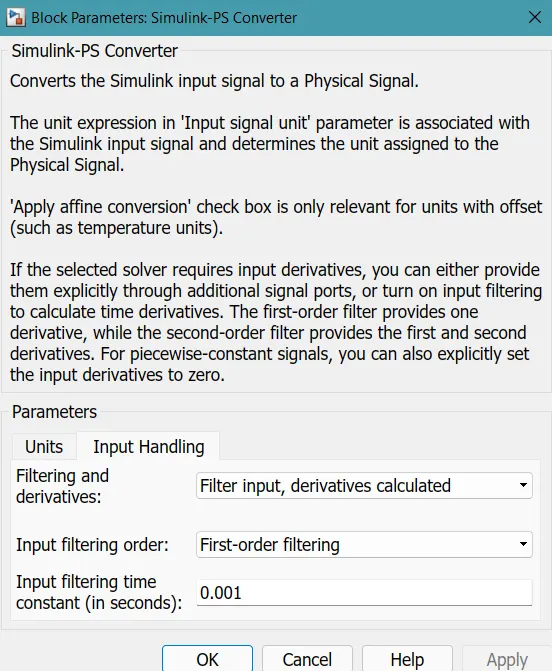
Configuration Changes :
* Simulink reads controlled temperature source block as a set of equations. Since signal builder is a linear equation solver, but controlled temperature source block can be of higher order equation. Hence one needs to change this configuration to filter input, derivatives calculated option.
4. Thermistor :
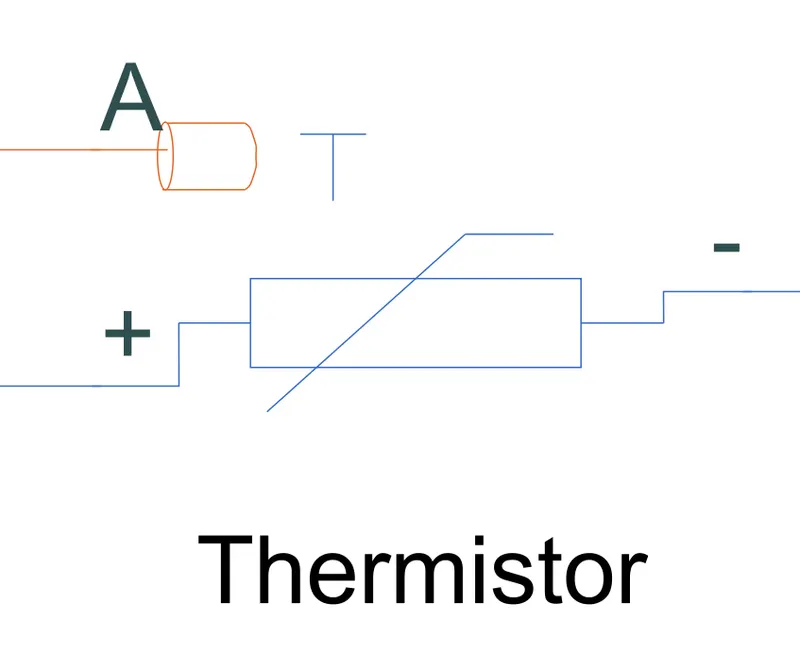
Thermistor consists of 3 ports mainly, where port A is an input signal port which receives thermal signal from the controlled temperature source. The other 2 ports are coonected to the terminals of battery and through a resistor for volatage fluctuation reference due to change in temperature.
4. Voltage Sensor :
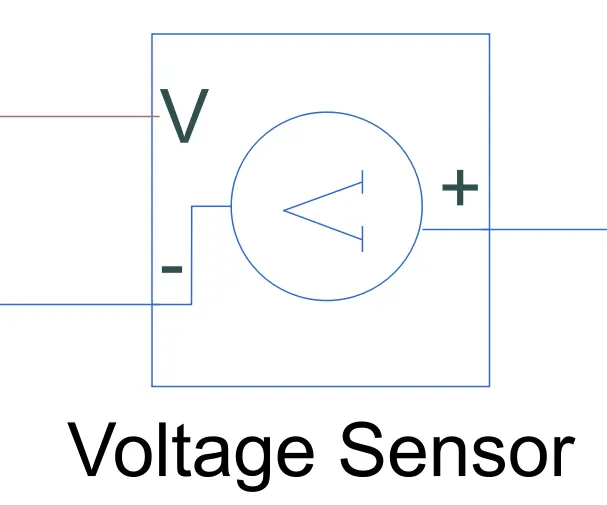
The positive & negative terminal ports of the sensor are connected from the battery-thermistor circuit through resistor as reference. The port V is the output voltage signal port from which the voltage of the circuit is shown. A scope is added to the circuit to visualize the Voltage signal plot as follows after conversion from Physical signal to Simulink signal since scope is a simulink block
Voltage Variation output plot from Voltage sensor :
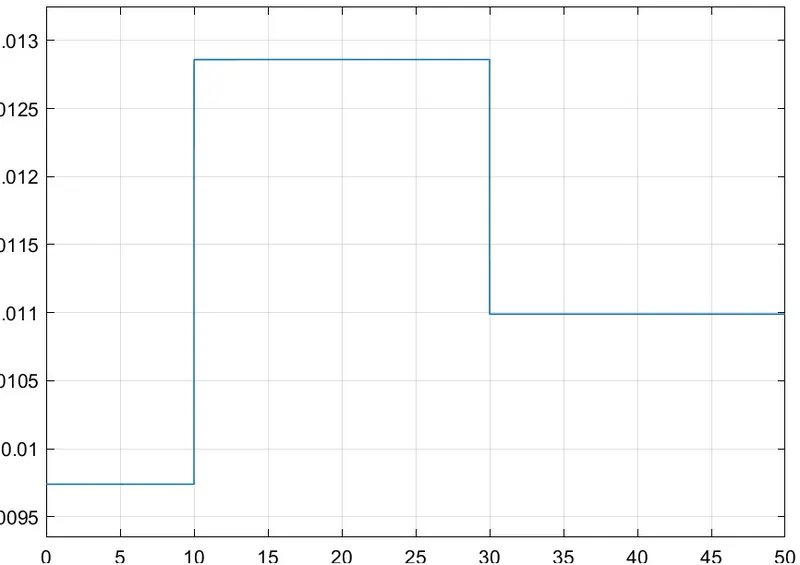
From the above plot we can clearly see that :
1. For 0<t<10s - Voltage = 0.097 V
2. For 10<t<30s - Voltage = 0.0128 V
3. For 30<t<50s - Voltage = 0.011 V
From the condition above we can clearly see that the voltage for T > 25 degree celsius is 0.0128 V
5. Switch :
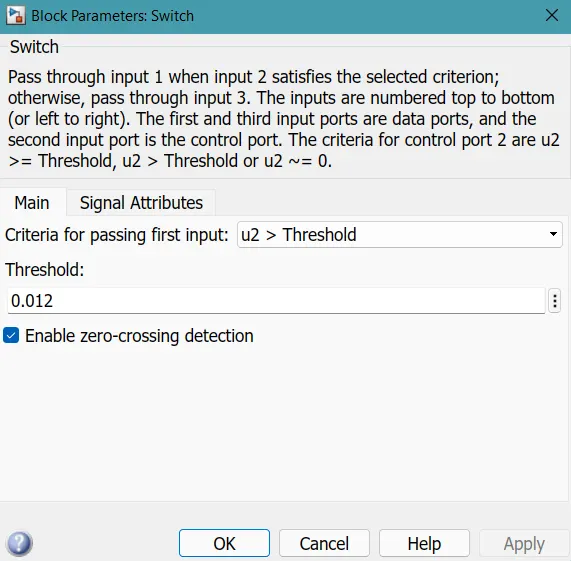
The signal output from the voltage sensor is given as an input to the three terminal switch. The upper and lower terminals are the conditional terminals of the switch, which are coonected to the constant blocks of values 1 & 0 respectively. Th emiddle switch is control switch where the voltage sensor output is given as an input. Condition of value 1, represents the switch is ON if it meets a suitable threshold condition, if not the port with constant block 0 is activated to turn OFF the switch.
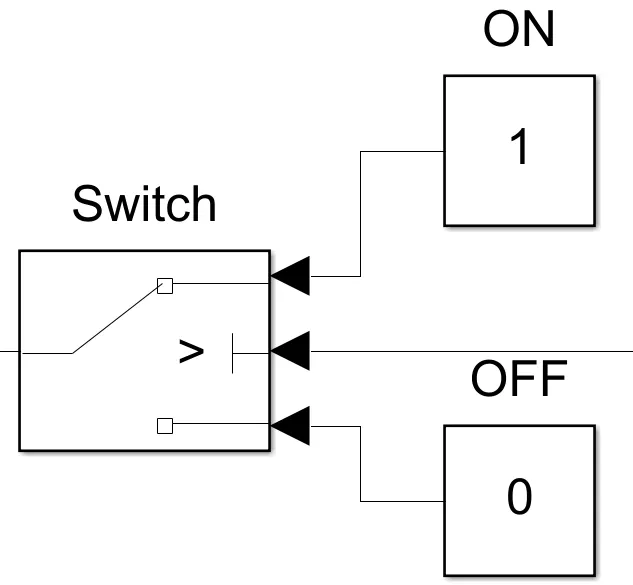
Condition of value 1, represents the switch is ON if it meets a suitable threshold condition, if not the port with constant block 0 is activated to turn OFF the switch.
Threshold voltage to be provided is decide from the Voltage Variation output plot from above, where we can clearly see that for T > 25 degree celsius is 0.0128 V
This is treated as thrteshold voltage for the switch to be activated to run the motor of Fan.
Hence threshold of 0.0128 V is given as Voltage threshold input in the Switch Parameter
6. Output plot from 3 Terminal Switch :
The value 1 is set for switch to remain in ON condition & value 0 for OFF state.