Week 3 - Solving second order ODEs
AIM:-
We aim to program an (ODE solution) for the motion of the pendulum
FORMULA:-
- t_span = linspace(0,20,500);
- [t,results] = ode45(@(t,theta) pdm_func(t,theta,b,g,l,m),t_span,theta_0);
- plot(x1,y1,'markersize',50,'marker','.','color','k');
- dtheta2_dt = -(b/m)*theta2-(g/l)*sin(theta1);
EXPLANE THE CODE:-
1st script file:-
Start with clear all,close all,clc. Then define the inputs b(damping), g(gravity), l(length of pendulum), m(mass of ball of pendulum). Then gave initial condition (theta_0), total time(t_span), then solved the ode equation,that gave us (t,results), from which we will plot of (dispalcement vs time),(velocity vs time), (displacement vs velocity).and we will give title, xlabel and ylabel. Then we defined the legend and ct.
theta1 = results(:,1) is defined
use for loop command
then write a program for movie
which is used in the 1st script file.
WRITE PROGRAM:-
1st script file program:-
%% Create a Program for ordinary differential equation (ODE) solving

clear all
close all
clc

%% inputs
b = 0.05; % Damping
g = 9.81; % Gravity
l = 1; % Length of pendulum
m = 1; % Mass of pendulum BOB

%% initial conditions
theta_0 = [0;3]; % Initial Conditions

%% totle time
t_span = linspace(0,20,500); % (Totla time or Time interval)

%% Solve ordinary differential equation (ODE45)
[t,results] = ode45(@(t,theta) pdm_func(t,theta,b,g,l,m),t_span,theta_0);

%% Plot for Displacement and Time
figure(1)
plot(t,results(:,1));
title('displacement vs time')
xlabel('time')
ylabel('displacement')

%% Plot for velocity and Time
figure(2)
plot(t,results(:,2));
title('velocity vs time')
xlabel('time')
ylabel('velocity')

%% Plot for Displacement and velocity
figure(3)
plot(t,results(:,1));
hold on
plot(t,results(:,2));
title('displacement vs velocity')
xlabel('velocity')
ylabel('displacement')

%%
legend('displacement','velocity')
ct = 1;
theta1 = results(:,1);

%% use for loop commands
for i = 1:length(t_span)
    r = theta1(i);

   figure(4)

   x0 = 0;
   y0 = 0;
   x1 = l*sin(r);
   y1 = -l*cos(r);

   % Plot for length of pendulum
   plot([x0 x1],[y0 y1],'linewidth',3,'color','g');

   hold on

   % Plot for BOB
   plot(x1,y1,'markersize',50,'marker','.','color','k');

   % Create a plot for length of supporting rod
   plot([-1.5 1.5],[0 0],'linewidth',6,'color','r');
   hold off

   axis([-5,5,-5,5]);
   title('Animation of simple pendulum')
   xlabel('X AXIS')
   ylabel('Y AXIS')
   grid on

   pause(0.03)
   K(ct) = getframe(gcf);
   ct = ct+1;

end
%% create movie
movie(K)
videofile = VideoWriter("pendulum_mai.m","Uncompressed AVI");
open(videofile)
writeVideo(videofile,K)
close(videofile)
2nd script file program:-
% create function for ODE
% formula : dtheta_dt = -(b/m)*theta2-(g/l)*sin(theta1);
function dtheta_dt = pdm_func(t,theta,b,g,l,m)
         theta1 = theta(1);
         theta2 = theta(2);

         dtheta1_dt = theta2;
         dtheta2_dt = -(b/m)*theta2-(g/l)*sin(theta1);
         dtheta_dt = [dtheta1_dt;dtheta2_dt];
end
Result (output):-
Animation link - https://youtu.be/ronApwE_HLI
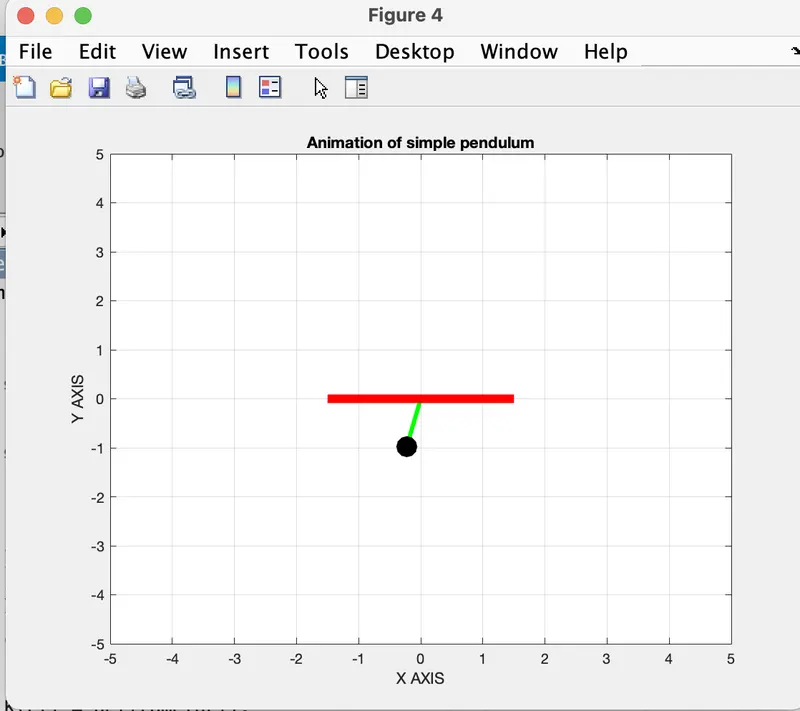
GENERATED ERRORS:-
1st error:-
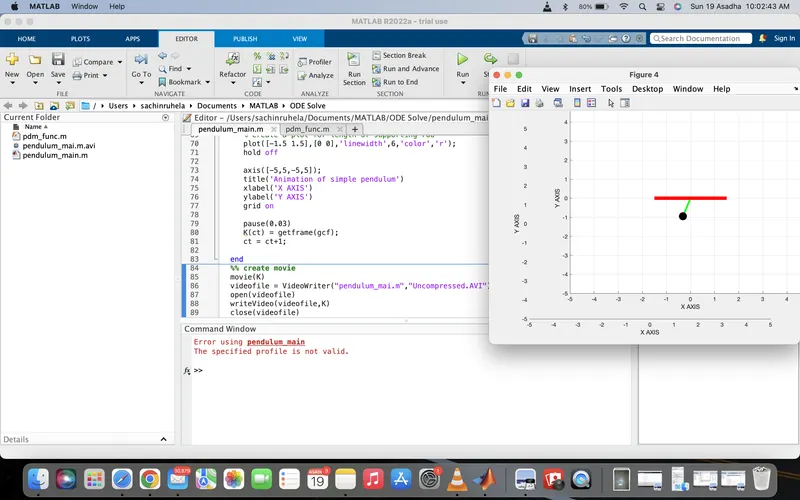
This error is ( The specified profile is not valid) in command line
Error:- The While error is (video file = VideoWriter('filename','Uncompressed.AVI')
Solution:- and this solution is (video file = VideoWriter('filename','Uncompressed AVI')
2nd error:-
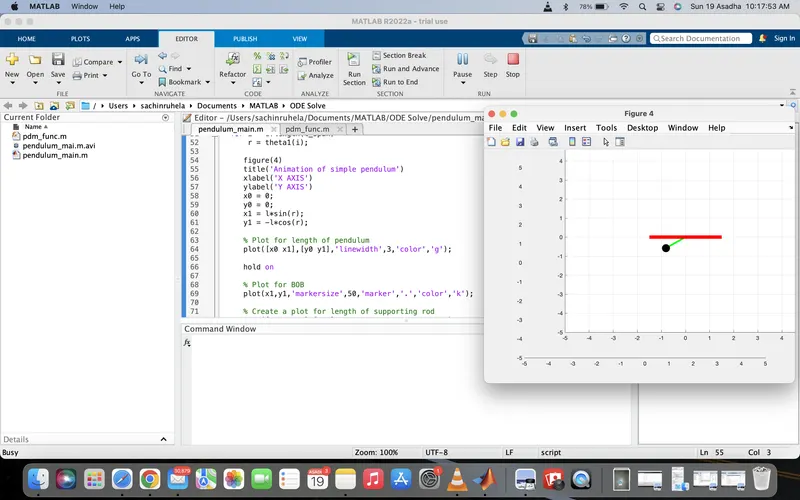
error:- Title, xlabel and ylabel did not show in the final output. Because I wrote the program below the Figure (4)
solution:- I had moved the title, xlabel, ylabel. and past it middle in the 'axis' and 'grid on'
3rd error:-
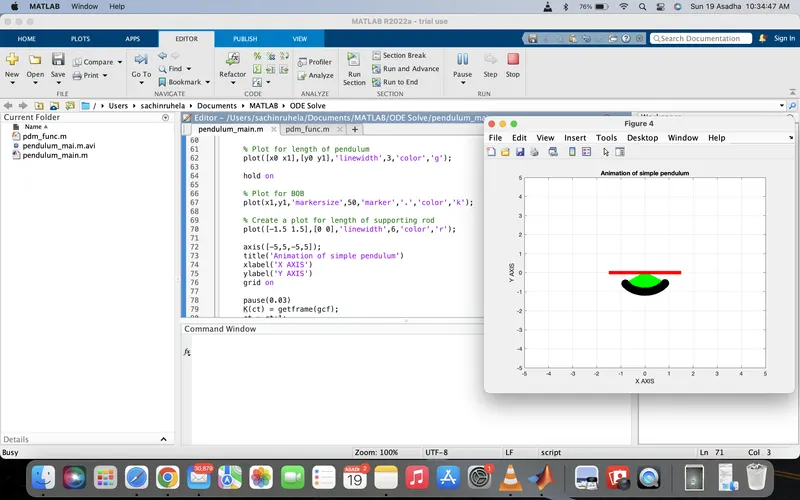
error:- I didn't write the hold off command, so it looked like
solution:- so, i wrote the hold off command upper the axis