Week 3: Flow over a backward facing step
AIM - Simulation of Flow over a backward facing step using converge.
OBJECTIVE -
- To run a simulation for a flow over a backward facing step.
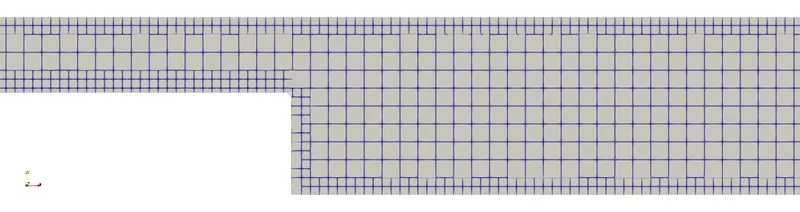
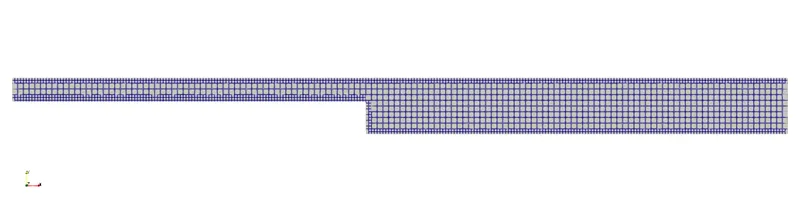
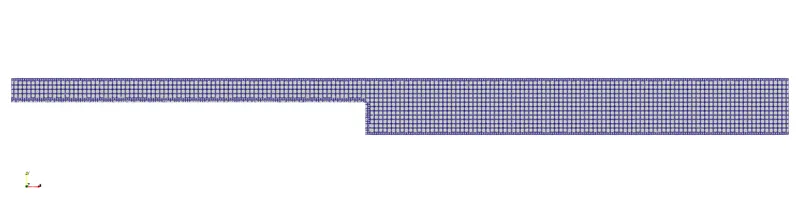
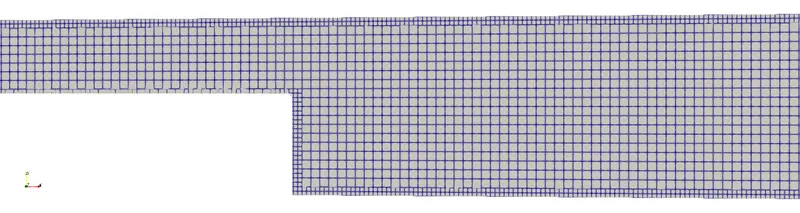
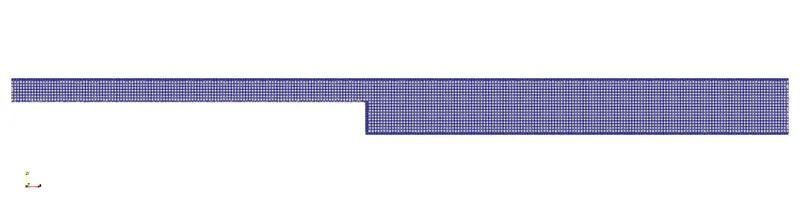
- To run cases for 3 different base meshes with sizing 2e-3 m, 1.5e-3 m, 1e-3 m. and show the mesh generated in each case.
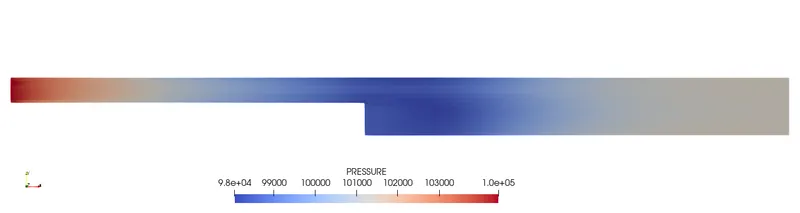
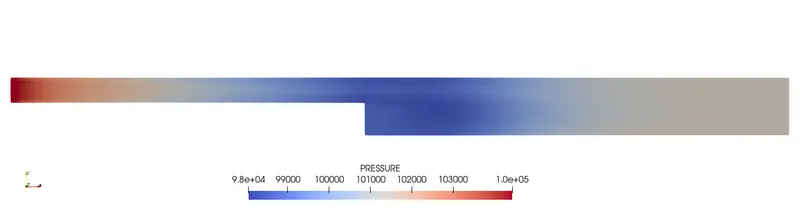
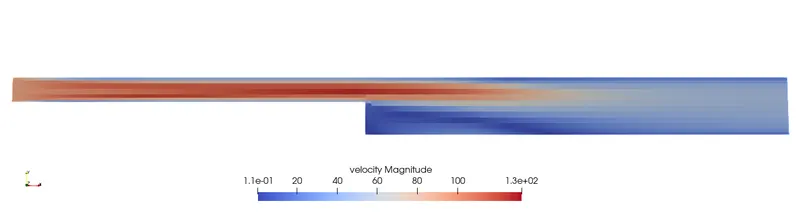
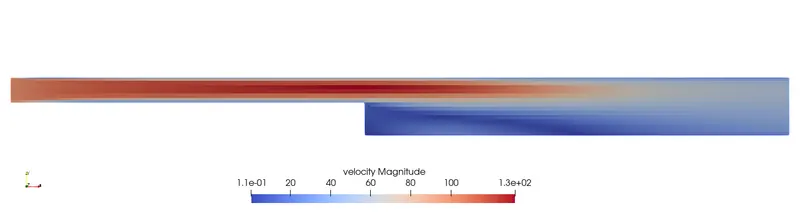
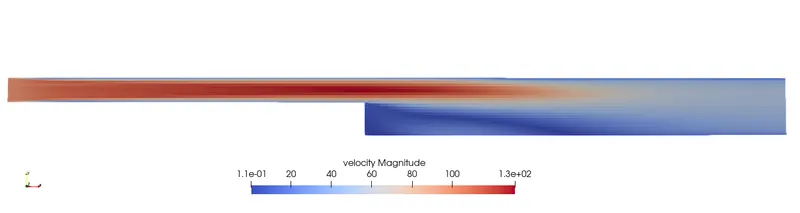
- To show the pressure and velocity contours.
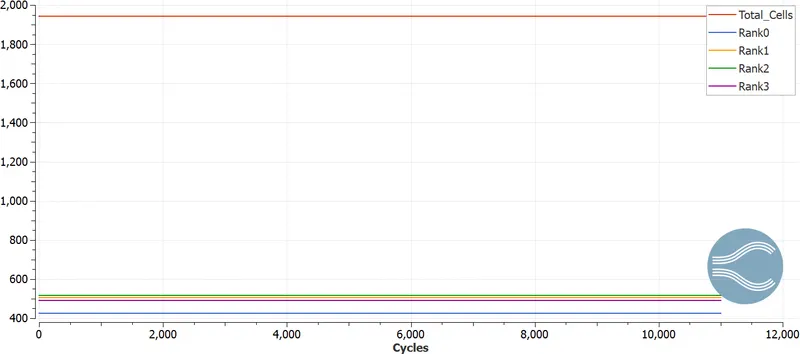
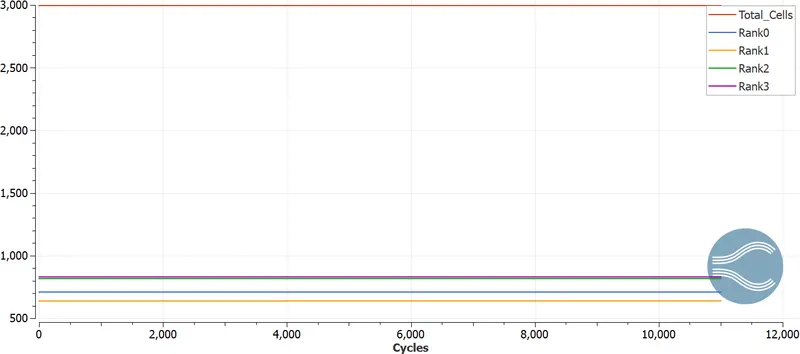
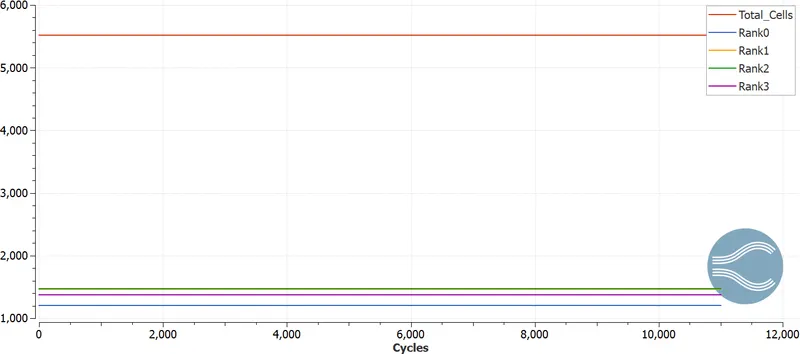
- To show plots for velocity, pressure, mass flow rate and cell count for all the 3 base mesh sizes.
- To explain where and why the flow seperation is taking place.
PRE_PROCESSING -
Geometry -
First the stl geometry if the backward facing step is imported in converge.
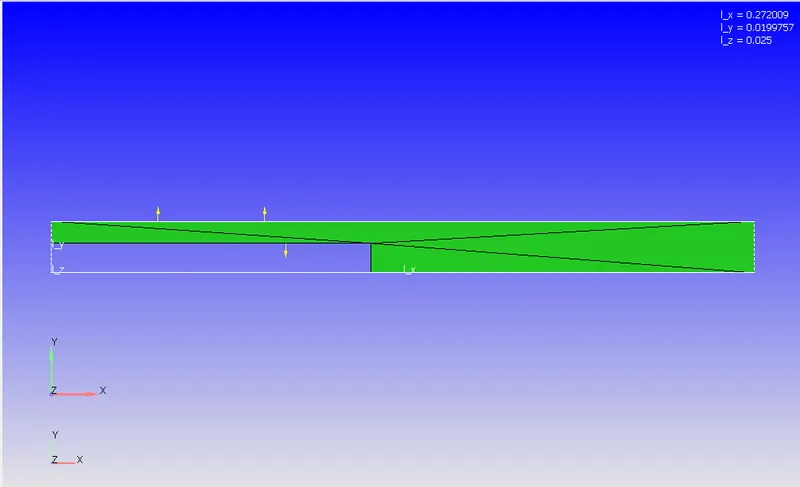
the normal for the front and back side are aligned to the z axis.
also the normals are within the domain.
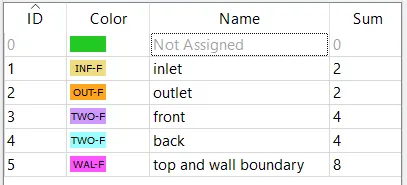
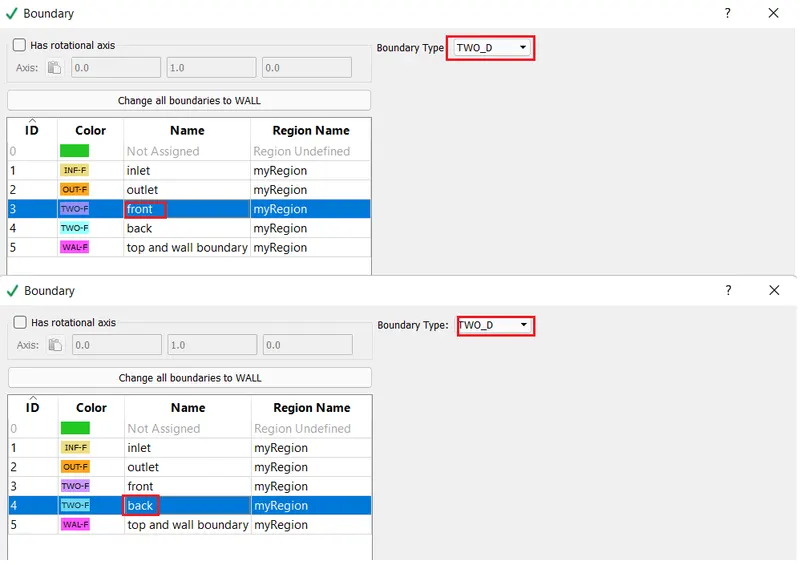
Now naming the boundaries for the respective faces.
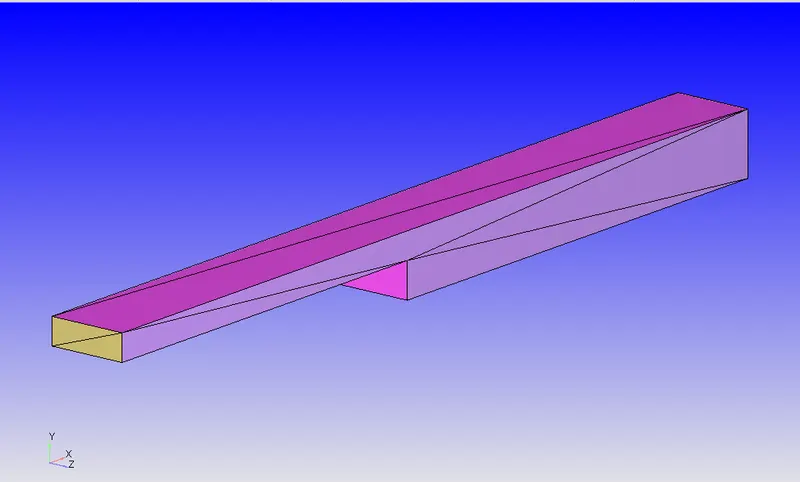
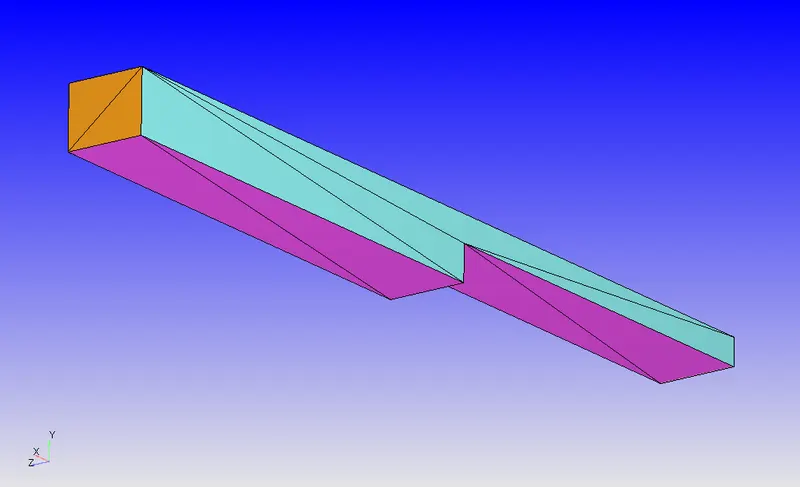
It is clear form the above images that the boundaries are being flagged properly and now the case can be setup.
Case Setup -
Select the application type as Time-based.
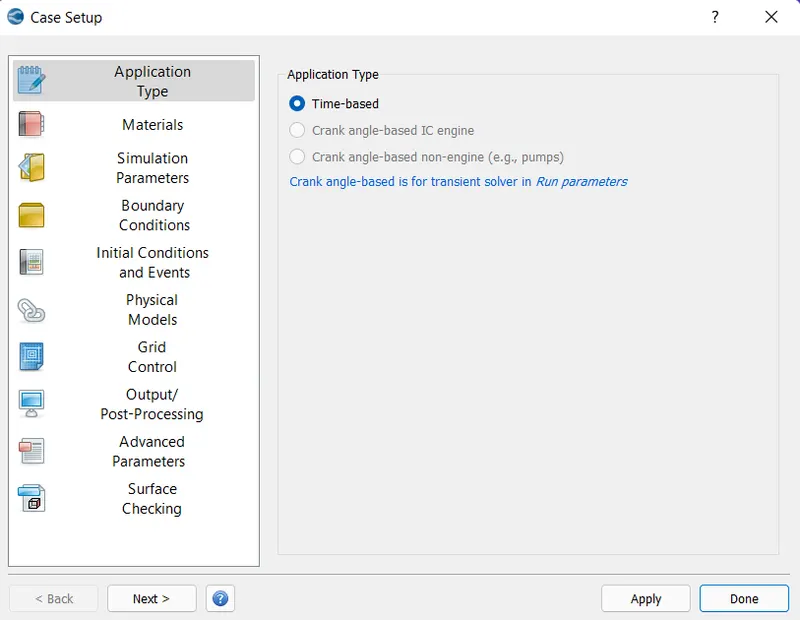
Select gas simulation from the material section, select air as the predefined mixtures and turn on the species.
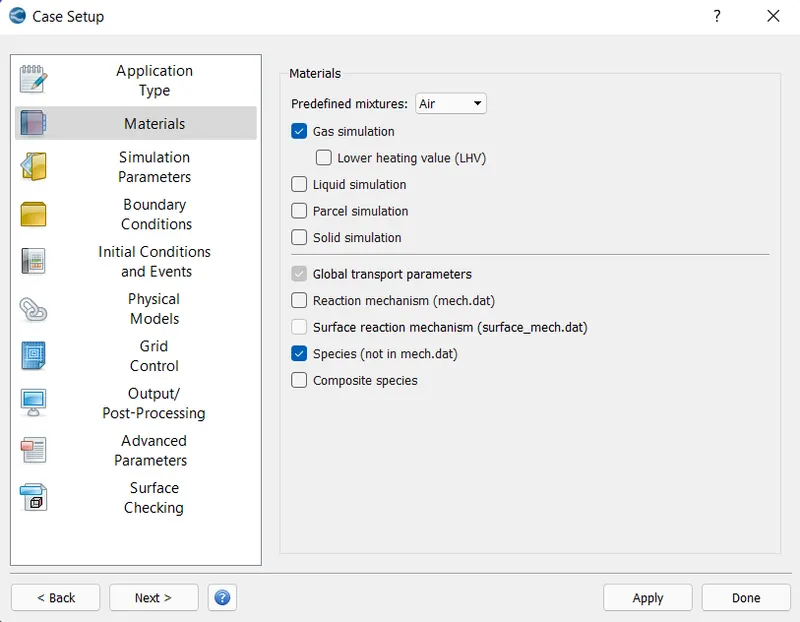
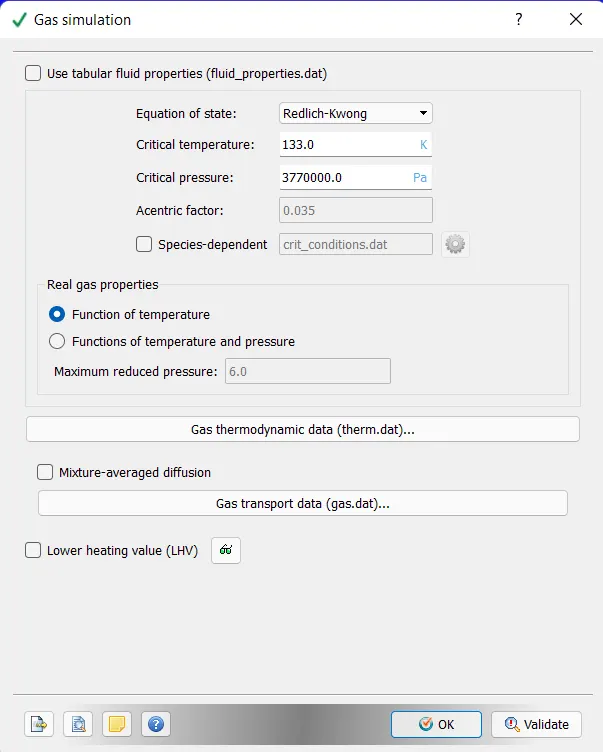
keep the setting in the gas simulation as it is.
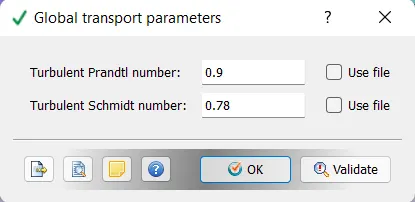
also the global transport parameters are same.
add N2 and O2 in the gas tab to add gas species.
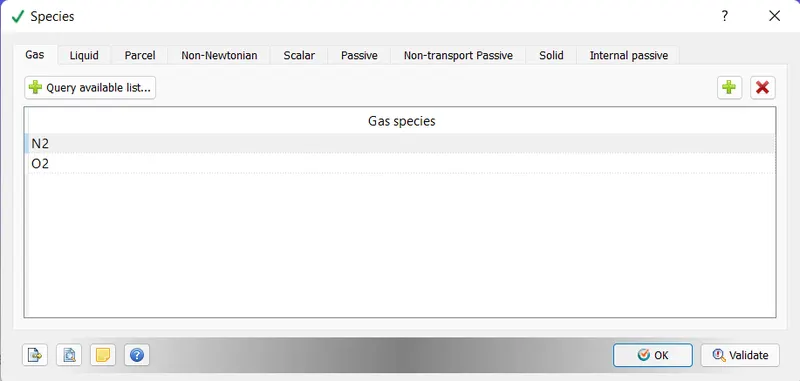
Simulation Parameters:
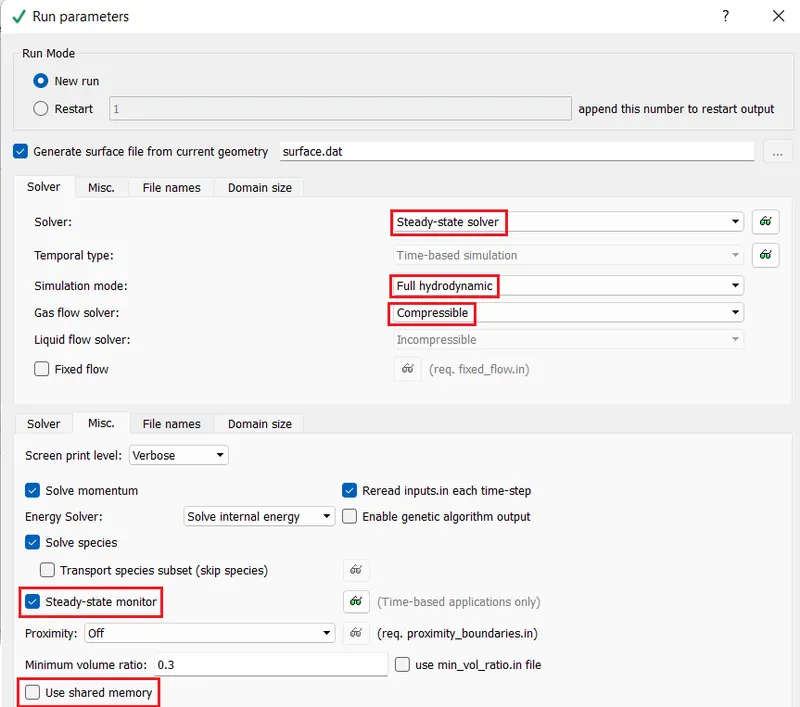
To setup the run parameters select the solver type as steady-state solver with simulation mode as full hydrodynamic and gas flow solver as compressible. now from the Misc. tab turn on the steady-state moniter and turn off the use shared memory option.
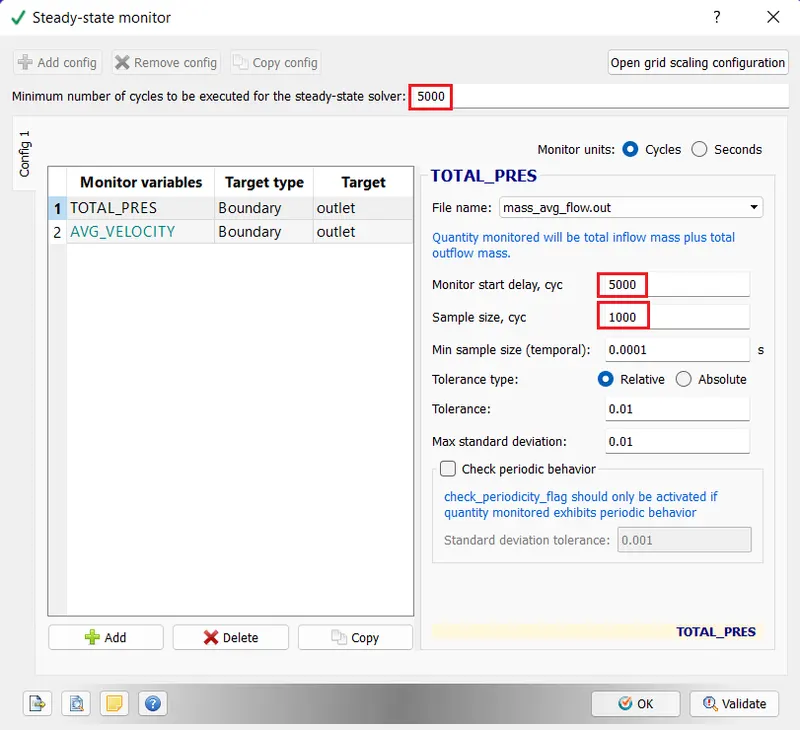
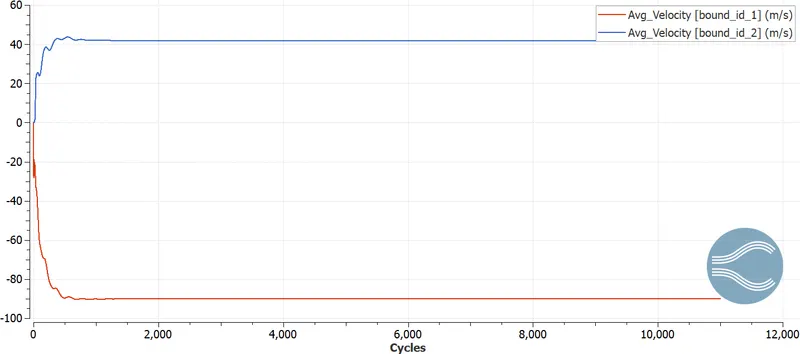
here two steady state moniter we setup at the outlet boundary one for total pressure and another for average velocity. the minimun number of cycles to be exectutes for the steady state solver we kept 5000 and moniter start delay was set as 5000 cycles and smaple size was 1000 cycles.
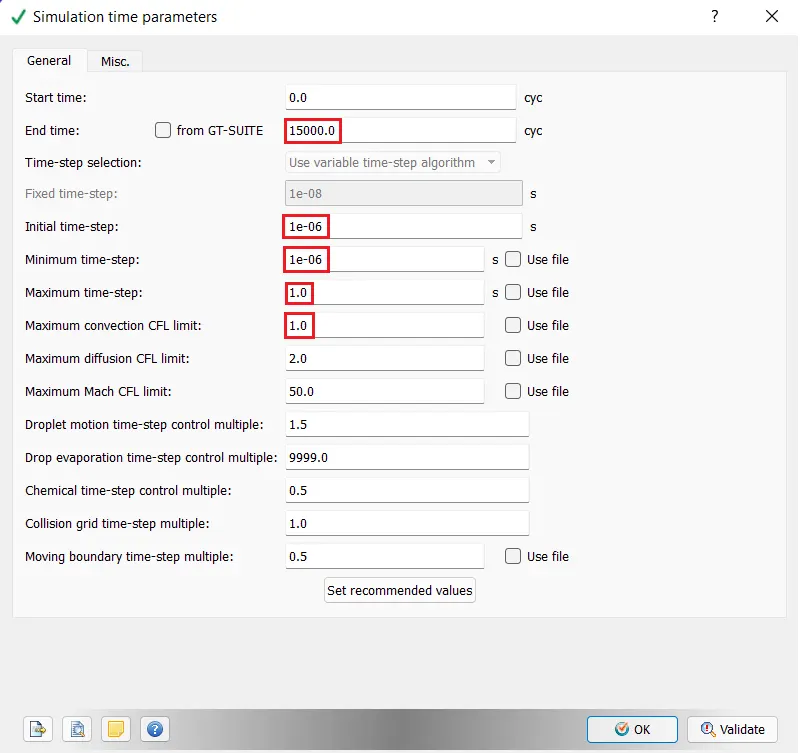
The simulation time parameters have end time as 15000 cycles inital time step as 1e-6 s also the minimum timestep is 1e-6 s and the maximum time step is 1 s.
The maximum convection CFL limit is set to 1.
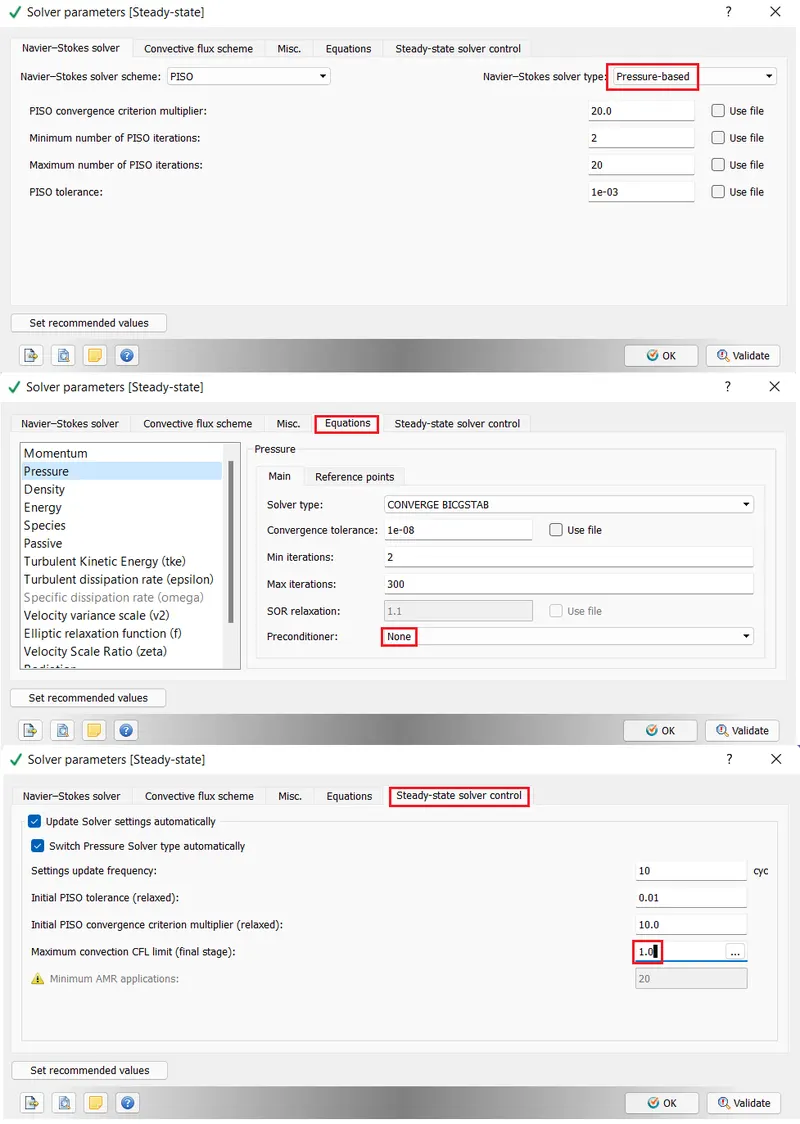
Solver parameters are steup up as shown below. Select the pressure based solver and from the equaiton change the preconditioner for pressure to none and from the steady state solver control set the maximum convection CFL limit as 1.0
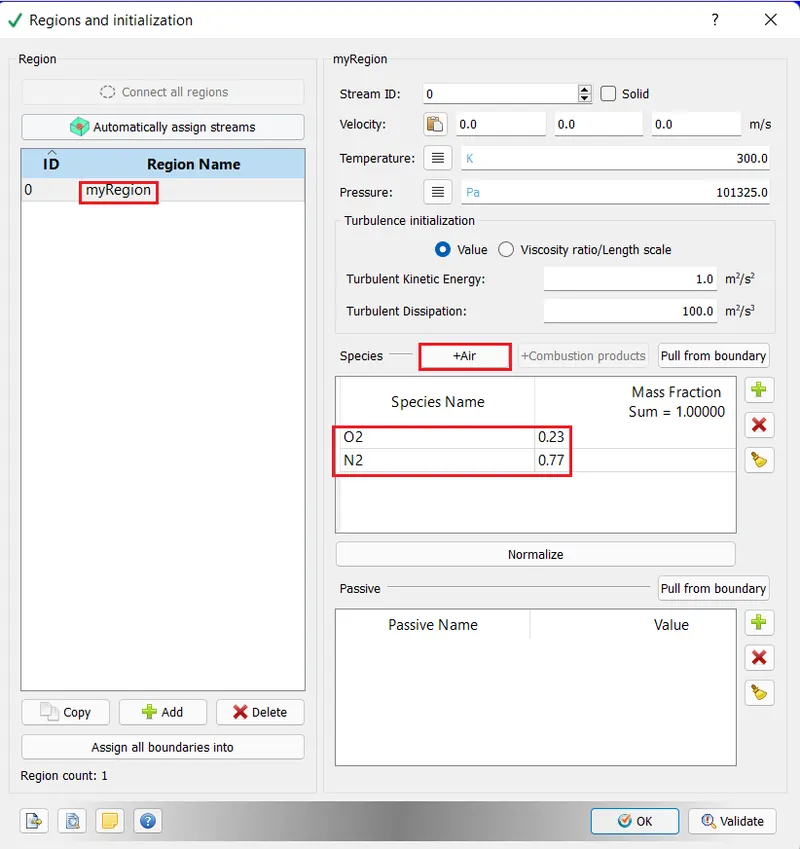
To set the flow region go to regions and initialization and add a region with any user defined region name then for the initialization keep the pressure and temperature the same for the species add air and then the O2 and N2 combination can be see in the table below species.
Boundary Conditions:
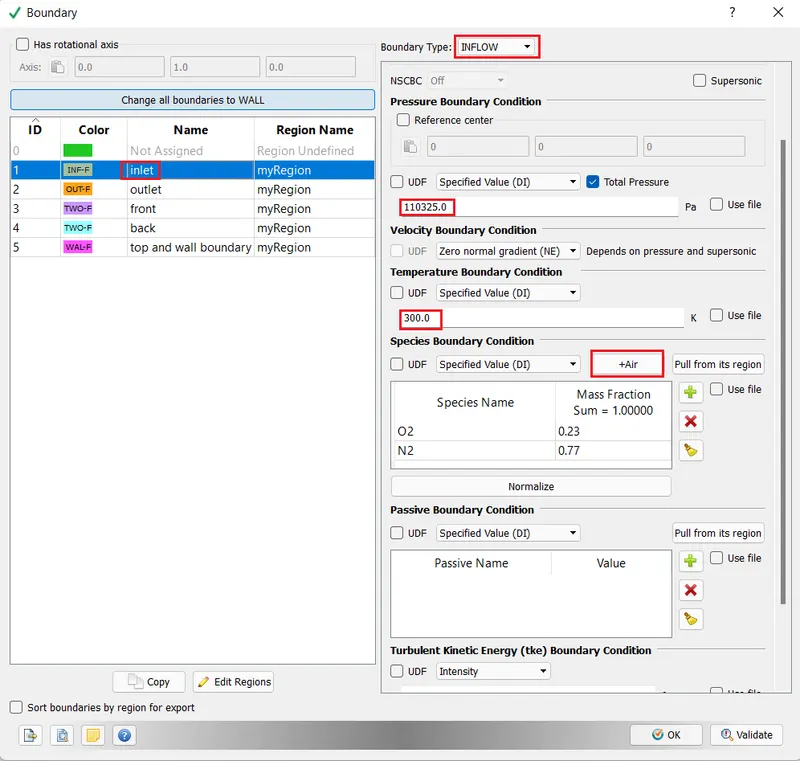
Inlet : for the inlet the boundary type is selected as inflow the pressure is set to 110325 Pa. the temp is 300 K and species is air
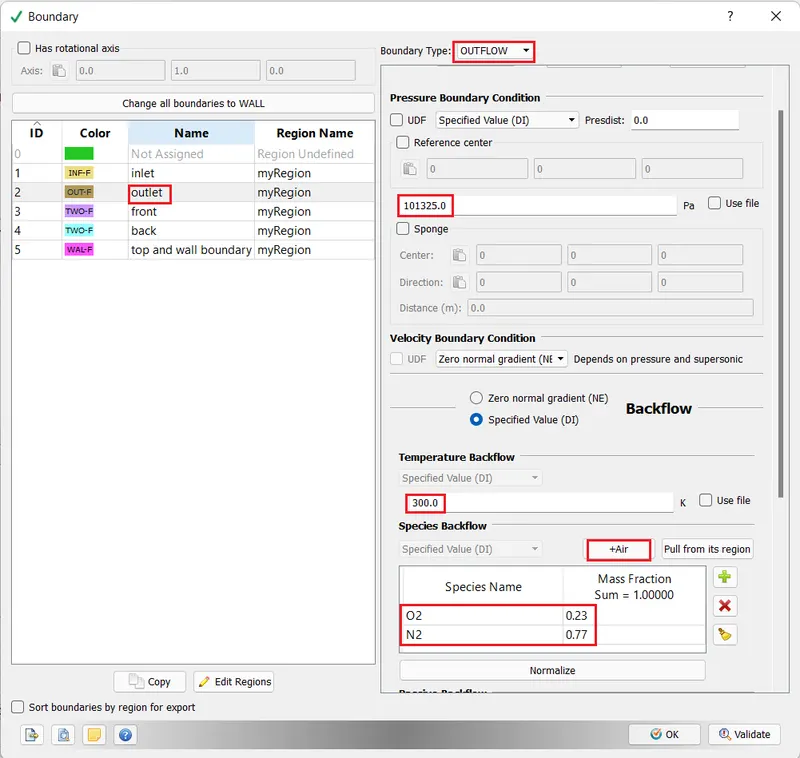
Oultet : the outlet is set to boundary type as outflow with pressure 101325 Pa and temp 300 and species is air.
front and back : The the simulation performed is 2 Dimensional so the front and back boundary are set to two_D .
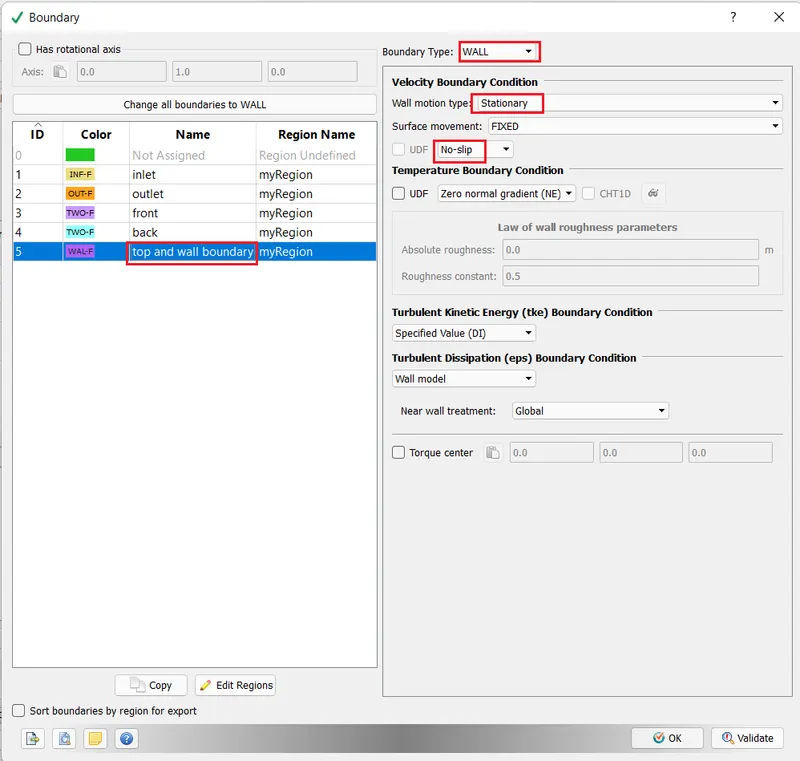
Top and wall Boundary: the top and wall surface are both considered as wall so the boundary type is set as wall and no slip condition is applied to the stationary wall.
Physical Model:
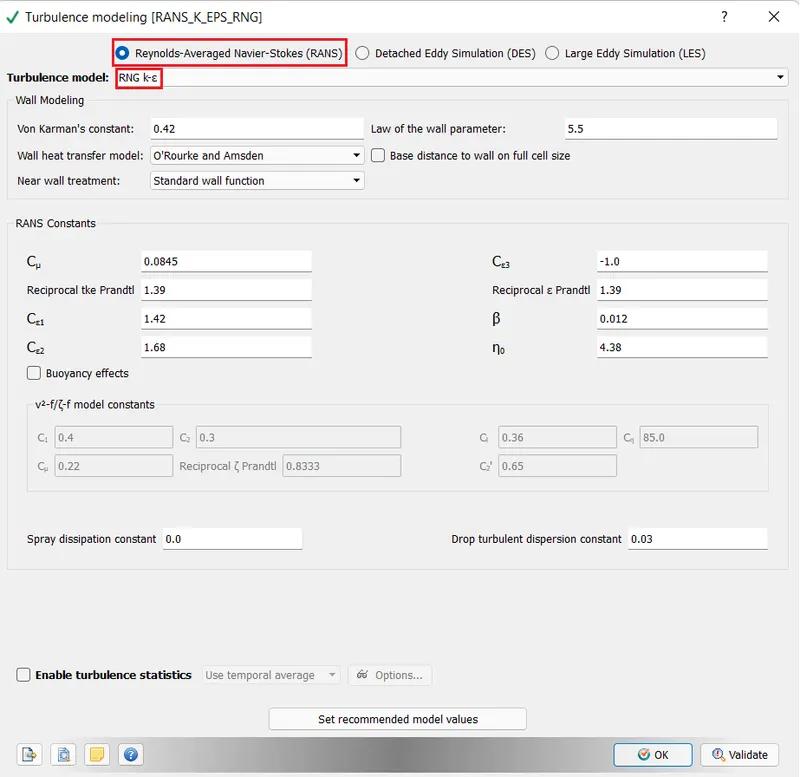
RANS RNG K-epsilon turbulence model is selected while keeping the turbulence modelling turned on from the physical models.
Grid Control:
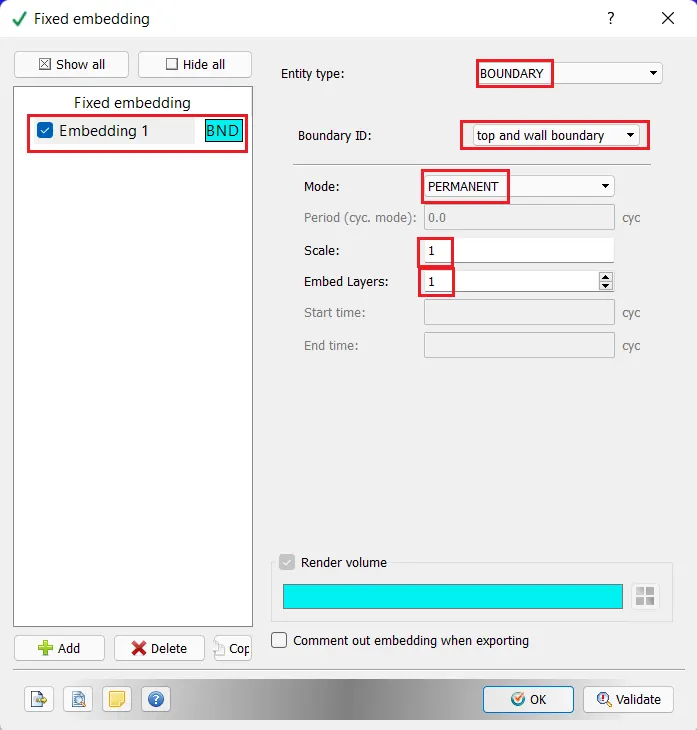
Select the fixed embedding option to add embedding in the grid.
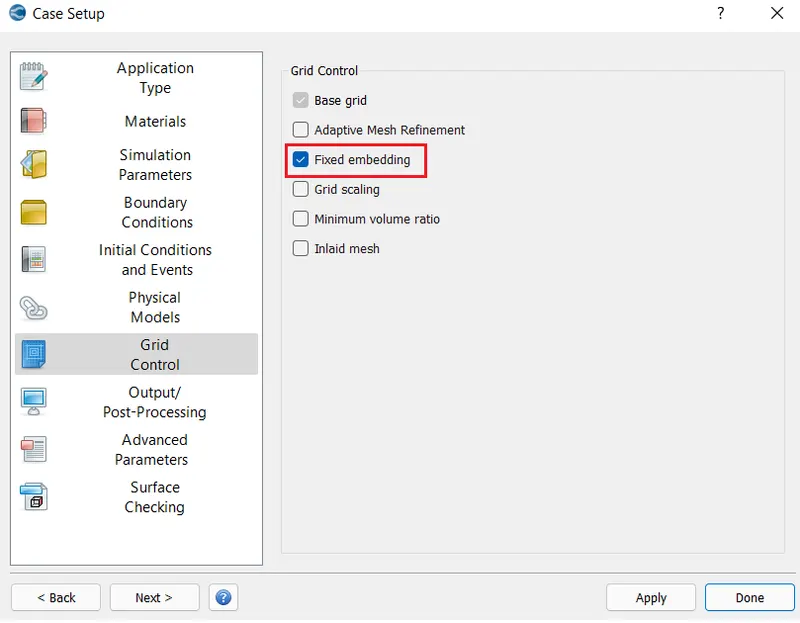
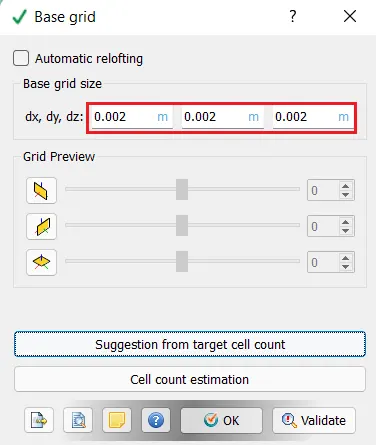
Base Grid has a size of 2e-3 m in x,y,z directions
Add new embedding as Embedding 1 , select the entity type as boundary and giving boundary ID for the top and wall boundary with permanent mode. the embedding has a scale factor of 1 and number of embed layer is also 1.
Output and post files :
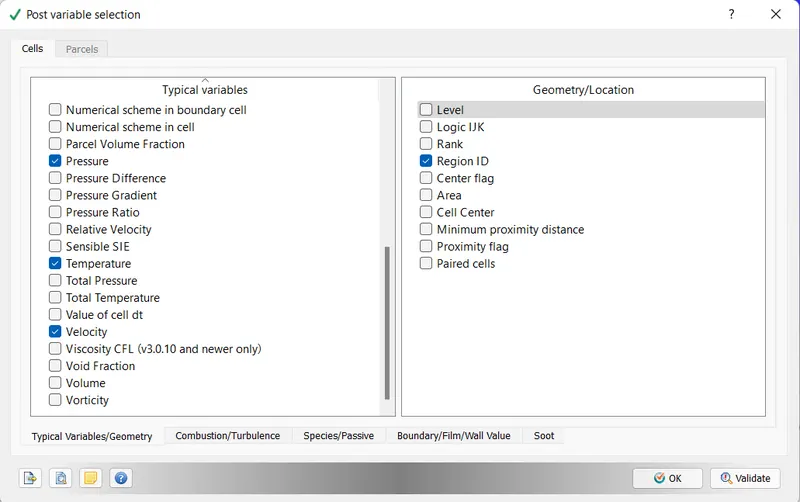
For the post variable selection keep the default variables.
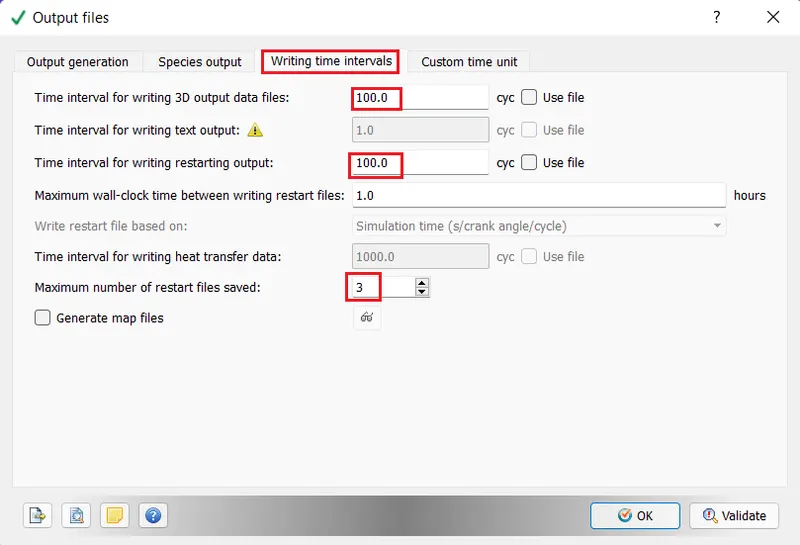
For the output files go to the writing time intervals tab and set the time interval for writing 3D output data files and writing restarting output as 100.0 and keep the maximum number of restart files saved as 3.
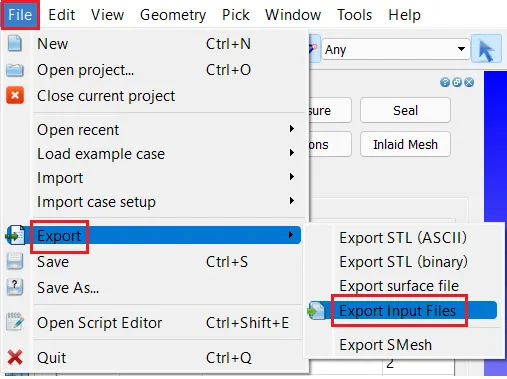
Now the setup is complete and the input files for the simulation can be exported by going to files>>export>>export_input_files and saving them at the desired location.
PROCESSING -
Now open the cygwin terminal with run as administrator and go to the folder where the input files are exported.
Run the simulation using the following command to run the simulation
mpiexec.exe -n 4 converge-intelmpi.exe restricted </dev/null> logfile &the mpiexec.exe is used to run the simulaition command converge-intelmpi.exe in parallel using 4 processors.
This will run the simulation in the background and also write the logfile rather than printing everything on the termiinal.
Using the follwong command the status of the simualtion can be checked .
tail -n 20 logfile Once the simualtion is complete move to the output folder generated in the same location and here the output file can be seen but this files are not compatible for the paraview software so they are converted to the paraview vtk binary format by performing the following command.
mpiexec.exe -n 4 post_convert_30_msmpi_64.exe The post_convert_30_msmpi_64.exe is used to convert the format of the output files. while running the above command it will ask for the name for the file by which they are to be saved and also the format of the output files so give the number for the paraview vtk binary format. Give "all" for the variable to be printed and the output timestep files.
POST-PROCESSING -
here the 3 base mesh sizes used are given in the following table along with the cell count
| Case Number | Base Mesh Size (m) | Cell Count | Pressure(MPa) | Avg_VEL At outlet(m/s) |
| 1 | 2.0e-03 | 1943 | 0.100725 | 41.835 |
| 2 | 1.5e-03 | 2994 | 0.100262 | 44.700 |
| 3 | 1.0e-03 | 5516 | 0.100393 | 44.045 |
Mesh for each case shown below
Case1-
Case2-
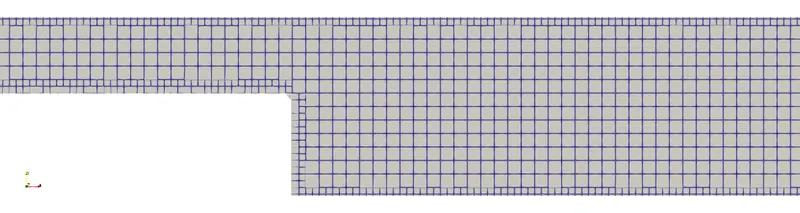
Case3-
Pressure Contours:
Case1-

Case2-
Case3-
Velocity Contours:
Case1-
Case2-
Case3-
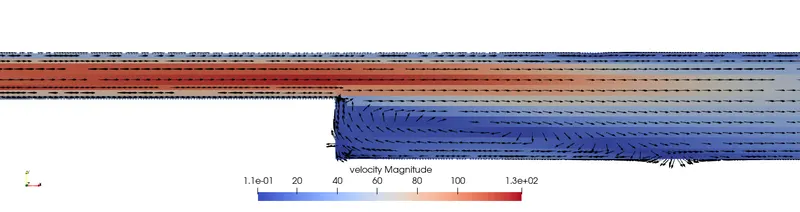
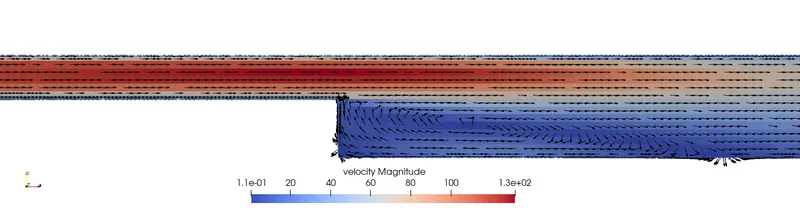
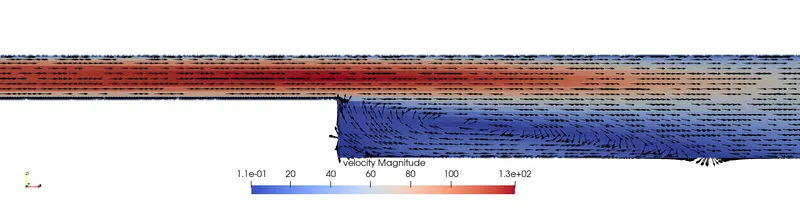
Velocity Vectors:
Case1-
Case2-
Case3-
Velocity Plots:
Case1-
Case2-
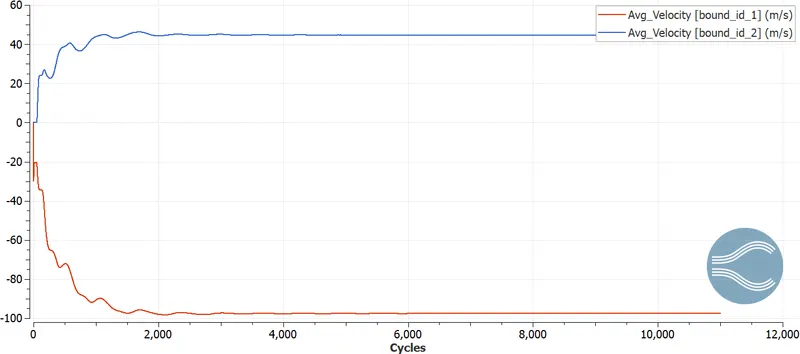
Case3-
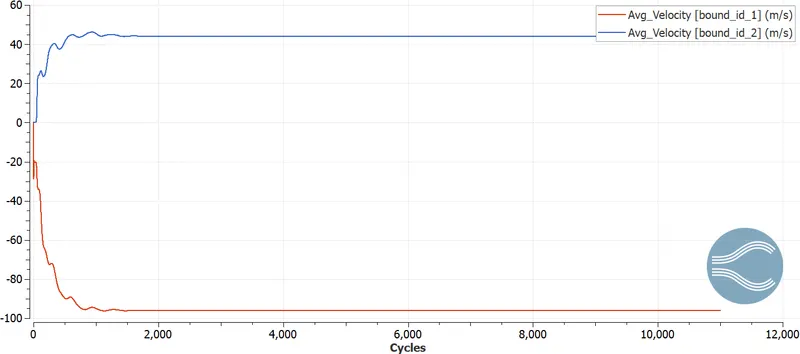
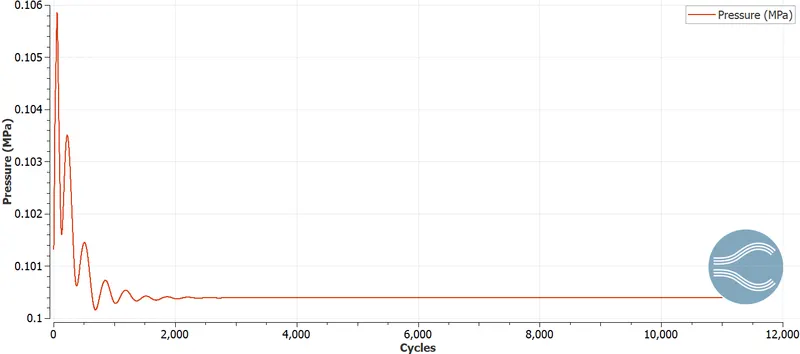
Pressure Plots:
Case1-
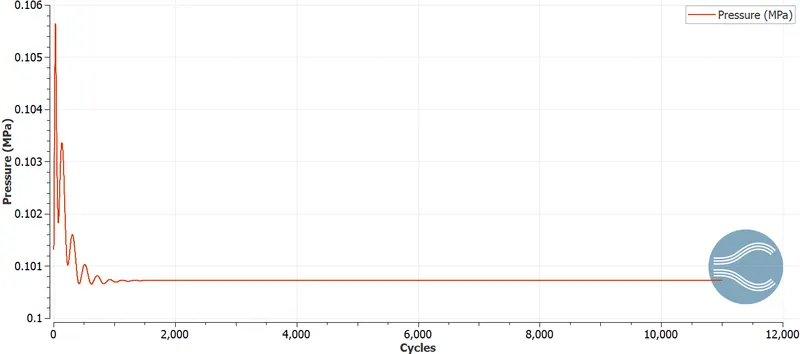
Case2-
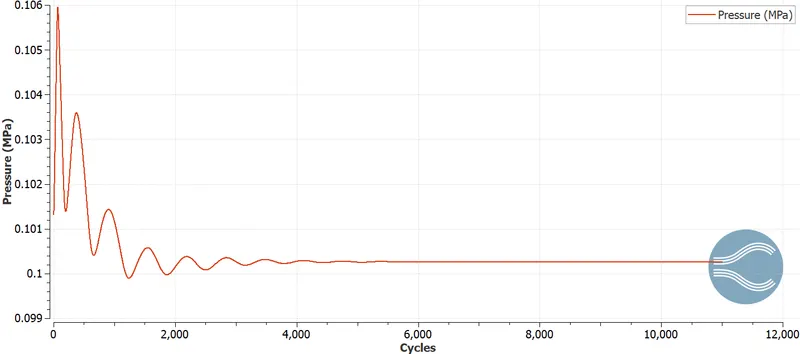
Case3-
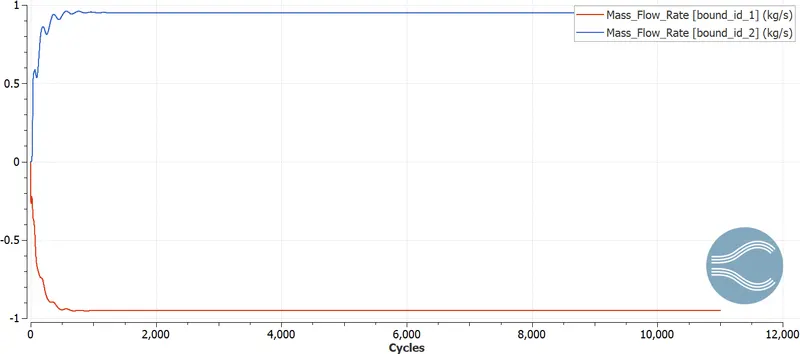
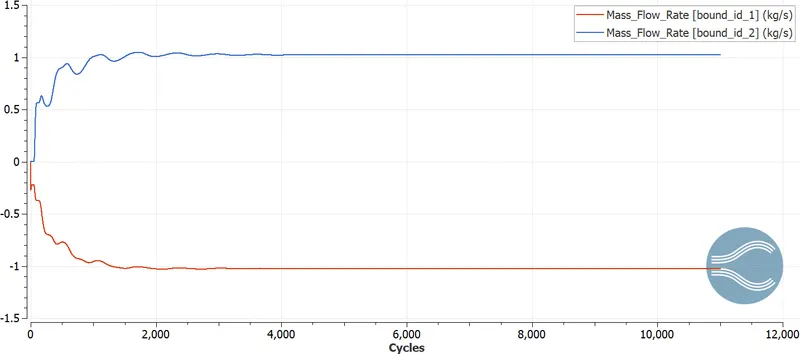
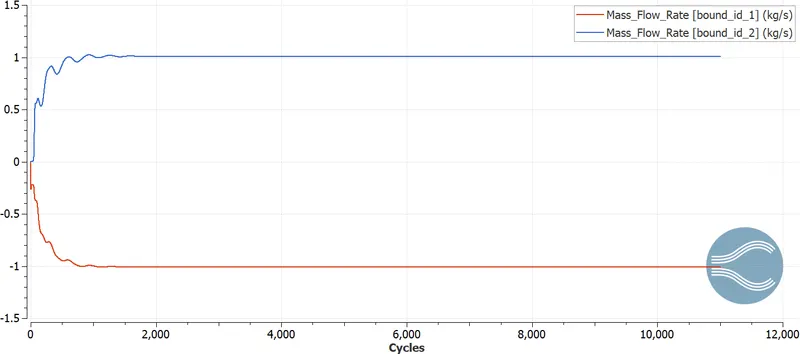
Mass Flow Rate Plots:
Case1-
Case2-
Case3-
Cell Count Plots:
Case1-
Case2-
Case3-
Flow Animations
Case1-
Case2-
Case3-
Why and Where the seperation is taking place?
The Flow seperation is due to the dettachment of the boundary at the sharp edge of the backward facing step. The static pressure at this region reduces and this leads to the formation of recirculation downstream of the step and may also trigger formation of vortices.
CONCLUSION-
- The simulation for the 3 base grid sizes was run for the flow over a backward facing step was run successfully.
- By reducing the size of the base grid the cell count increases.
- The flow seperation takes place at the sharp edge of the backward facing step due to the dettachment of the boundary layer, also there is a ricirculation zone formation downstream of the step.
- With decreasing the base grid size the contour plots are more smoother and refined.
- The results for case 2 and case 3 have very close values for the pressure and velocity at the outlets.