Week-3 Challenge: ADVISOR Tool
AIM : To use the advisor tool for simulation.
OBJECTIVE :
1. For EV_defaults_in file, if cargo mass is 500 kg with all other default conditions, can the vehicle travel for 45 km with FTP drive cycle? Conclude your observations.
2. In the above case, try changing the battery capacity and repeat the simulation.
3. Perform gradeability test with PRIUS_Jpn_defaults_in file
Compare your results in table and conclude.
CONCEPT :
Advisor Tool, which was developed in November 1994 by the national renewable energy laboratory allows users to simulate and analyse conventional advanced light and heavy vehicles including hybrid electric and fuel cell vehicles. the tool allows users to assess the effect of changes in vehicle components such as Motors battery catalytic converter climate control systems and alternative fuel and other modifications that might affect fuel economy performance or omission. It is a set of models data and script text files for use with Matlab and simulink.
The benefit of using advisor Tool are
1. Estimate the fuel economy of vehicles that have not yet built
2. Learn about how conventional hybrid or electric vehicles use energy throughout their drive trains.
3. Compare relative tailpipe emissions produced on a number of cycles.
4. Evaluate and energy management strategy for your hybrid vehicles fuel converter.
5. Optimise the gear ratios in your transmission to minimise fuel use or maximise performance etc.
How to start the adviser tool
1. Launch Matlab and first set default location folder to the advisor
2. Now in the command window of Matlab type advisor and press enter
3. A new window will open and then set metric for unit and start advisor
4. It will launch in a new window
Advisor tool have three windows:
1. Vehicle input window
2. Simulation parameter window
3. Results Window
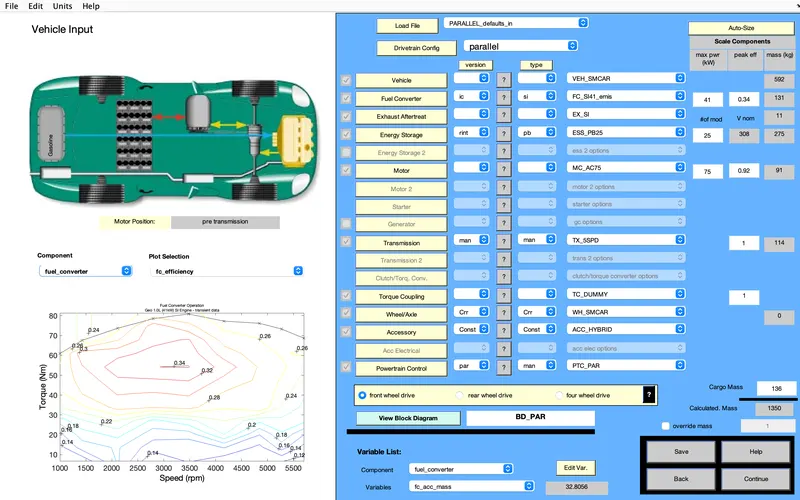
Question (1) For EV_defaults_in file, if cargo mass is 500 kg with all other default conditions, can the vehicle travel for 45 km with FTP drive cycle? Conclude your observations
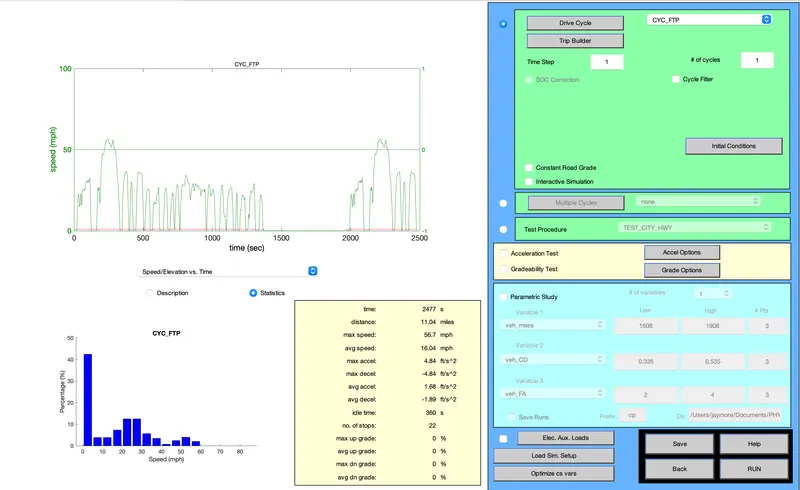
And after we run this program
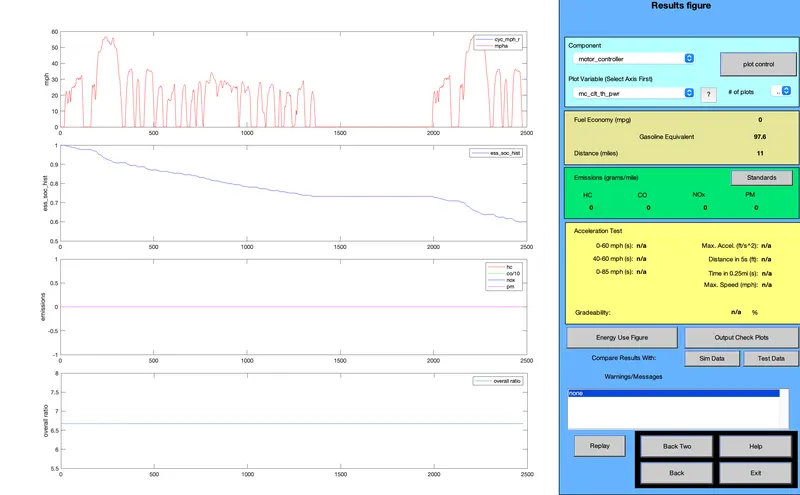
the distance travelled by vehicle in one drive cycle is 11Miles or 17km. Used almost 40% SOC.
Increasing number of drive cycle by 2
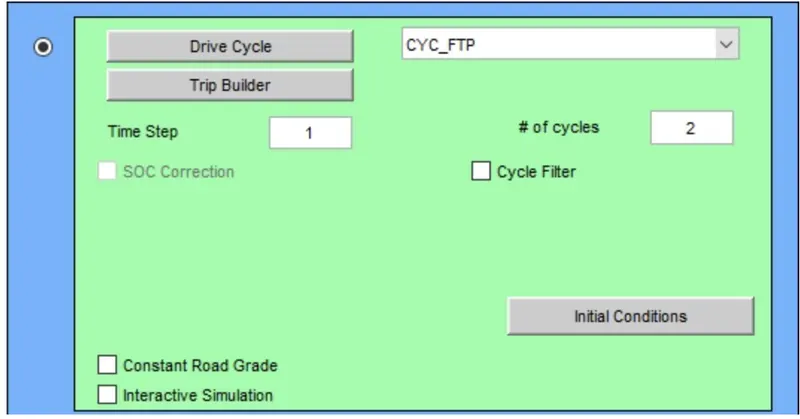
Now results with two drive cycles,
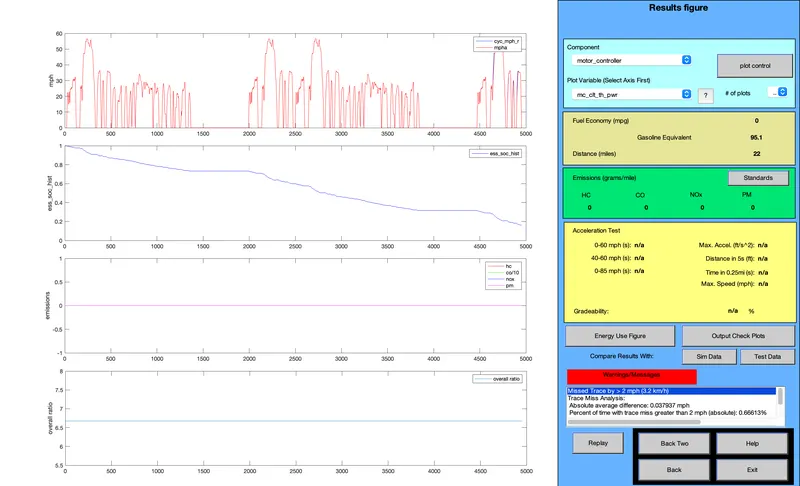
The distance travelled by vehicle in 2 drive cycle is 22 miles i.e 35KM.
Now increasing number of drive cycles to 3
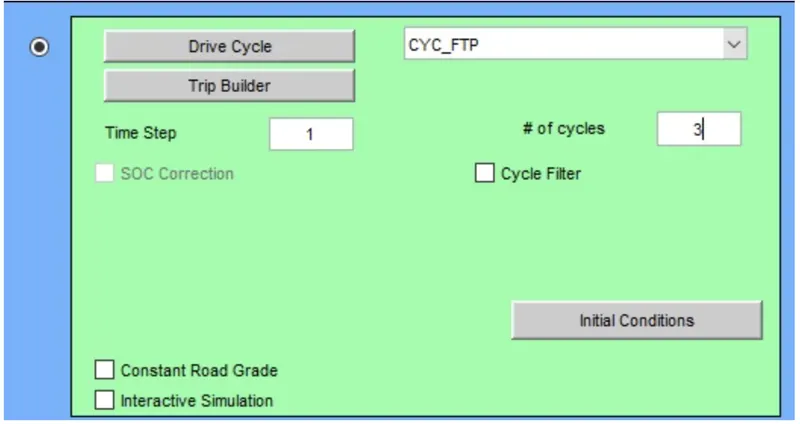
Now the results with 3 drive cycles are
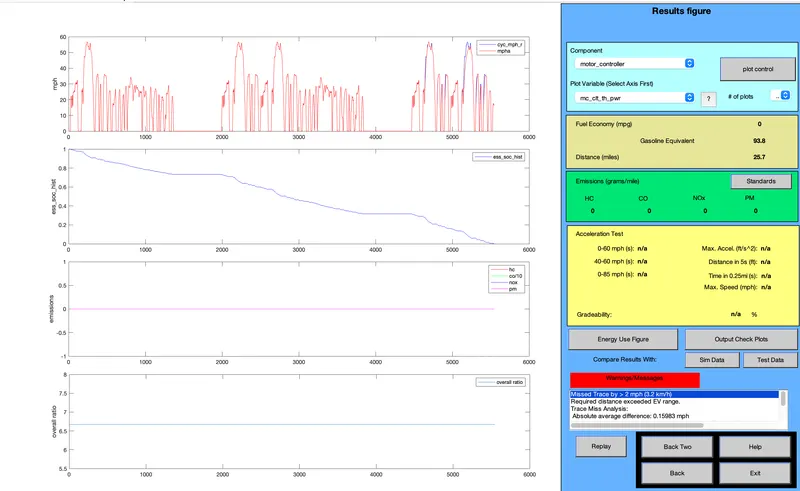
The distance travelled by vehicle in 3 drive cycle is 25.7 miles i.e 41.4KMs.
Results :
No of drive cycles Distance covered(Kms)
1 17Km
2 35Km
3 41Km
Question (2) - In the above case, try changing the battery capacity and repeat the simulation.
Vehicle input
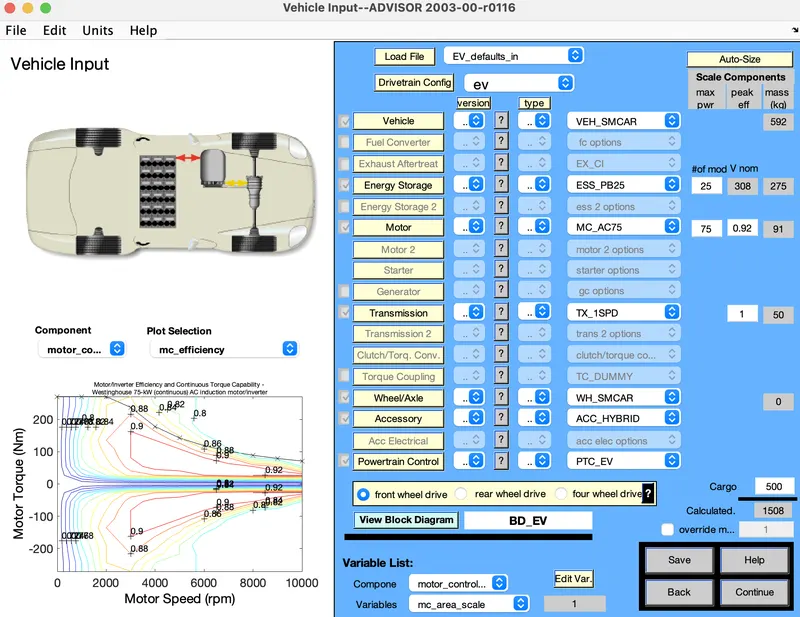
A new simulation parameter will open, here we will change the drive cycle to 2 or 3 and run the simulation one at a time
After the completion of simulation we can see the result window where we can see change in distance of vehicle travel.
We can repeat the simulation by changing battery module and drive cycle.
(1) Energy storage system with 26 modules and 2 drive cycles
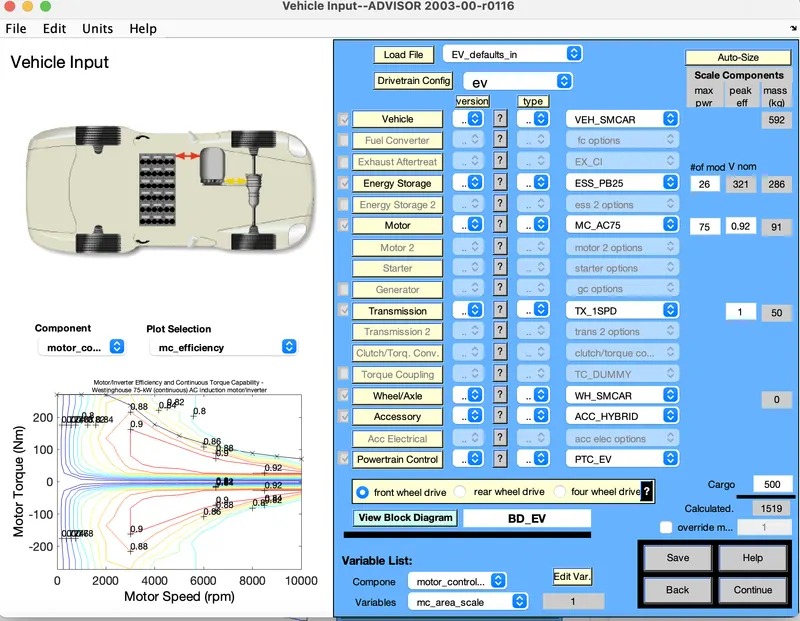
After we run the program we get the follwoing output
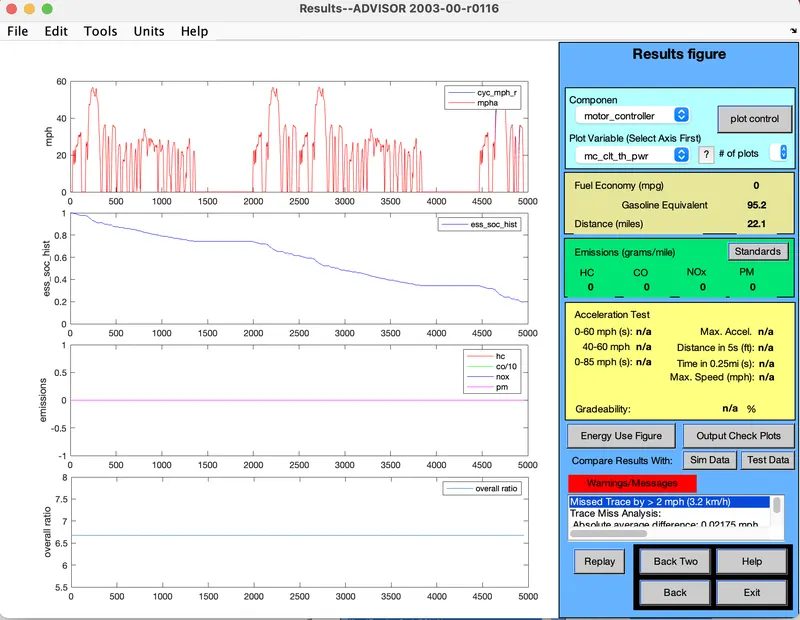
(2) Energy storage system with 27 modules and 2 drive cyles.

OUTPUT : 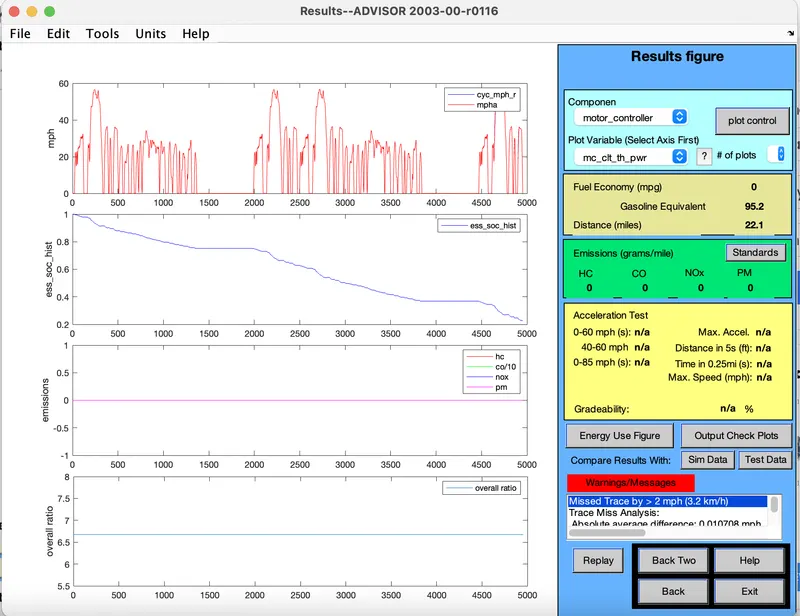
(3) Energy storage system with 28 modules and 2 drive cycles :

OUTPUT : 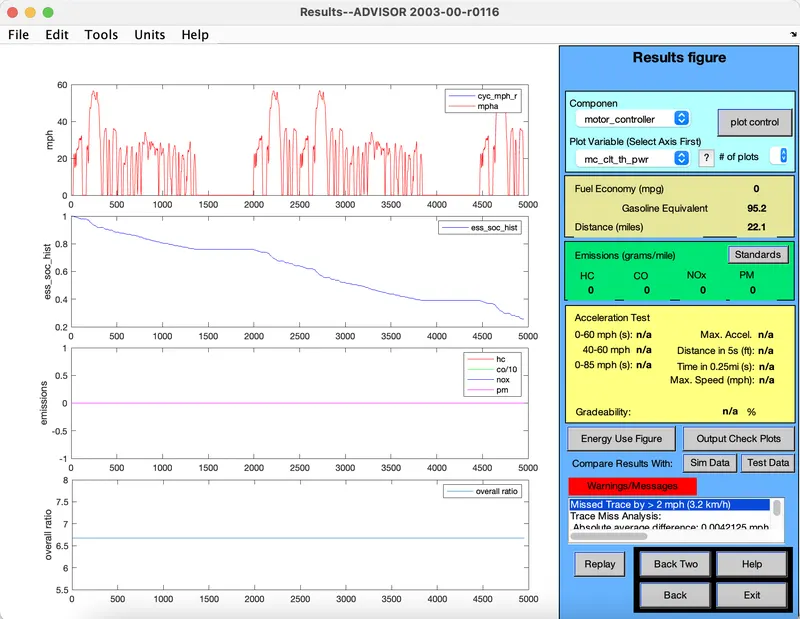
(4)Energy storage system with 26 modules and 3 drive cycles

OUTPUT :
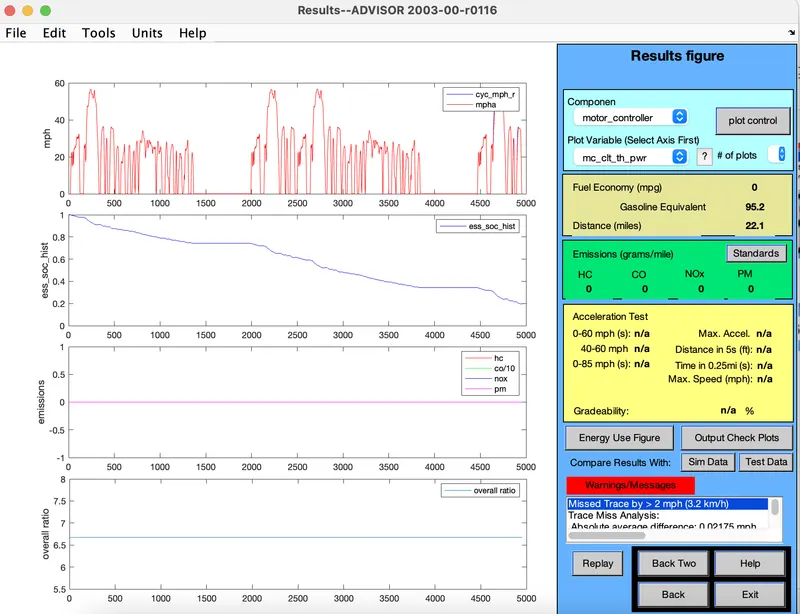
(5) Energy storage systems with 27modules and 3 drive cycles :

OUTPUT :
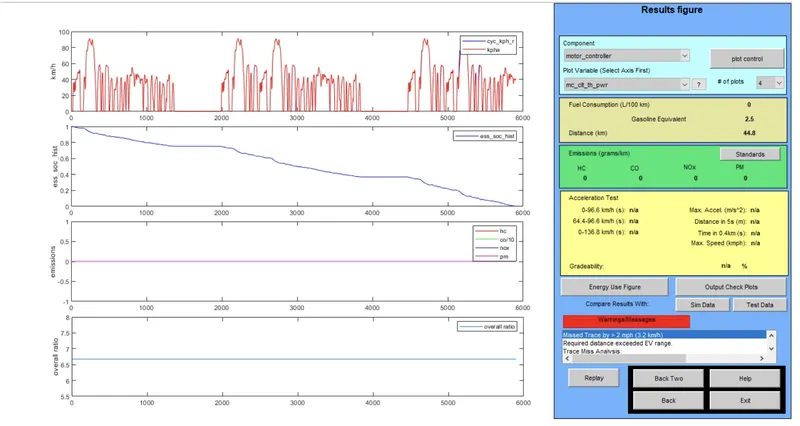
(6) Energy storage system with 28 modules and 3 drive cycles :

OUTPUT : 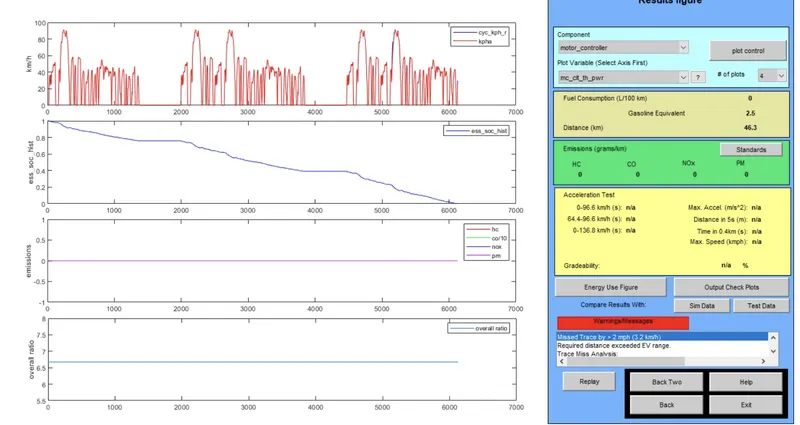
DRIVE CYCLE 2
Battery mod voltage km battery weight
26 321 35 286
27 333 35 297
28 345 35.5 308
DRIVE CYCLE 3
batery Mod Voltage KM Battery weight
26 321 42.7 286
27 333 44.8 297
28 345 46.3 308
QUESTION (3) Perform gradeability test with PRIUS_Jpn_defaults_in file
Compare your results in table and conclude.
In advisor tool we selelcted prius vehicle option and then selected grade options. then,
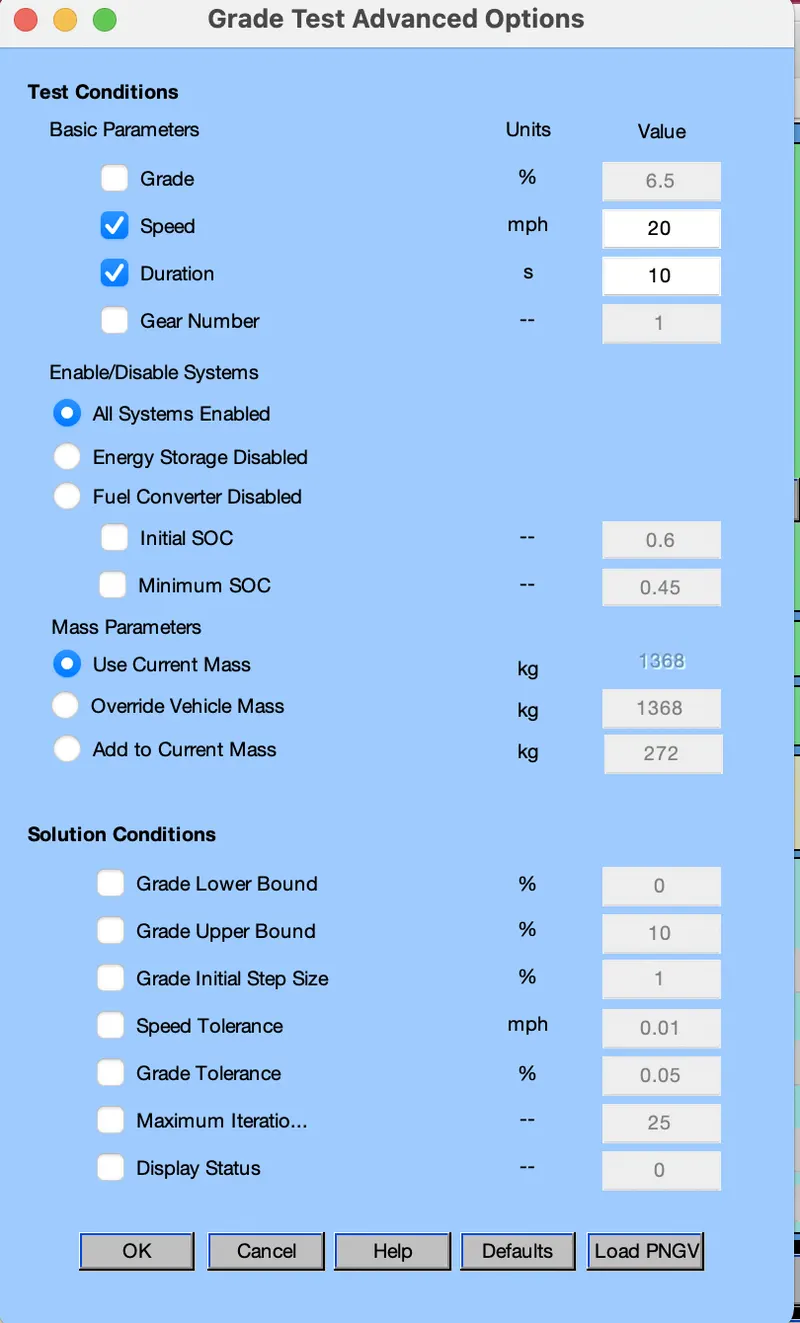
Now we will see Results for duration 10 seconds
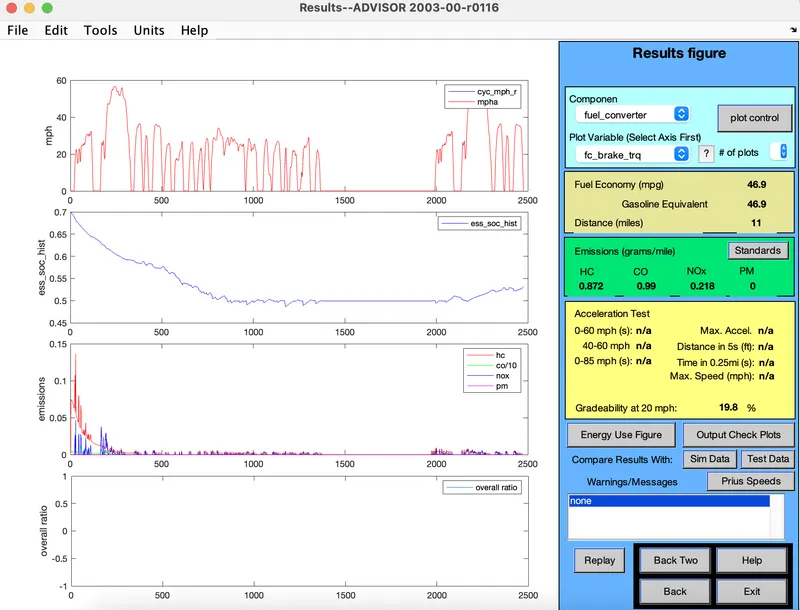
(1) Speed - 20Miles/Hour or 32 km/H
Gradeability - 19.8%
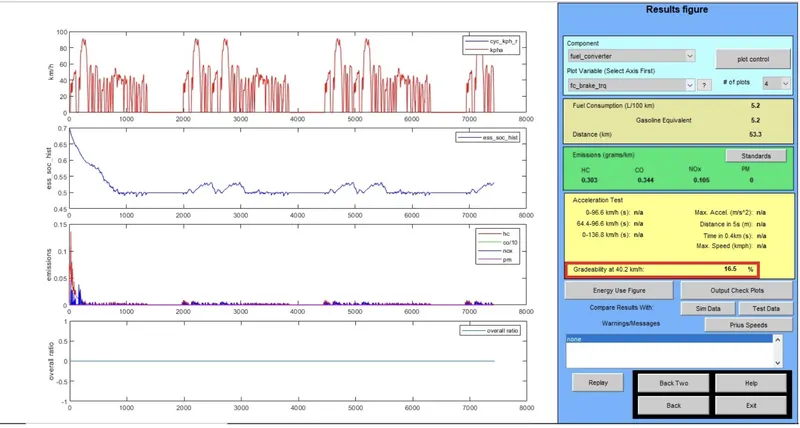
(2) Speed -25miles/hour
Gradeability - 16.5%
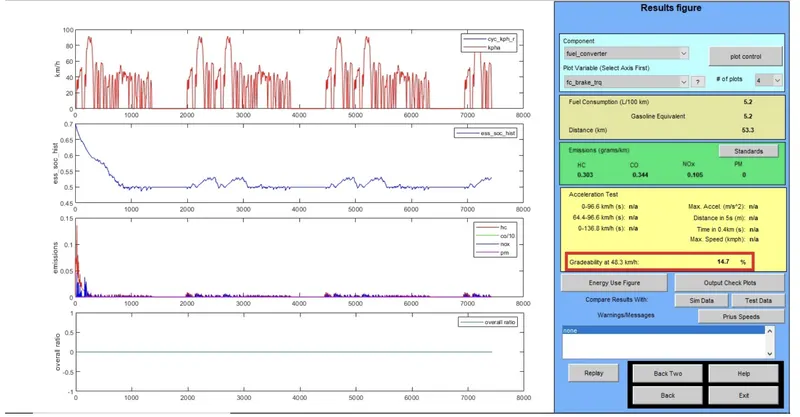
(3) Speed - 30miles/hour
Gradeability - 14.7%
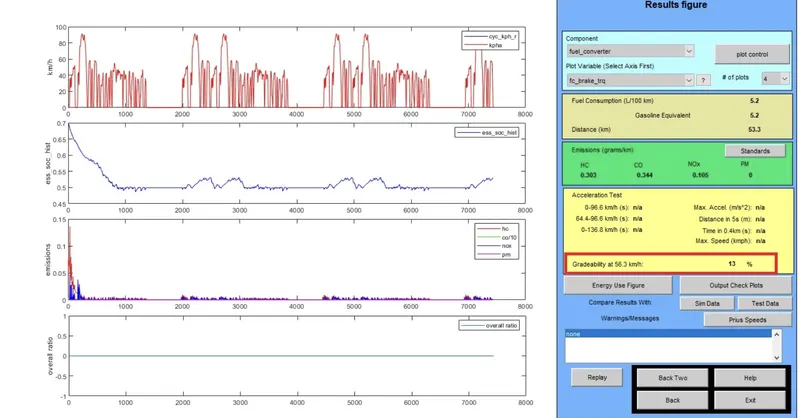
(4)Speed at 35miles/hour
Gradeability - 13%
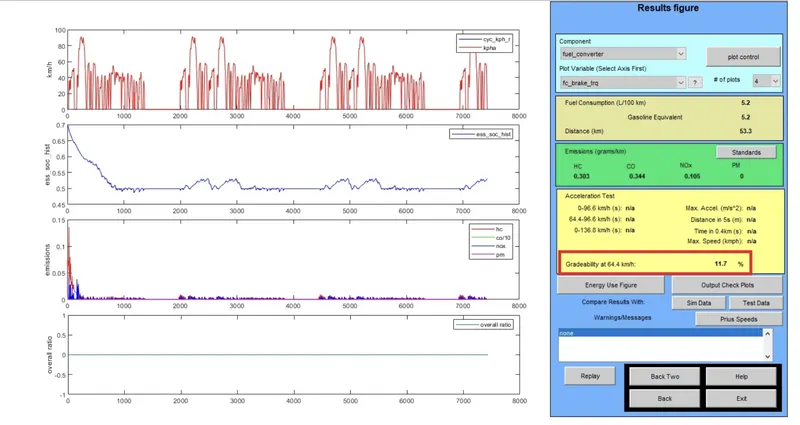
(5) Speed at 40miles/hour
Gradeability - 11.7%
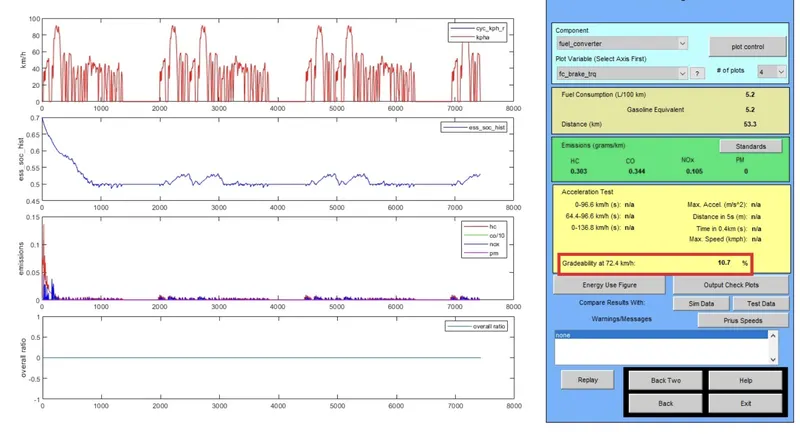
(6) Speed at 45miles/Hour
Gradeability - 10.7%
For duration 10 seconds
vehicle speed(mph) Vehicle Speed (kmh) Gradeability(%)
20 32.2 19.8
25 40.2 16.5
30 48.3 14.7
35 56.3 13.0
40 64.4 11.7
45 72.4 10.7
Now we will see the results for duration of 20 Seconds
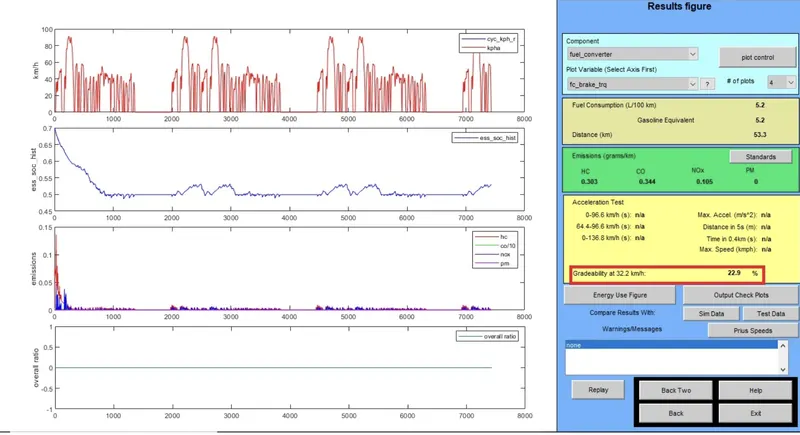
(1) Speed at 20miles/hour
Gradeability - 22.9%
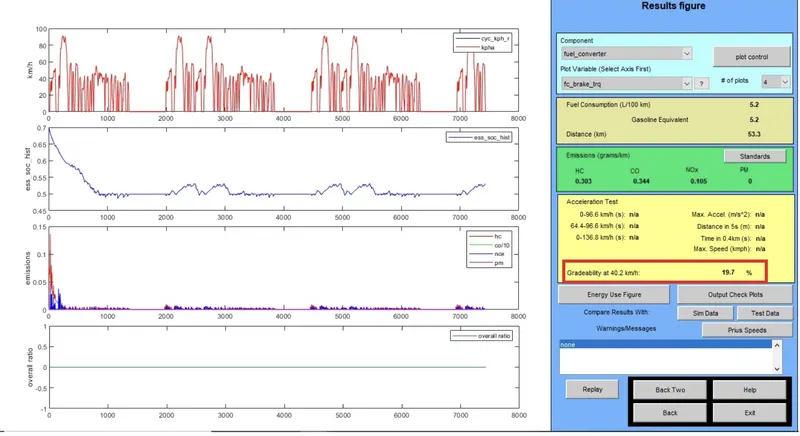
(2) Speed at 25miles/hour
Gradeability - 19.7%
(3) Speed at 30mikles/hour
Gradeability - 17.7%
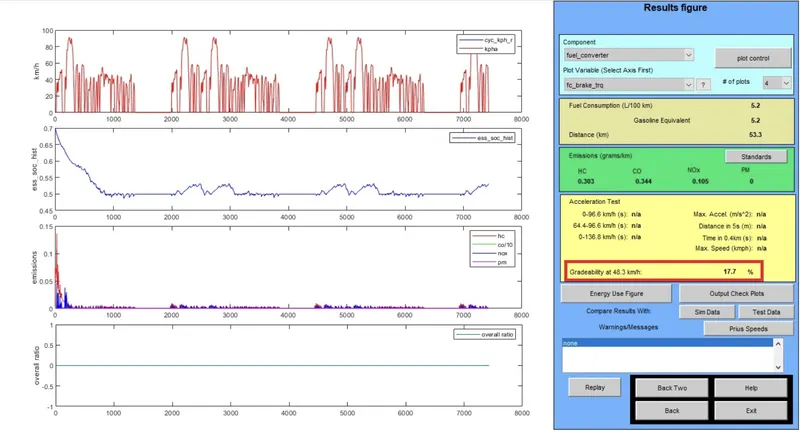
(4) Speed at 35 miles/hpour
Gradeability - 16.0%
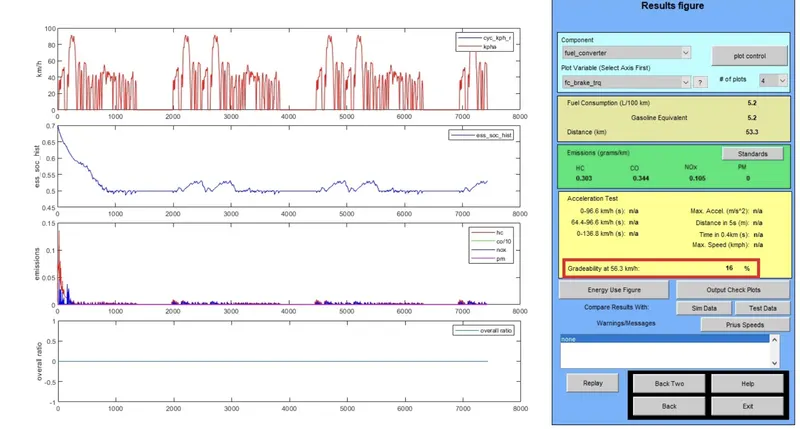
(5) Speed at 40 miles/hour
Gradeability - 14.6%
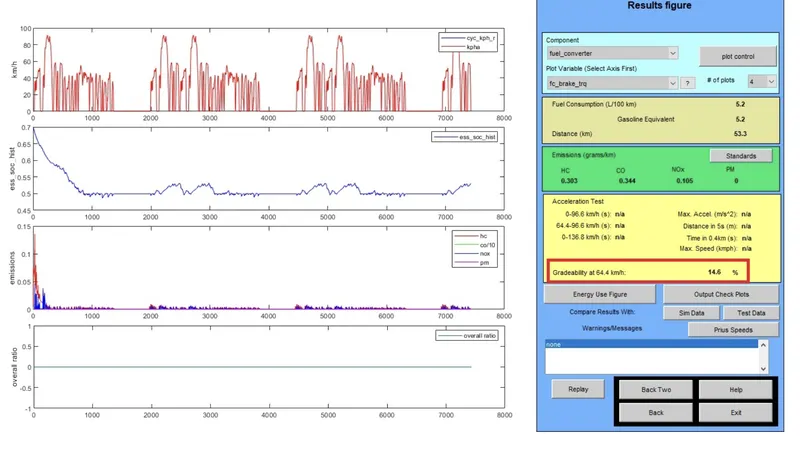
(6) Speed at 45 miles/hour
Gradeability - 13.4%
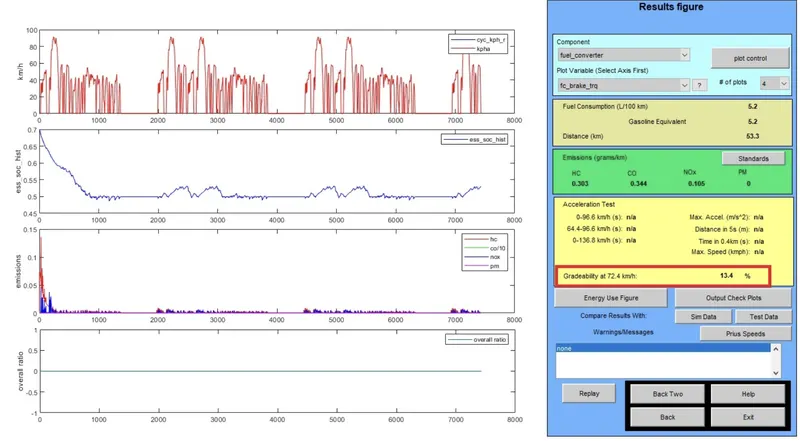
For duration 20 seconds
vehicle speed(mph) Vehicle Speed (kmh) Gradeability(%)
20 32.2 22.9
25 40.2 19.7
30 48.3 17.7
35 56.3 16.0
40 64.4 14.6
45 72.4 13.4
CONCLUSION : from above results we can see that when vehicle speed increase there is a decrease in gradeability for both 10 and 20 seconds.