Project 1 - Parsing NASA thermodynamic data
AIM : To write a code to parse the NASA thermodynamic data file and then calculate the thermodynamic properties of different gas species.
OBJECTIVE : To write a function that extracts the 14 coefficients and calculates the enthalpy, entropy and specific heats for all the species in the NASA thermodynamic data file THERMO.dat
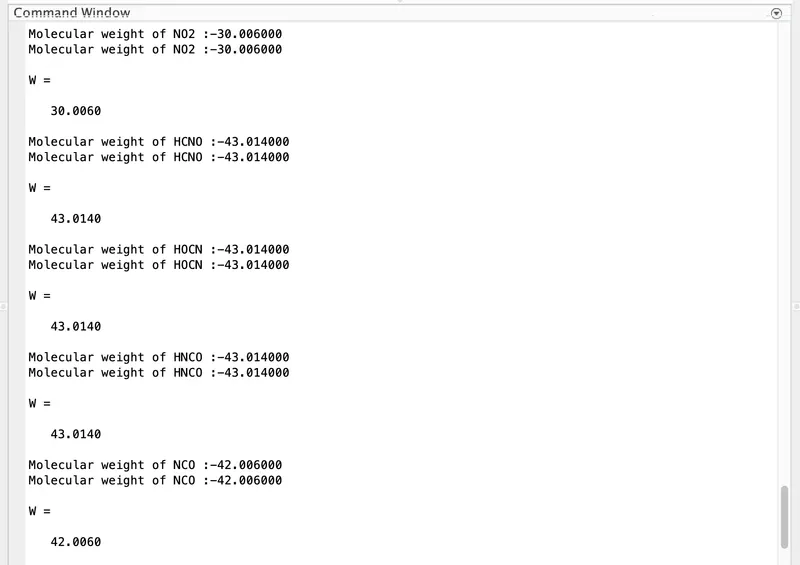
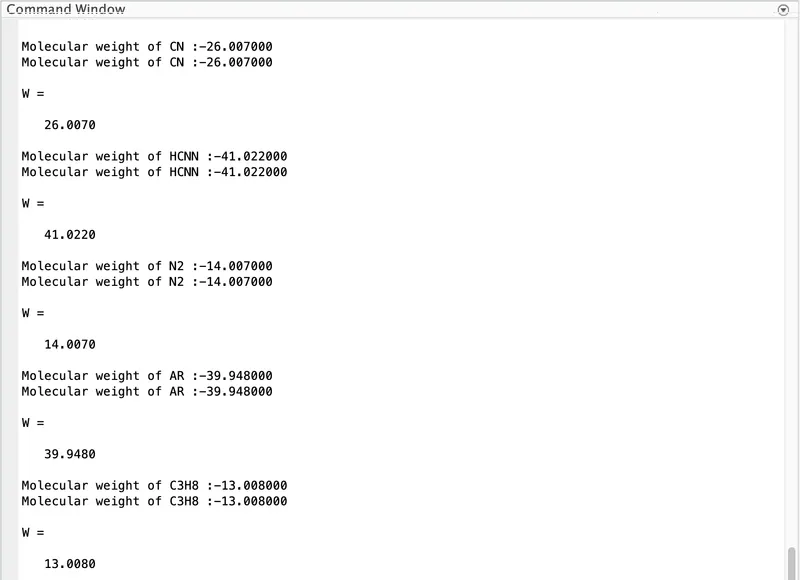
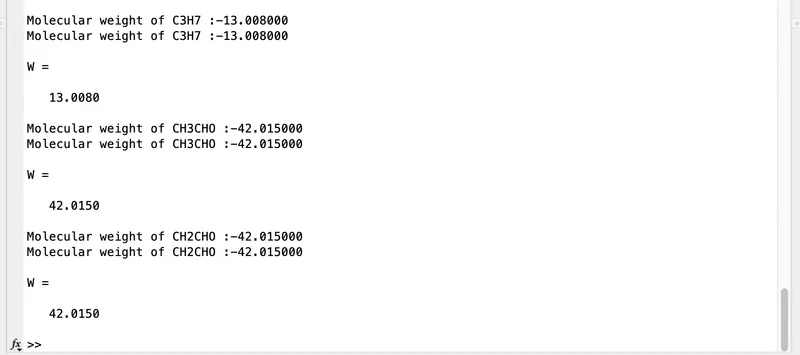
Calculate molecular weight of each species.
Plotting specific heat, enthalpy and entropy for local temperature range.
To save the plots as images with proper names and store them in seperate folders for each species with suitable name.
The nasa polynomials has the following form
Cp/R = a1 + a2T + a3 T^2 + a4T^3 + a5T^4
H/RT = a1 + a2T/2 + a3 T^2 + a3 T^2/3 + a4T^3/4 + a5T^4/5 + a6/T
S/R = a1 lnT + a2T + a3 T^2/2 + a3T^2/2 + a4T^3/3 + a5T^4/4 + a7
where R is universal gas constant and T is temperature.
CONCEPT FOR FILE PARSING:
Data parsing is the process of taking data in one format and transforming it to another format. File parsing is a string or symbol either in natural language computer language or data structure conferning to the rules of former grammer.
NASA THERMODYNAMIC FILE :
Thermo.dat file is a data file containing 14 coefficients for 53 elements. we will use These coefficients to calculate the specific heat, enthalpy and entropy for particular element.
DATA SOURCE : https://drive.google.com/file/d/1AikCHDlz9s_fu8whE81qee_GD4AyYpCP/view
MATHEMATICAL EQUATIONS FOR ENTHALPY, ENTROPY AND SPECIFIC HEAT.
ENTHALPY :
H/RT = a1 + a2T/2 + a3 T^2 + a3 T^2/3 + a4T^3/4 + a5T^4/5 + a6/T
SPECIFIC HEAT :
It is the amount of per unit mass rquired to raise the temperature by one degree celsius.
It is given by the exprrssion
S/R = a1 lnT + a2T + a3 T^2/2 + a3T^2/2 + a4T^3/3 + a5T^4/4 + a7
Where R is universal gas constant and a1,a2,a3,a4,a5,a6,a7 are numerical coefficients supplied in the thermodynamic file. the first seven coefficients re high temperature coefficients and second 7 coefficients are low temperature coefficients.
MAIN CODE :
clear all
close all
clc


%INPUTS
R = 8.314;   %GAS CONSTANT

%READING DATA FILE
% OPEN FILE AND READ THERMO.dat file
f1 = fopen('THERMO.dat','r')
get = fgetl(f1);

%READING TEMPERATURES
temp = fgetl(f1);

%SPLITTING
s = strsplit(temp);

%CONVERTING STRING CELLS TO NUMBERS
templow  = str2num(s{2});
tempmid  = str2num(s{3});
temphigh = str2num(s{4});

%TEMPERATURE RANGE
T = linspace(templow,temphigh,1000);


%SKIPPING COMMENT LINES

for i=1:3
    get = fgetl(f1);
end

% READING SPECIES
for j = 1:53
    tline = fgetl(f1);

    %SPLITTING INTO CELL ARRAY
    A = strsplit(tline, ' ');
    species = (A{1});

    %CONVERTING STRING TO NUMBER
    lowtemp = str2num(A{end-3});
    midtemp = str2num(A{end-2});
    hightemp = str2num(A{end-1});


    tline1 = fgetl(f1);
    a= strfind (tline1,'E');

    %FINDING FIRST 7 HIGHER AND SECOND 7 LOWER CONDTIONS
    %FOR HIGHER COEFFICIENTS
    a1 = tline1(1:a(1)+3);
    a1 = str2num(a1);
    a2 = tline1(a(1)+4:a(2)+3);
    a2 = str2num(a2);
    a3 = tline1(a(2)+4:a(3)+3);
    a3 = str2num(a3);
    a4 = tline1(a(3)+4:a(4)+3);
    a4 = str2num(a4);
    a5 = tline1(a(4)+4:a(5)+3);
    a5 = str2num(a5);

    tline2 = fgetl(f1);
    b = strfind(tline2, 'E');
    a6 = tline2(1:b(1)+3);
    a6 = str2num(a6);
    a7 = tline2(b(1)+4:b(2)+3);
    a7 = str2num(a7);

    %FINDING LOWER COEFFICINETS
    a8 = tline2(b(2)+4:b(3)+3);
    a8 = str2num(a8);
    a9 = tline2(b(3)+4:b(4)+3);
    a9 = str2num(a9);
    a10 = tline2(b(4)+4:b(5)+3);
    a10 = str2num(a10);

    tline3 = fgetl(f1);
    c = strfind(tline3,'E');
    a11= tline3(1:c(1)+3);
    a11 = str2num(a11);
    a12 = tline3(c(1)+4:c(2)+3);
    a12 = str2num(a12);
    a13 = tline3(c(2)+4:c(3)+3);
    a13 = str2num(a13);
    a14 = tline3(c(3)+4:c(4)+3);
    a14 = str2num(a14);

    %CALCULATION FOR SPECIFIC HEAT
    Cp = specific_heat(a1,a2,a3,a4,a5,a8,a9,a10,a11,a12,T,R,tempmid);


    %CALC ENTHALPY
    H = enthalpy(a1,a2,a3,a4,a5,a6,a8,a9,a10,a11,a12,a13,T,R,tempmid);

     %CALC ENTROPY
    S = entropy(a1,a2,a3,a4,a5,a8,a9,a10,a11,a12,a14,T,R,tempmid);

    %CALC FOR MOLECULAR WEIGHT OF SPECIES
    W = Molecular_weight(species);


    %PLOTTING Cp, H and S ,TEMP, Species_SP
    % saving in a folder


    %creating directory

    cd(species);


    %PLOT 1 Cp vs T
    figure(1)
    plot(T,Cp,'linewidth',2,'Color','b');
    title(sprintf('Specific heat vs temperature range of %s',species));
    xlabel('Temperature(K)');
    ylabel('Specific heat (KJ)');
    grid on
    saveas(figure(1),'specific_heat.jpg');

    %plot2 ENTROPY vs T
    figure(2)
    plot(T, S, 'linewidth',2,'Color','r');
    title(sprintf('Entropy vs Temperature range of %s',species));
    xlabel('Temperature(K)');
    ylabel('Entropy (KJ/mol-K');
    grid on
    saveas(figure(2),'Entropy.jpg');

    %PLOT 3 ENTHALPY vs T
    figure(3)
    plot(T,H,'linewidth',2,'Color','g');
    title(sprintf('Enthalpy vs Temperture range of %s',species));
    xlabel('Temperature(K)');
    ylabel('Enthalpy(KJ/mol)');
    grid on
    saveas(figure(3),'Enthalpy.jpg');

    cd ..
    %MOLECULAR WEIGHT
    W = Molecular_weight(species)
end
CODE EXPLANATION :
We first as usual started with clear all,close all and clc commands.
clear all-clears all the variables in the workspace
close all-clears all the plots and figures
clc-clears command window.
We then made a directory using 'mkdir' with address where the file is located.
then for reading the file we used 'THERMO.dat' file and opened it by using 'fopen' as the required command and for reading the line in the text file we used 'fgetl'
then to obtain the temperature range from the thermo.dat file we used 'strsplit'command to split the temperature into a string cell.
Then we used 'str2num'command for converting string cell into numbers.
Then we divided the tempersture using the string and then converted to a number so that the temperature values can be used seperately so that we can solve the NASA thermodynamiccs .
Then we used for loop & end loops to skip the next threee comment lines in the text file.
Reading all the 53 species to plot specific heat,enthalpy, entropy wrt temperature and to find the molecular weights we used a for loop forn reading all the 53 species adn then with use of 'strfind' command to to find the string.
We used linspace low temperature to high temperature also added universal gas constant R.
Then we extracted higher and lower temperature coefficient by reading line from the species.
then we made a diferent script file for calling the functions of specific heat,enthalpy,entropy with the function code.
And lastly we calculated the molecular weight of all the 53 species.
Below are the function codes for enthalpy, entropy,specific heat and molecular weights.
Then we proceed to plot the figure plots for each species and saving them into a sub folder using cd command to change directory to each species and saveas command to save the plot in their respective folders.
FUNCTION CODE FOR ENTHALPY:
function H = enthalpy(a1,a2,a3,a4,a5,a6,a8,a9,a10,a11,a12,a13,T,R,tempmid)

if (T <= tempmid)
    H = R*T.*(a8 + ((a9*T)/2))+((a10*(T).^2)/3)+(a11*(T).^3/4)+((a12*(T).^4)/5)+((a13./(T)));
else
    H= R*T.*(a1+((a2*T)/2)+((a3*(T).^2)/3)+((a4*(T).^3)/4)+((a5*(T).^4)/5)+((a6./T)));
end
end
Here we created a function code for enthalpy and stored it in variable H and then we used 'if else' commands
FUNCTION CODE FOR ENTROPY :
function S = entropy(a1,a2,a3,a4,a5,a7,a8,a9,a10,a12,a14,T,R,tempmid)
%calculation entropy
%calculating entropy for higher and lower temperature
if (T <= tempmid)
S = R*(a8.*log(T) + (a9*T) + ((a10*(T).^2)/2) + ((a11*(T).^3/3) + ((a12*(T).^4)/4) + a14));
else
S = R*(a1.*log(T) + (a2*T) + ((a3*(T).^2)/2) + ((a4*(T).^3/3) + ((a5*(T).^4)/4) + a7));
end
end
Here we created a function code for entropy and stored it in variable S and then we used 'if else' commands
FUNCTION CODE FOR SPECIFIC HEAT :
function Cp = specific_heat(a1,a2,a3,a4,a5,a8,a9,a10,a11,a12,T,R,tempmid)
%calc of specific heat
%calc of specific heat for higher adn lower temperature
if (T<= tempmid)
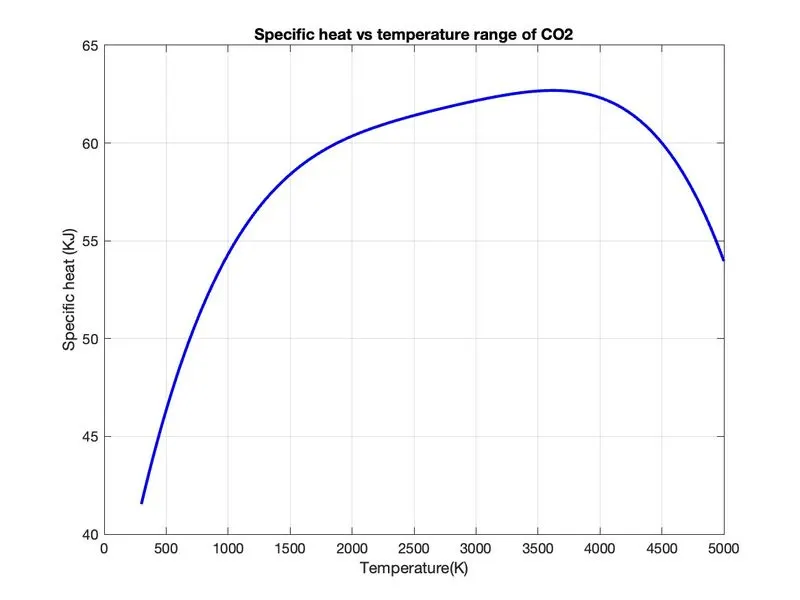
Cp = R*(a8 + (a9*T) + (a10*(T).^2) + (a11*(T).^3) + (a12*(T).^4));
else
Cp = R*(a1 + (a2*T) +(a3*(T).^2) + (a4*(T).^3) + (a5*(T).^4));
end
endHere we created a function code for specific heat and stored it in variable Cpand we used 'if else' commands
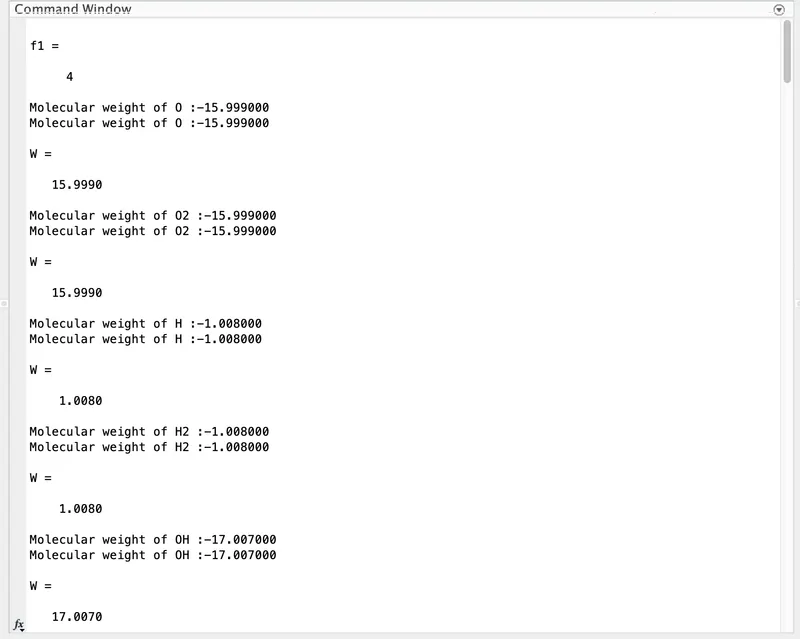
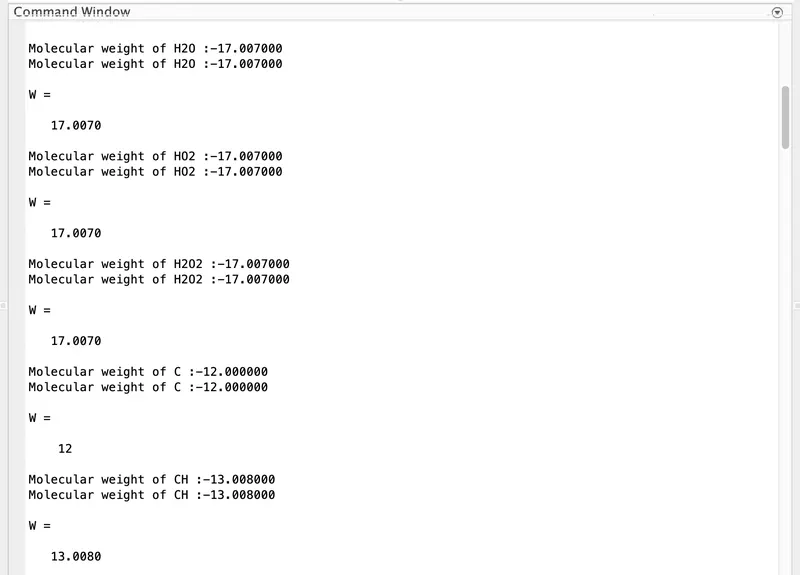
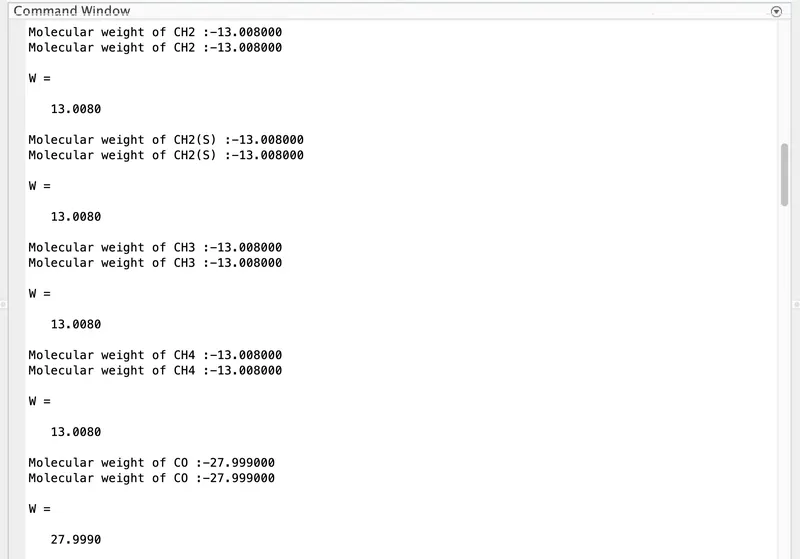
function W = Molecular_weight(species)
%standard - Atomic Name
%HDEFINING ATOMIC NAME OF SPECIES
atomic_name = ['H','C','O','N','Ar'];
%DEFINING ATOMIC MASSES OF MAIN SPECIES
atomic_weight = [1.008 12 15.999 14.007 39.948];
%MOLECULAR WEIGHT STARTING RANGE
W = 0;
for i=1:length(species)
for j=1:length(atomic_name)
if strcmp(species(i),atomic_name(j))
W = W + atomic_weight(j);
position = j;
end
end
n = str2num(species);
if n>1
W = W + atomic_weight(position)*(n-1);
end
end
fprintf('Molecular weight of %s :-',species);
fprintf('%f',W);
disp(' ')
end
After we hit the run button we get the following output,
OUTPUT Plot for 02 :
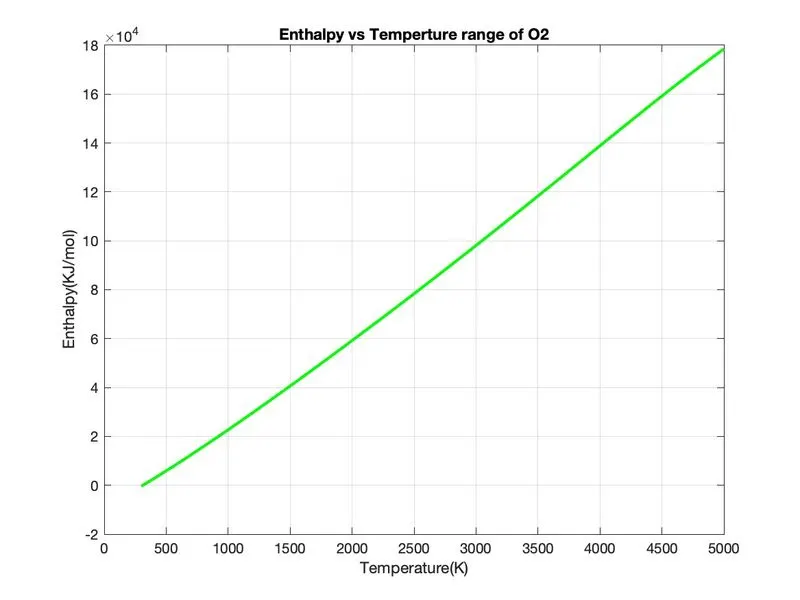
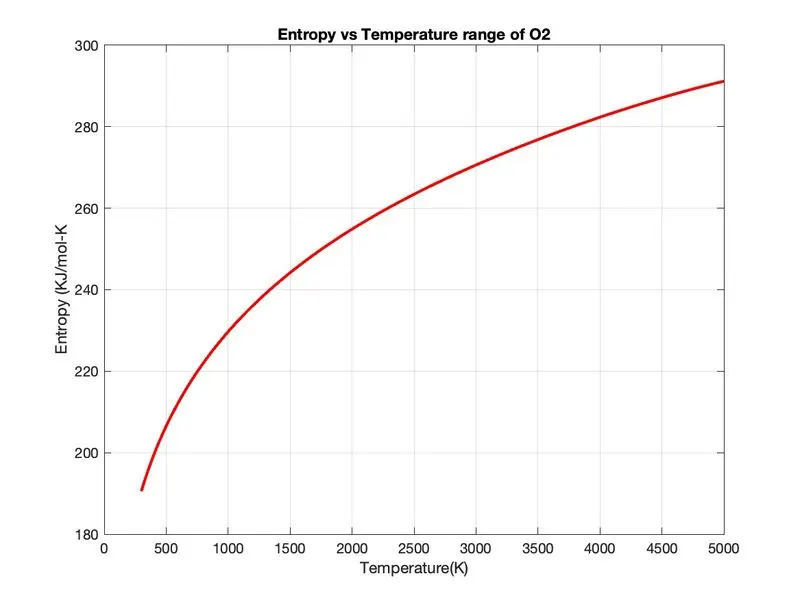
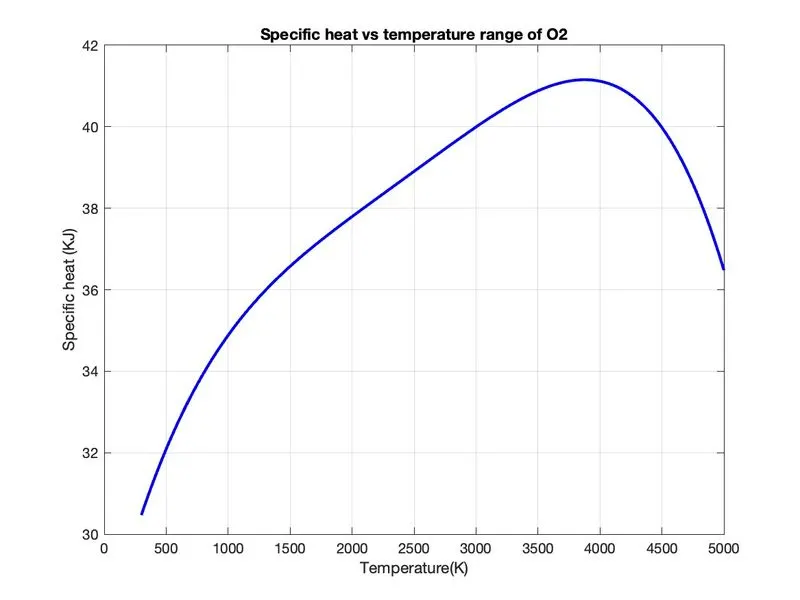
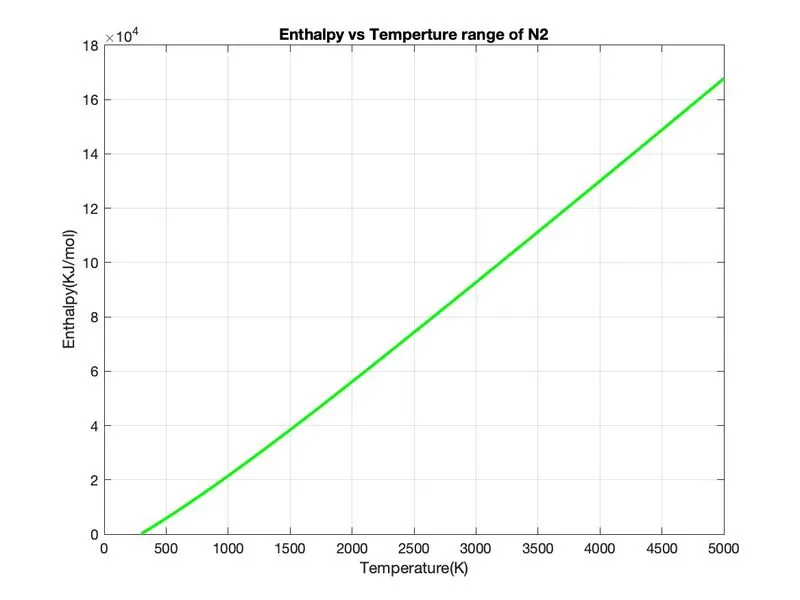
OUTPUT PLOT FOR N2 :
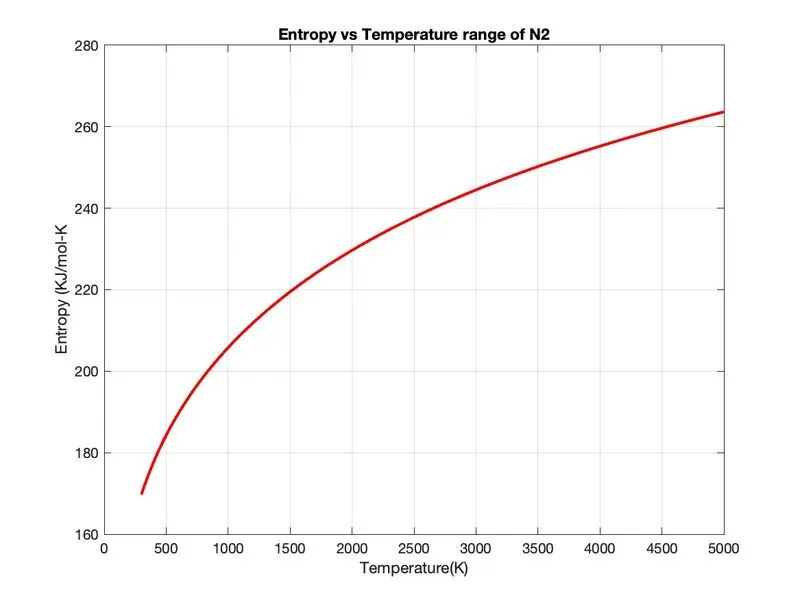
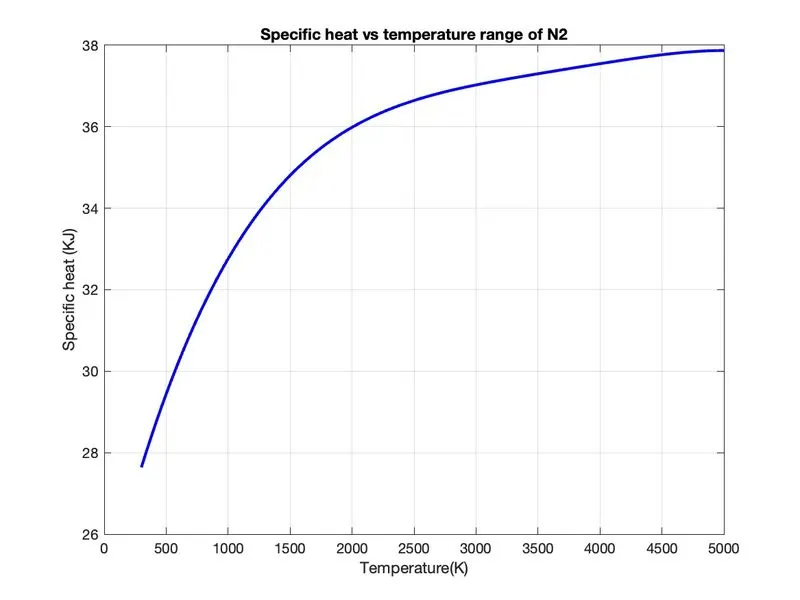
OUTPUT PLOT FOR CO2:
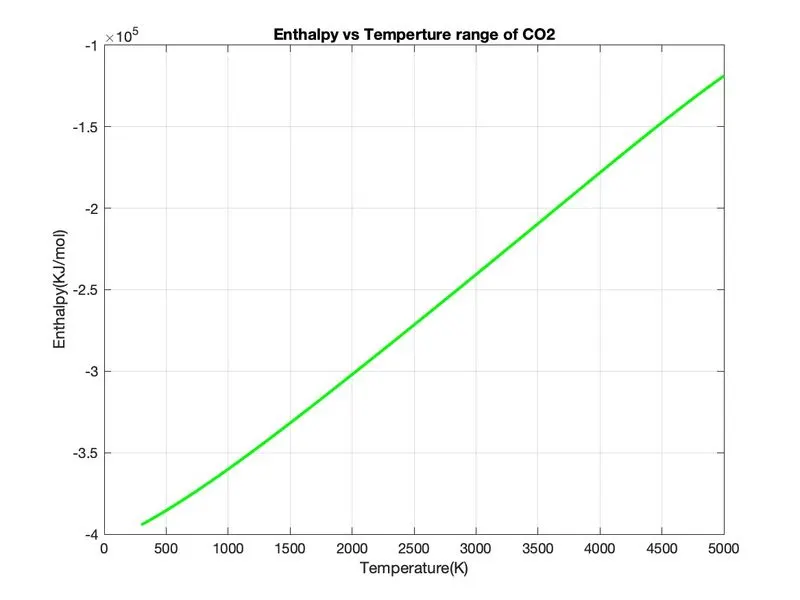
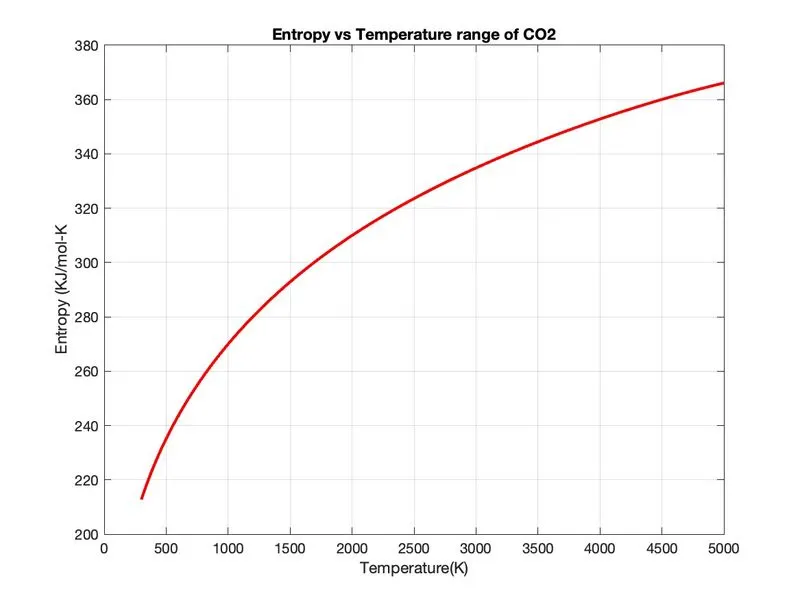
ATTATCHMENT :
SCREENSHOT WHERE ALL THE FOLDERS ARE SAVED


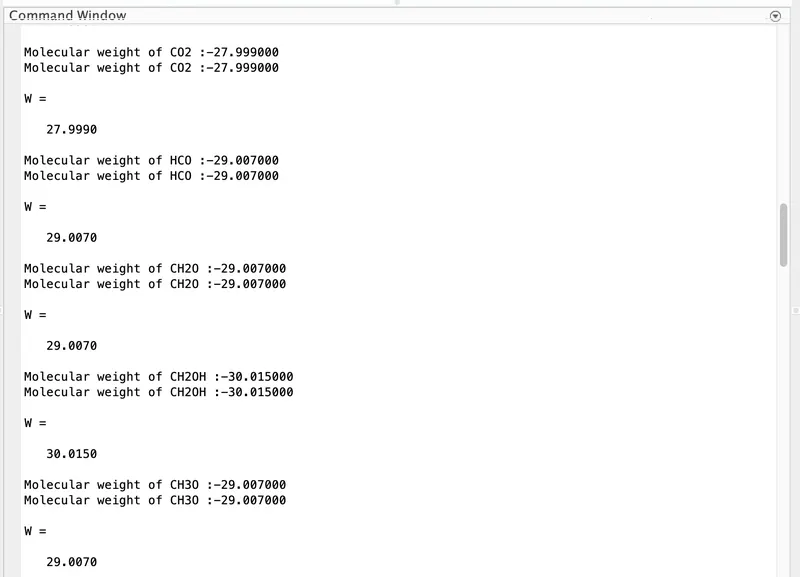
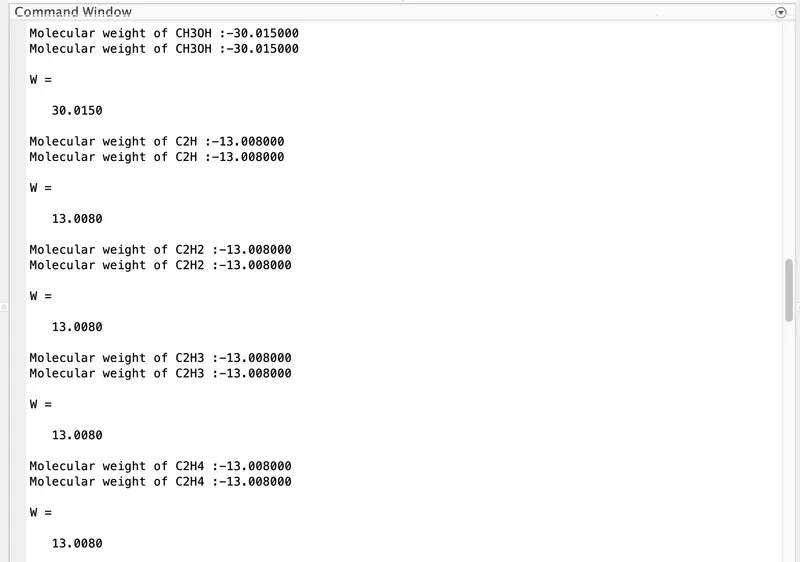
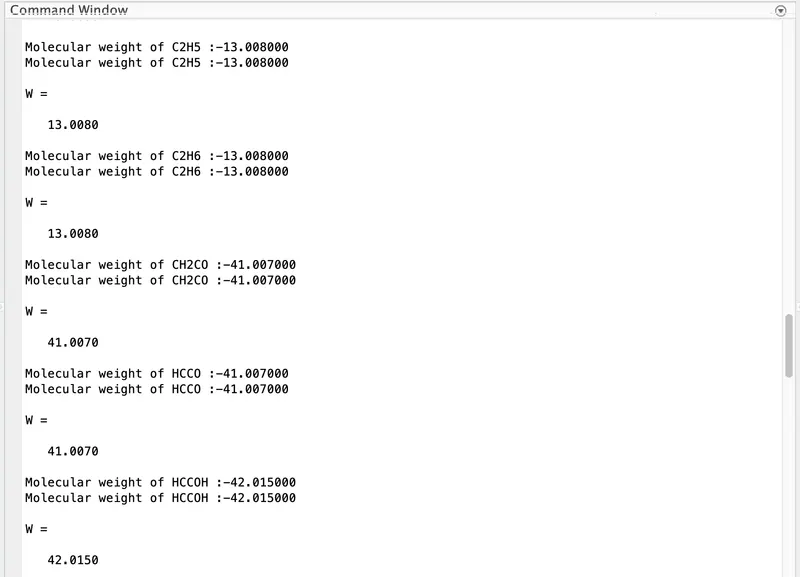
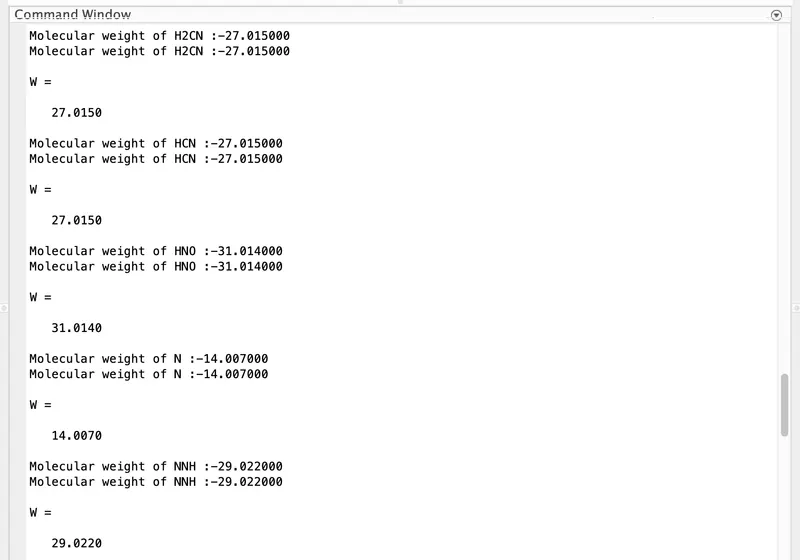
OUTPUT FOR MOLECULAR WEIGHT OF DIFFERENT SPECIES :
RESULTS :