Week 4.1 - Genetic Algorithm
AIM : To write a code to calculate global maxima of a stalagmite function.
Explain syntax of genetic algorithm in matlab.
OBJECTIVE :
- Write a code in MATLAB to optimise the stalagmite function and find the global maxima of the function.
- Clearly expalin the concept of genetic algorithm in your own words and also explain the syntax for ga in MATLAB in your report.
- Make sure that your code gives the same output, even if it is made to run several times.
- Plot graphs for all 3 studies and for F maximum vs no. of iterations.
CONCEPT :
A stalagmite function usually refers to a function with which we are generating values over a stalagmite surface for finding out the local and global maxima and minima at that given function.
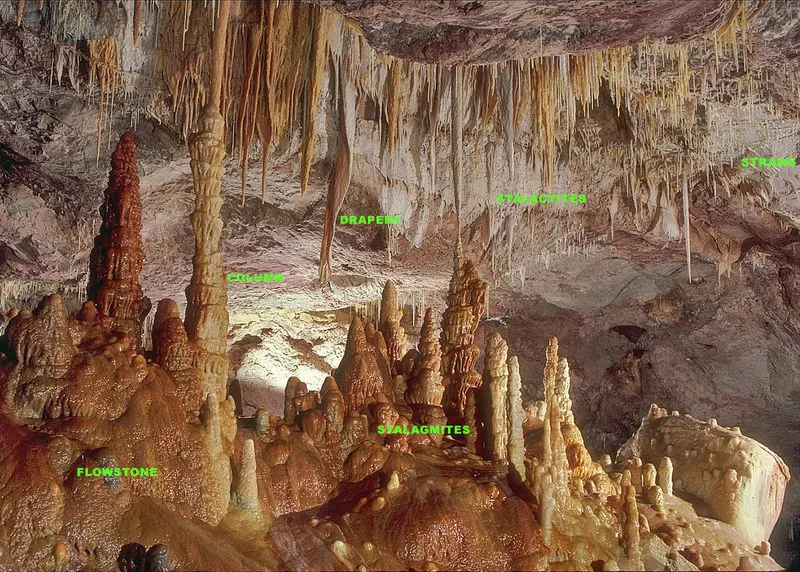
GENETIC ALGORITHM :
In computer science and operations research, a genetic algorithm (GA) is a metaheuristic inspired by the process of natural selection that belongs to the larger class of evolutionary algorithms (EA). Genetic algorithms are commonly used to generate high-quality solutions to optimization and search problems by relying on biologically inspired operators such as mutation, crossover and selection.
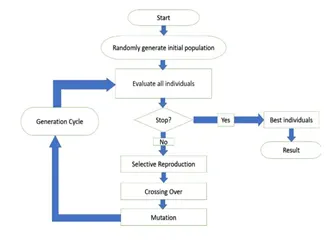
The genetic algorithm is a technique for solving both constrained and unconstrained optimization problems that are based on natural selection, the process that drives biological evolution. The genetic algorithm constantly modifies the population size of individual solutions.
-
- Initialization of Population (Coding)
The code generates its random population of defined size and from that population the code evaluates the fitness of the members of the population according to which it forms new population based on no. of iterations performed.
1.Fitness Function
It is that function which we have to optimize and its optimization is done with the help of number of generations which have been formed by the code accordance with the fitness value of each member generated, these fitness values are used for the reproduction of the children.
- Selection
The idea of the selection phase is to select the fittest individuals and let them pass their genes to the next generation. The main goal of this phase is to find the region where the chances of getting the best solution are more.
Inspiration for this is from the survival of the fittest.
It should be a balance between exploration and exploitation of search space.
GA tries to move the genotype to higher fitness in the search space.
Too strong fitness selection bias can lead to sub-optimal solutions.
Too little fitness bias selection results in unfocused search.
- Reproduction
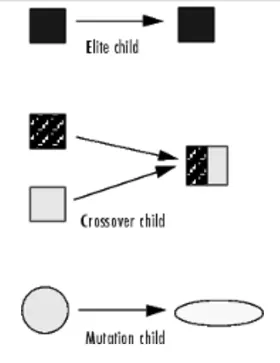
Generation of offspring happen in 2 way:
Crossover
Mutation
1. A) Crossover
Crossover is the most significant stage in the genetic algorithm. During crossover, a random point is selected while mating a pair of parents to generate offspring.
There are 3 major types of crossover.
Single Point Crossover:
A point on both parents’ chromosomes is picked randomly, and designated a ‘crossover point’.
Two-Point Crossover: Two crossover points are picked randomly from the parent chromosomes.
Unifofm Crossover: In a uniform crossover, typically, each bit is chosen from either parent with equal probability.
- B) Mutation
In a few new offspring formed, some of their genes can be subjected to a mutation with a low random probability. This indicates that some of the bits in the bit chromosome can be flipped. Mutation happens to take care of diversity among the population and stop premature convergence.
MATHENATICAL EQUATION :
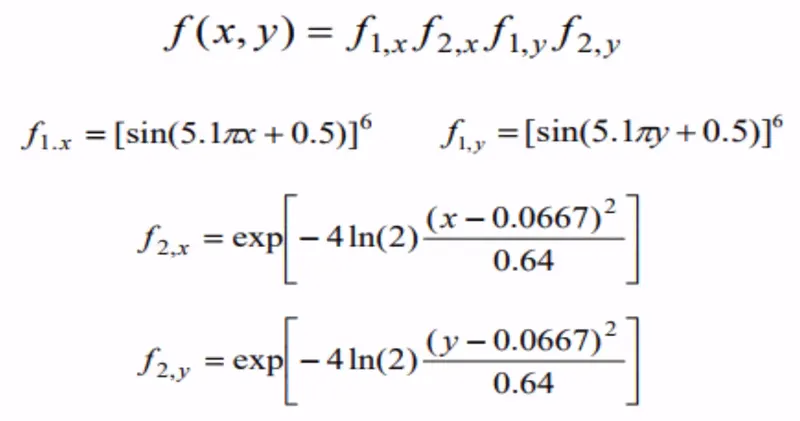
The above equation x and y are two variables which is used in stalagmite function to plot the graph in main functions.
CODE :
clear all
close all
clc

% DEFINING SEARCH SPACE

x = linspace(0,0.6,150);
y = linspace(0,0.6,150);

%CREATION OF 2D MESHGRID
[xx,yy] = meshgrid(x,y);

% FOR EVALUATION OF STALAGMITE FUNCTION
for i = 1:length(yy)
    for j = 1:length(yy)
        input_vector(1) = xx(i,j);
        input_vector(2) = yy(i,j);
        f(i,j)=stalagmite(input_vector);
    end
end


surfc(xx,yy,f)
xlabel('X value')
ylabel('Y label')
shading interp
[inputs,fval] = ga(@stalagmite,2)
EXPLANATION :
we started with clear all close all and clc as usual.
Then we created a 1 dimensional arrays i.e
FUNCTION PROGRAM :
function [f] = stalagmite(input_vector)

x = input_vector(1);
y = input_vector(2);
f1 = (sin(5.1*pi*x+0.5))^6;
f2 = (sin(5.1*pi*y+0.5))^6;
f3 = exp(-4*log(2)*(x-0.0667)^2/0.64);
f4 = exp(-4*log(2)*(y-0.0667)^2/0.64);

f = (f1*f2*f3*f4)

end
Using the function stalagmite(input_vector) and using the formula .
x and y as inputvector(1) and (2).
Then we used the surfc command to visualise the plot
And by using the command shading interp we get horizontal and vertical lines on our plot.
Then we proceed to perform our genetic algortihm.
ga is a ibuilt matlab function
from the equation we can see that there are 2 variables x and y and those re 2 variables we passed a stalagmite function
and [inputs,favl] will evaluate the optimum value for our inputs.
After we hit on run button we get the following output
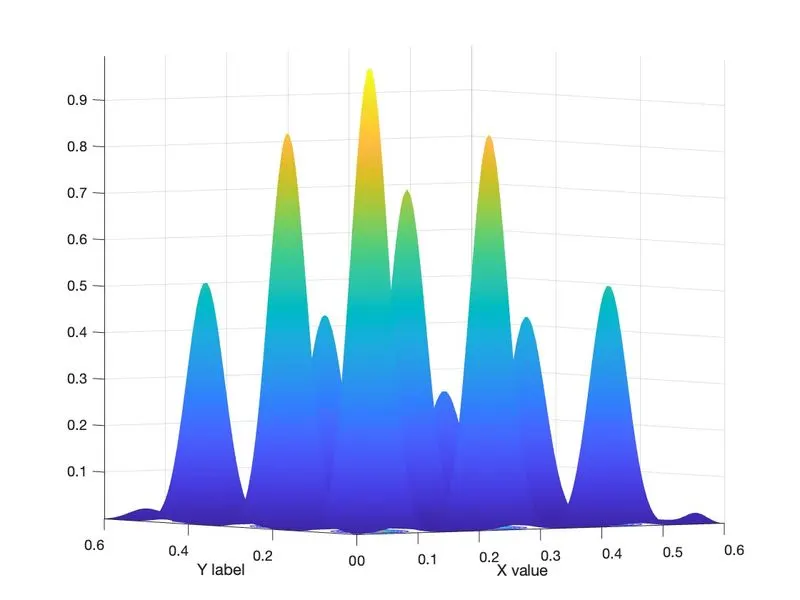
from the above graph we can see that our maximum value is somewhere at (0.0644295,0.0644295,0.9911).
FOR PLOTTING GLOBAL MINIMA AND FINDING MINIMUM OF FUNCTION GA IS USED.
MAIN CODE :
clear all
close all
clc

x = linspace(0,0.6,150);
y = linspace(0,0.6,150);

[xx,yy] = meshgrid(x,y);

num_cases = 50

%takes values until length of xx
for i = 1:length(xx)
    for j = 1:length(yy) %takes values until length of yy
        inputs(1) = xx(i,j);
        inputs(2) = yy(i,j);
        f(i,j) = stalagmite(inputs);
    end
end

tic
% study 1 - STATISTICAL BEHAVIOUR

for i = 1:num_cases
    [inputs,fopt(i)] = ga(@stalagmite,2)
    xopt(i) = inputs(1)
    yopt(i) = inputs(2)
end

study1_time = toc

%PLOTTING1
figure(1)
subplot(2,1,1)
hold on
surfc(x,y,f)
shading interp
plot3(xopt,yopt,fopt,'marker','o','markersize',5,'markerfacecolor','g')
subplot(2,1,2)
plot(-fopt)
title('unbounded inputs')
subplot(2,1,2)
plot(fopt)
xlabel('Iterations')
ylabel('function mimimum')


%STUDY2 - STATISTICAL BEHAVIOUR

for i =1:num_cases
    [inputs,fopt(i)] = ga(@stalagmite,2,[],[],[],[],[0,0],[1,1]);

    xopt(i) = inputs(1)
    yopt(i) = inputs(2)
end
study2_time = toc


figure(2)

subplot(2,1,1)
hold on
surfc(x,y,f)
shading interp
plot3(xopt,yopt,fopt,'marker','o','markersize',3,'markerfacecolor','r')
title('Bounded inputs')
subplot(2,1,2)
plot(fopt)
xlabel('Iterations')
ylabel('Function minimum')

grid on

%INCREASING ga iteration
options = optimoptions('ga');
options = optimoptions(options,'PopulationSize',150);


tic

for i = num_cases
    [inputs,fopt(i)] = ga(@stalagmite,2,[],[],[],[],[0;0],[1;1],[],[],options);
    xopt(i) = inputs(1)
    yopt(i) = inputs(2)
end

study3_time = toc


figure(3)
subplot(2,1,1)
hold on
surfc(x,y,f)
shading interp
plot3(xopt,yopt,fopt,'marker','o','markersize',5,'markerfacecolor','r')
subplot(2,1,2)
plot(fopt)
xlabel('Iterations')
ylabel('Function minimum')
title('Bounded Inputs')
grid on
FUNCTION CODE :
function [f] = stalagmite(input_vector)

x = input_vector(1);
y = input_vector(2);
f1 = (sin(((5.1*pi).*x)+0.5)).^6;
f2 = (sin(((5.1*pi).*y)+0.5)).^6;
f3 = exp((((x-0.0667).^2).*(-4*log(2)))./0.64);
f4 = exp((((y-0.0667).^2).*(-4*log(2)))./0.64);


f = -f1*f2*f3*f4;

end
CODE EXPLANATION :
We started with as usual clear all, close all and clc.
Then we created x and y where x and y are input arrays. Then we input a parameter named num_cases = 50 i.e we will run the genetic algortihm 50 times and we have the function get_stalagmite which eill generate a stalagmite function.
Then we make a for loop for calling a genetic algorith (ga) and passing number of variables as inputs and then storing x and y values and also the optimum value that the function predicts.
After that we open a new file window and open sub plot. 1st plot we will create is surfc(x,y,f) and then we will use plot 3 command to plot x y and optimum function value that genetic algorithm predicts over 50 times.
then we used basic plot commands for labelling x-axis as xlabel() and labelling y-axis as ylabel() .
we run this program for 3 conditions i.e study_1 study_2 and study_3.
After we run this program we get the following output.
OUTPUT :
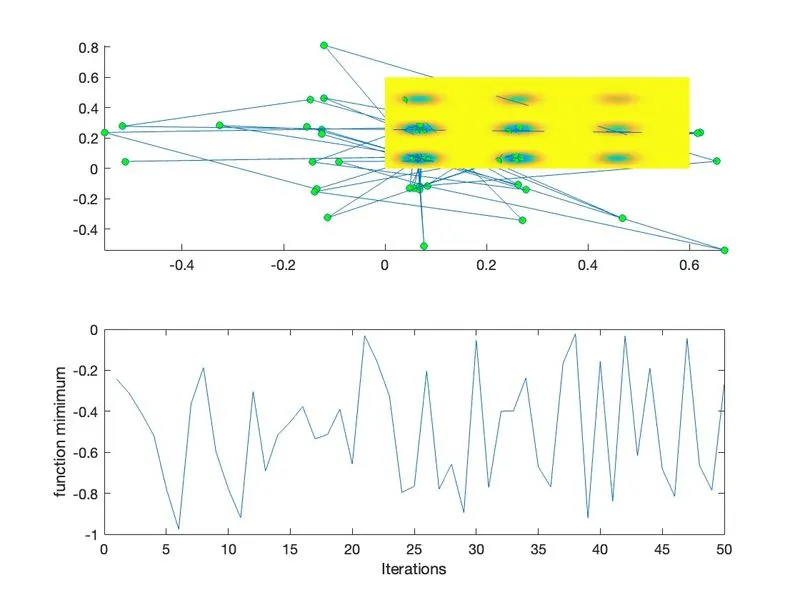
FIGURE(1)
From fig1 we can see that because of random samples the plotting of minimum value of ga is trying to predict and its all over the place.
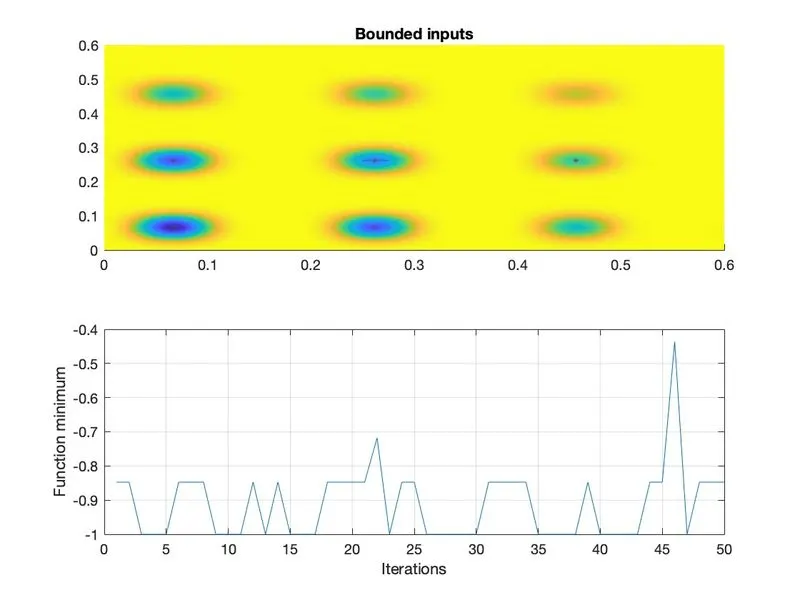
FIGURE(2)
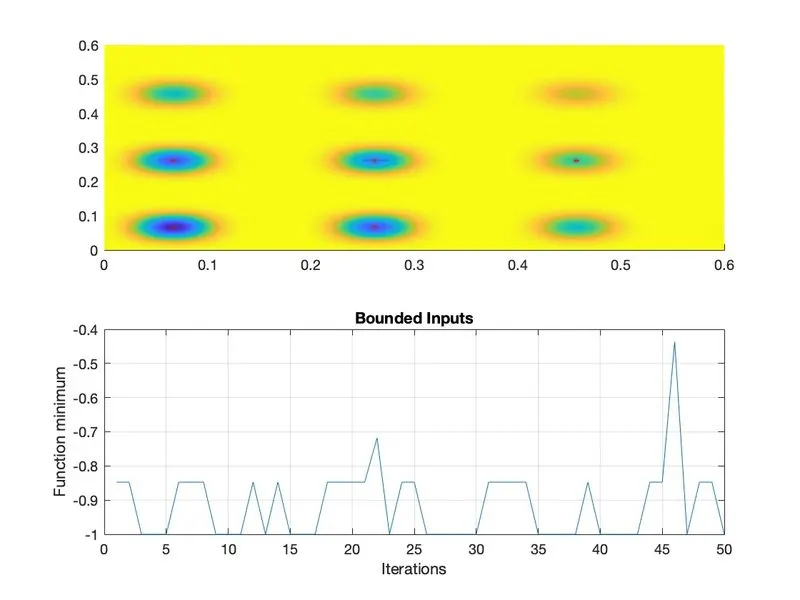
FIGURE(3)
RESULTS :
Programming for general maxima and stalagmite function is done.
Concept for genetic algorithm is done.
Plot for all 3 studies and global maxima are obtained.
REFERENCE :
https://www.google.co.in/search?q=stalagmite+function&sxsrf=APq-WBsCts3UPGsDdswMmAXWaom4kIBwgw:1650393053968&source=lnms&tbm=isch&sa=X&ved=2ahUKEwi5x-Kd4aD3AhU-yIsBHWySDT4Q_AUoAXoECAEQAw&biw=1440&bih=707&dpr=2#imgrc=gAHM5sPAjscA4M
https://en.wikipedia.org/wiki/Genetic_algorithm