Week 2 - Flow over a Cylinder.
Aim:
To Simulate the flow over a cylinder and explain the phenomenon of Karman vortex street.
Objective:
1. Simulate the flow with the steady and unsteady case and calculate the Strouhal Number for Re= 100
2. Calculate the coefficient of drag and lift over a cylinder by setting the Reynolds number to 10,100,1000,10000 & 100000. (Run with steady solver)
2. Discuss the effect of Reynolds number on the coefficient of drag. [ Results should be validated with any standard literature and error should be within 5 %]
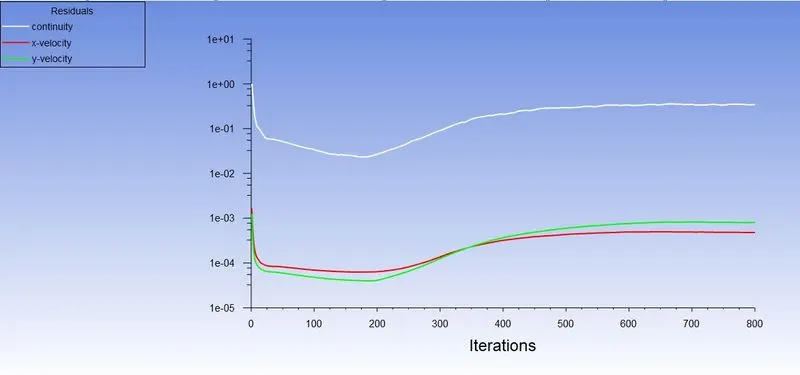
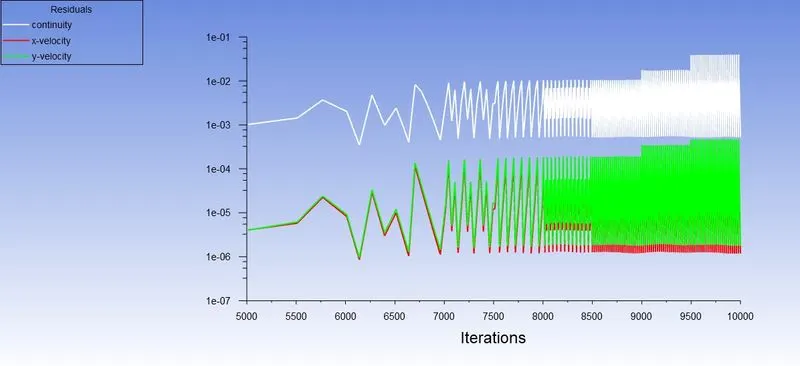
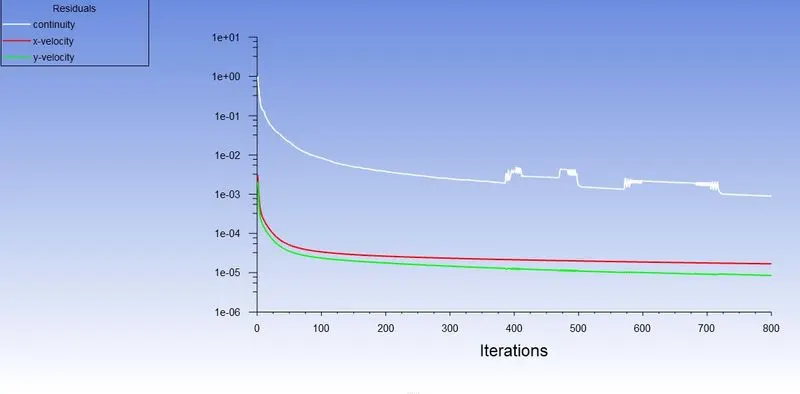
3. In both approaches, show that the flow has converged. That is, what quantities or plots need to be looked at to determine that the flow has converged?
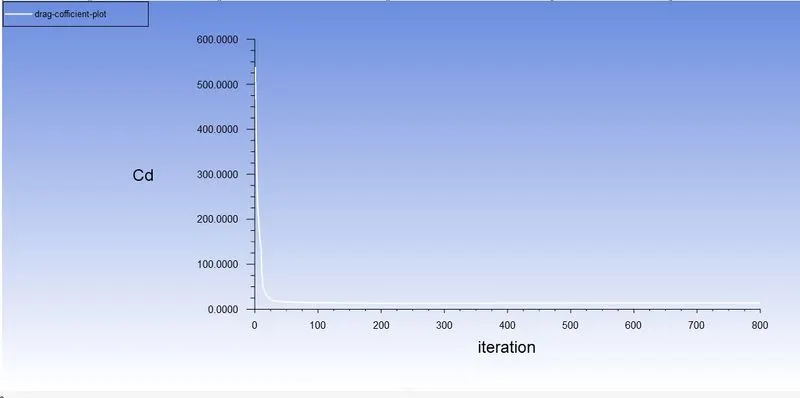
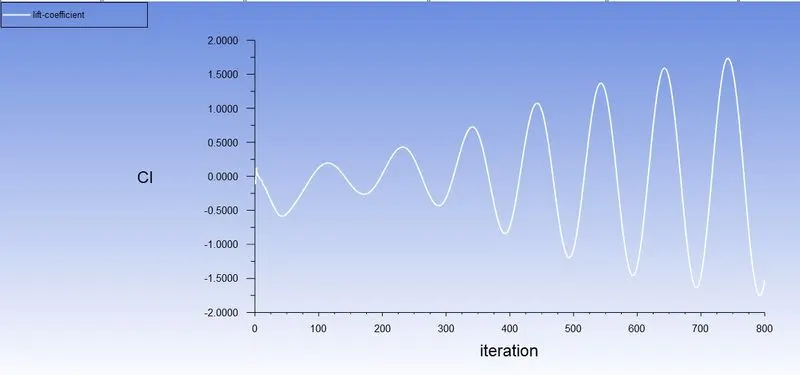
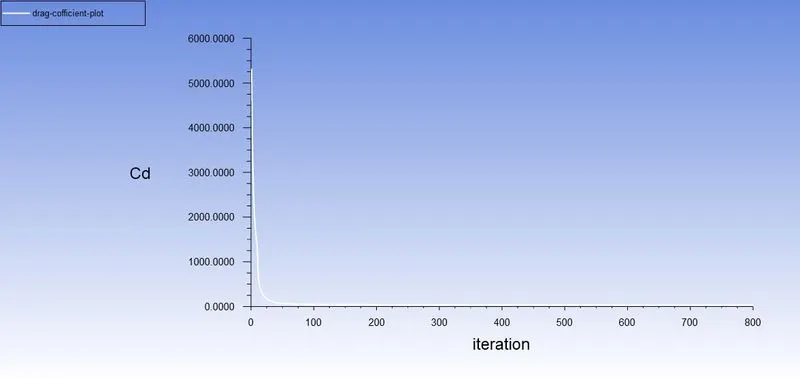
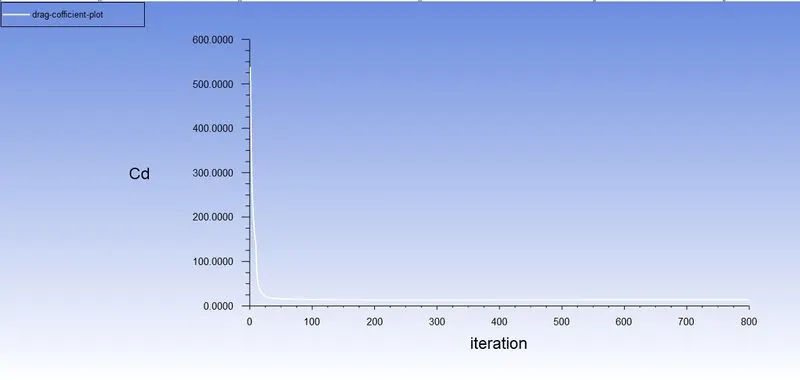
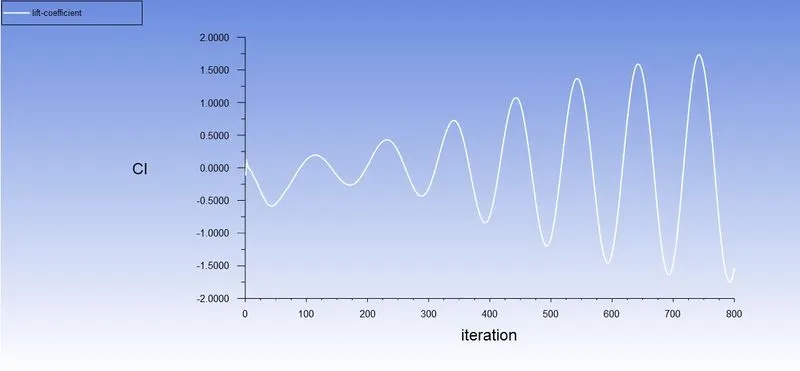
4. Plots of the coefficient of drag and lift.
5. Plots to show vortex shedding behind the cylinder.
6. Mention the preferred material at the end of the challenge submission page.
Explanation :
Flow Over a Cylinder:
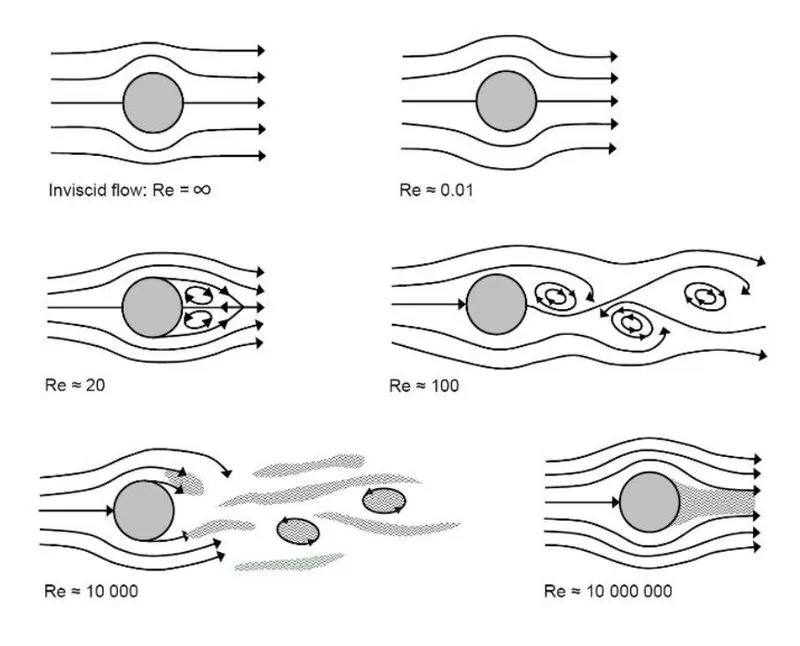
Flow over a cylinder is a classical problem for understanding the flow over an obstacle. The geometry of the cylinder is simple and allows us to understand all the complexities that occur and turbulence for different Reynolds Numbers. Reynolds Number helps us to understand the flow patterns of the different fluid flow situations. The different range of Reynolds Numbers represents different flow patterns. At low Reynolds Numbers, the flow pattern is observed to be Laminar i.e., Smooth, Constant fluid motion. At higher Reynolds Numbers the flow pattern is observed to be Turbulent i.e., Chaotic eddies, Vortices, and Flow instabilities. In this project, we will try to understand the variation of velocity and pressure in certain flow directions for different Reynolds Numbers by simulating it with proper boundary conditions, Mesh sizing, Convergence criteria using SolidWorks Flow Simulation.
Reynolds Number:
It is defined as the ratio of inertial forces to viscous forces within the fluid which is subjected to relative internal movement due to different fluid velocities.
- laminar flow occurs at low Reynolds numbers, where viscous forces are dominant, and is characterized by smooth, constant fluid motion;
- turbulent flow occurs at high Reynolds numbers and is dominated by inertial forces, which tend to produce chaotic eddies, vortices, and other flow instabilities.
Mathematically Reynolds Number is defined as:
- laminar flow occurs at low Reynolds numbers, where viscous forces are dominant, and is characterized by smooth, constant fluid motion;
- turbulent flow occurs at high Reynolds numbers and is dominated by inertial forces, which tend to produce chaotic eddies, vortices, and other flow instabilities.
Mathematically Reynolds Number is defined as:
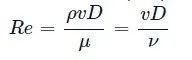
ρ">ρ= Density of the fluid.
v">v= Velocity of the fluid.
D">D= Diameter of the tube or cylinder.
μ">μ= Dynamic viscosity.
ν">ν= Kinematic viscosity.
Strouhal number (St):
Strouhal number is a dimensionless number describing oscillating flow mechanisms.
The Strouhal number is often given as
St = f*d/u
Where,
f is the frequency of vortex shading,
d is the diameter if the circular cylinder
U is the flow velocity.
Co-efficient of drag:
In fluid dynamics, the drag coefficient(Cd)">(Cd) is a dimensionless quantity that is used to quantify the drag or resistance of an object in a fluid environment, such as air or water. It is used in the drag equation in which a lower drag coefficient indicates the object will have a less aerodynamic or hydrodynamic drag. The drag coefficient is always associated with a particular surface area.
The drag coefficient of any object comprises the effects of the two basic contributors to fluid dynamic drag: skin friction and form drag. The drag coefficient of a lifting airfoil or hydrofoil also includes the effects of lift-induced drag. The drag coefficient of a complete structure such as an aircraft also includes the effects of interference drag.
The drag coefficient Cd">Cd is defined as
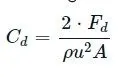
where:
Fd is the drag force, which is by definition the force component in the direction of the flow velocity,
ρ is the mass density of the fluid,
u is the flow speed of the object relative to the fluid,
A is the reference area.
Co-efficient of lift:
The lift coefficient (CLCL) is a dimensionless coefficient that relates the lift generated by a lifting body to the fluid density around the body, the fluid velocity, and an associated reference area. A lifting body is a foil or a complete foil-bearing body such as a fixed-wing aircraft. CL is a function of the angle of the body to the flow, its Reynolds number, and its Mach number. The section lift coefficient cl refers to the dynamic lift characteristics of a two-dimensional foil section, with the reference area replaced by the foil chord.
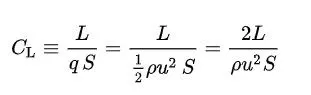
where
is the lift force,
is the relevant surface area and
q is the fluid dynamic pressure, in turn, linked to the fluid density, and to the flow speed.
A brief explanation to solve the flow over a cylinder:
1. Geometry
- Creating the geometry by sketching using the line and circle command, circle diameter of 2m and the dimensions having 20X60m and the circle is placed 20m from the inlet.
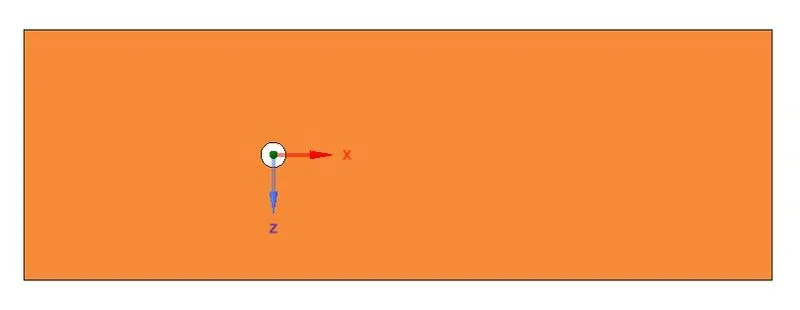
2.Mesh
- After the geometry is done we should do mesh it and here I used 0.15m as elemental size
- But in the meshing nodes, the shape is more quadrilateral than the triangle so we should this by changing the method to the triangle in the insert option
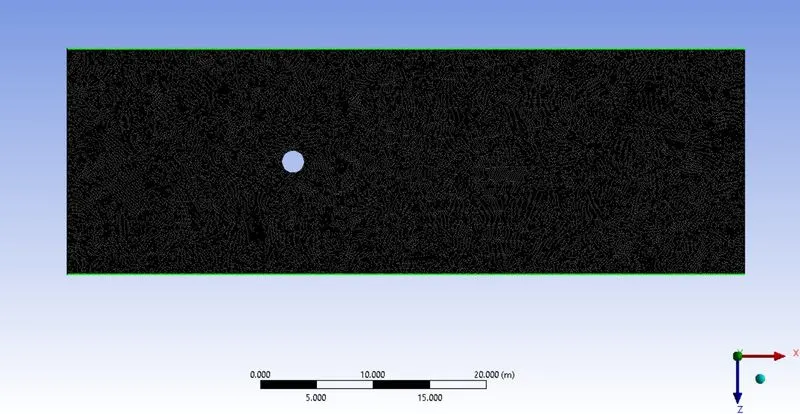
- After changing the node's shape into triangles we should improve the mesh around the cylinder by sizing in the mesh which is used to control precisely the mesh.
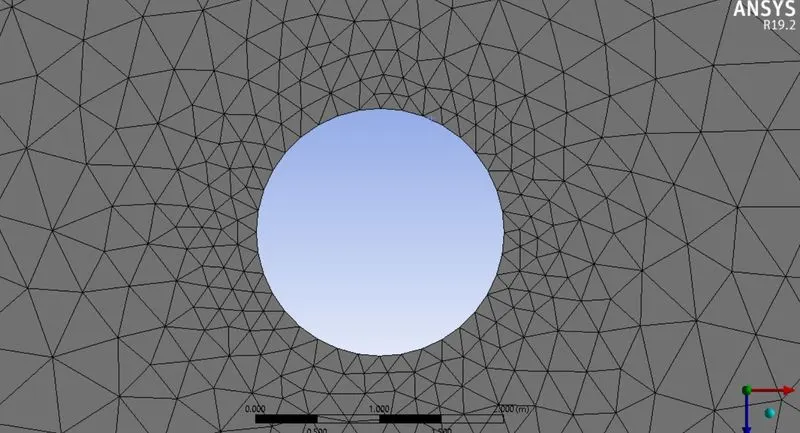
- Then we should add inflation which is used to create body-fitted mesh
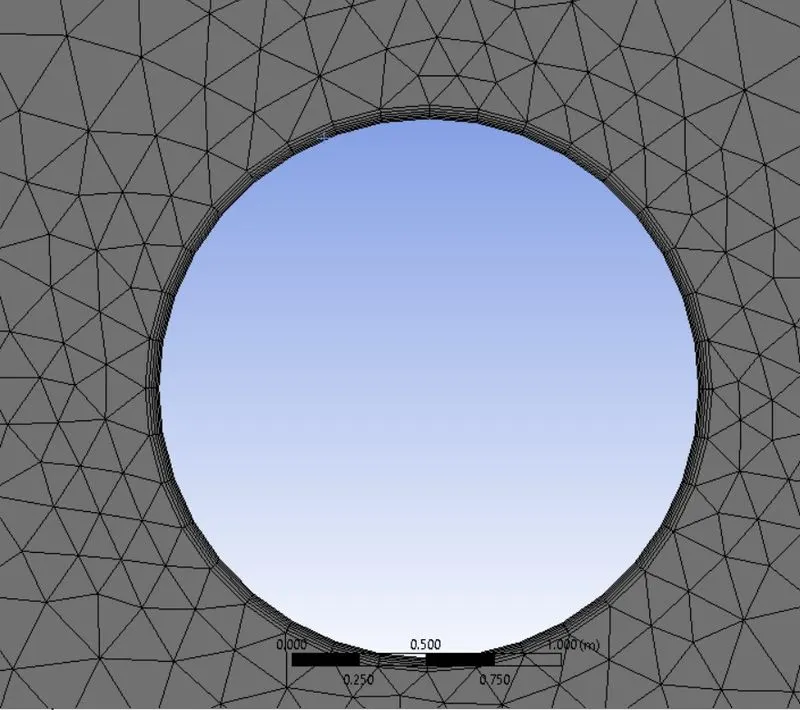
- And we should name the boundaries as given below
- cylinder edge is named as wall
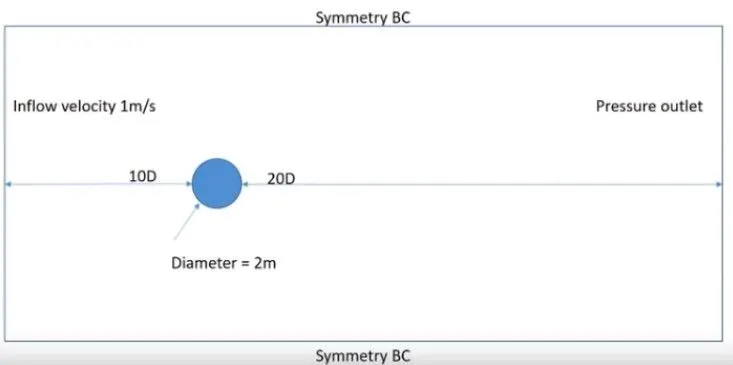
3.Setting up Ansys fluent :
-
Before opening the set up we should update the mesh. Then we should change the viscous flow to laminar.
- Open Materials and create a fluid that is to be used for the simulation for this case, it is air and also inputs the density and kinematic viscosity values.
- Density= 1
- Viscosity= 0.05
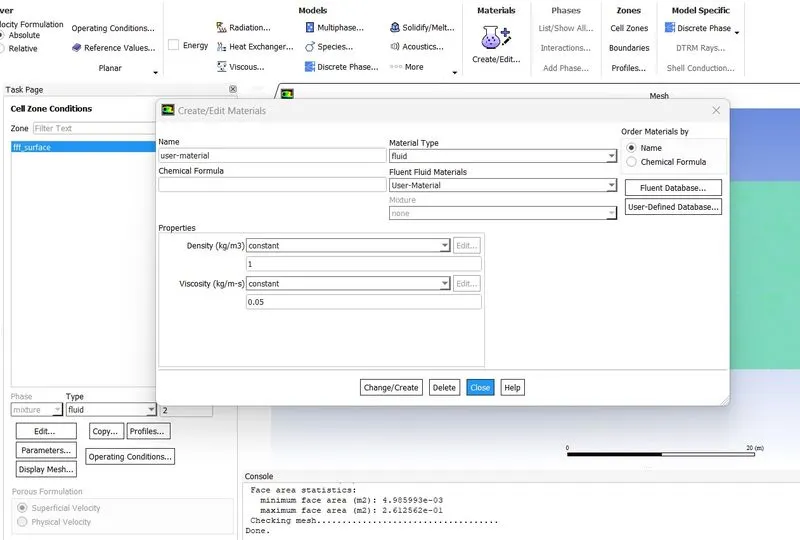
- Creating a monitor point behind the cylinder by selecting point under surfaces in the results bar.
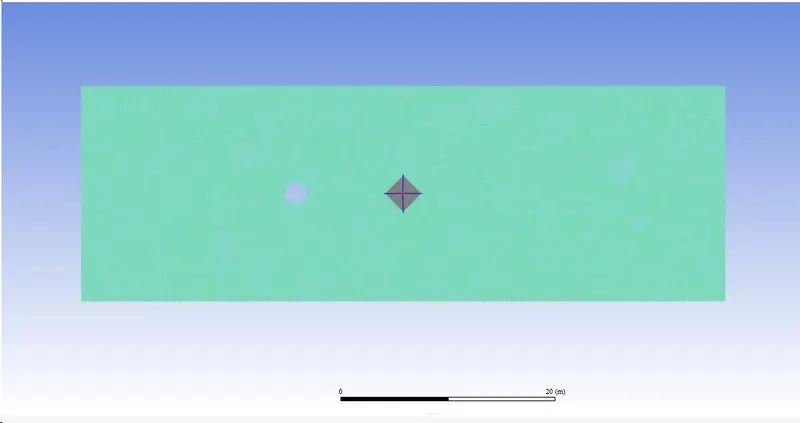
- After creating the monitor point, create reports or plots for drag, lift, velocity of cylinder.
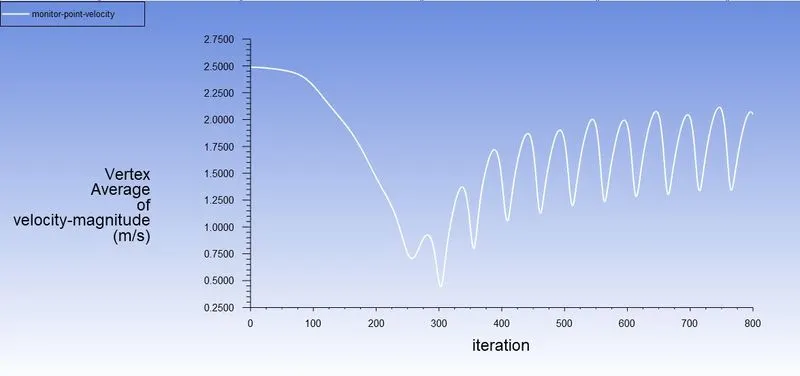
- Create plots for the velocity at the monitor point to analyze the vortex shedding.
- Use hybrid initialization for steady-state and standard for transient state simulations.
Part 1 :
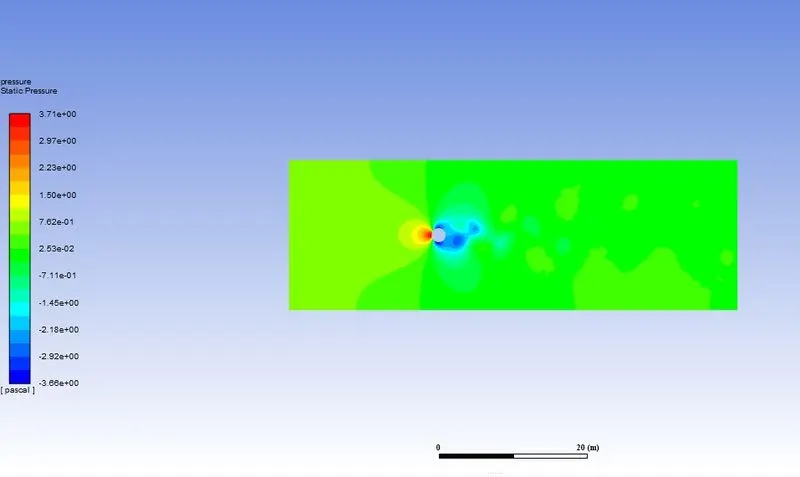
(i) Simulate the flow with the steady case and calculate the Strouhal number for Re=100
- Velocity contours:
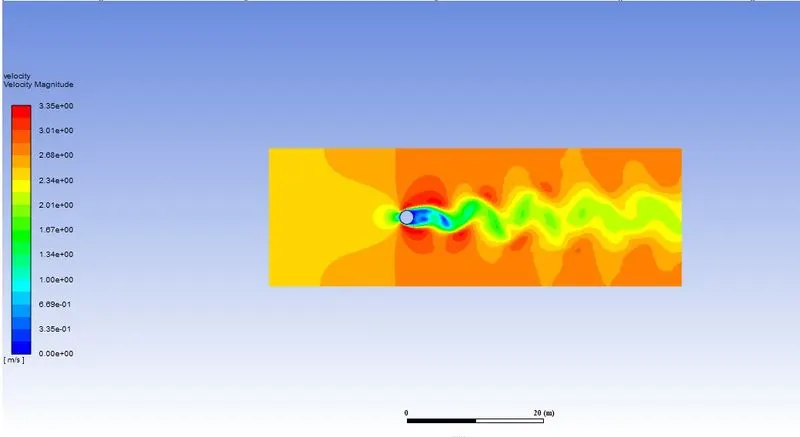
- pressure contours:
- Residuals plot:
- Drag and lift coefficient Plot:
- velocity at the monitor point:
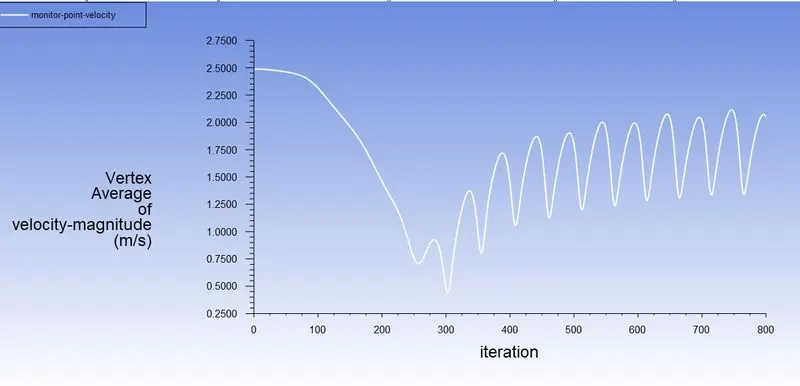
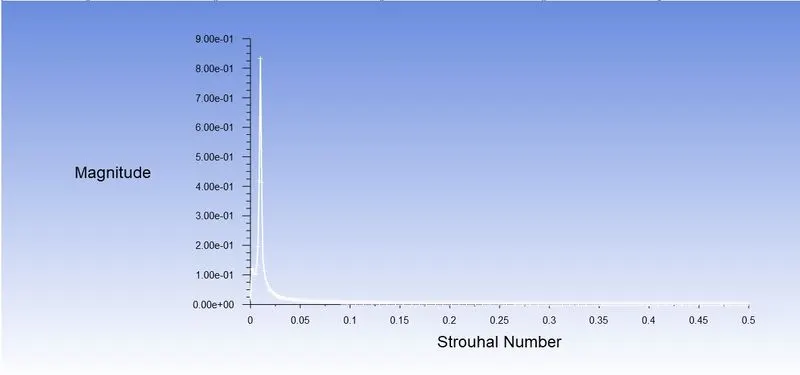
- Strouhal number plot:
(ii) Simulate the flow with the unsteady case and calculate the Strouhal number for
- Re=100 and
- velocity 2.5m/s.
- Velocity contours:
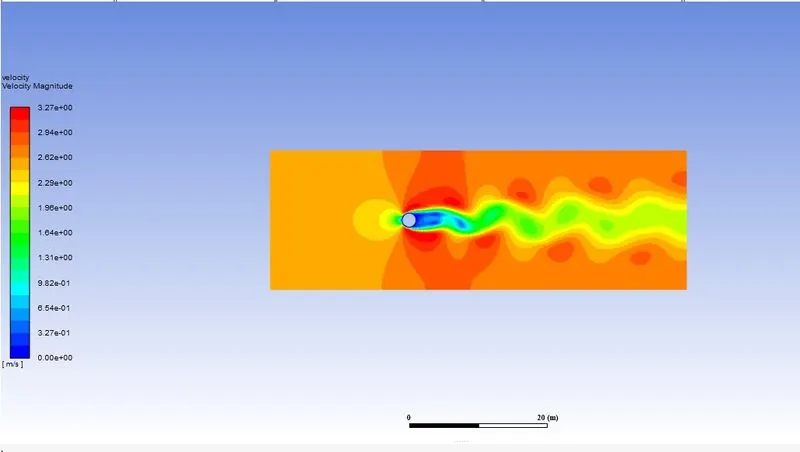
- pressure contours:
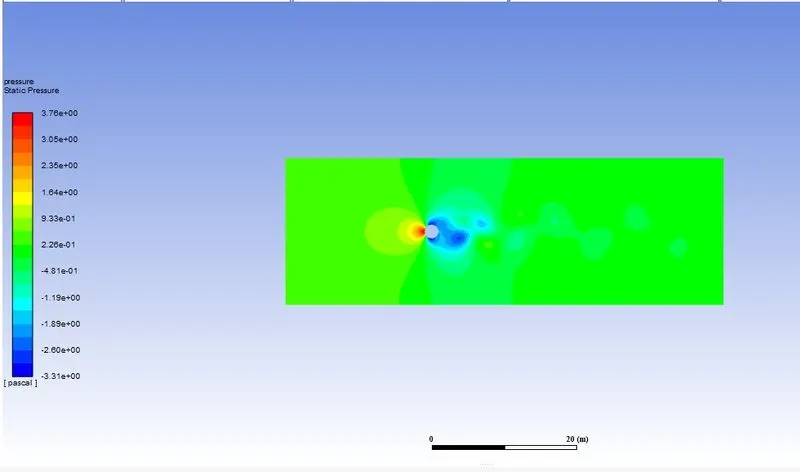
- Residuals plot:
- Drag coefficient:
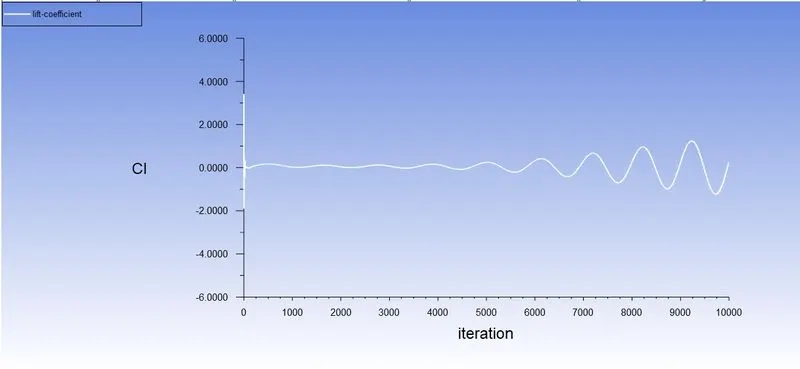
- lift coefficient:
- velocity at the monitor point:
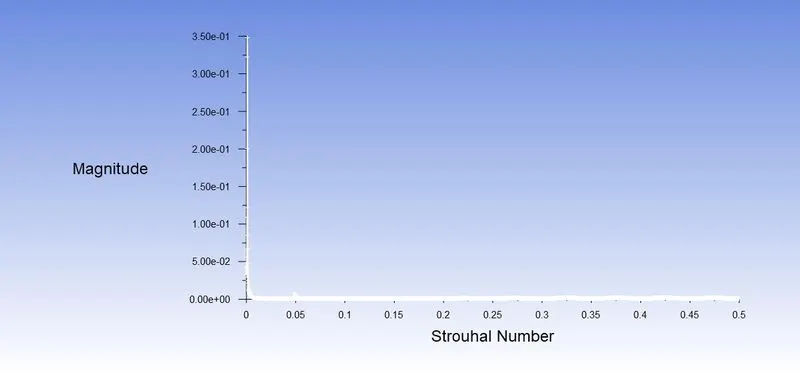
- Strouhal number plot :
| solver | Cd | CL | Strouhal number |
| steady-state | 1.365 | -0.13 | 0.01333 |
| unsteady-state | 1.3336 | -1.179 | 0.1996 |
Part-2
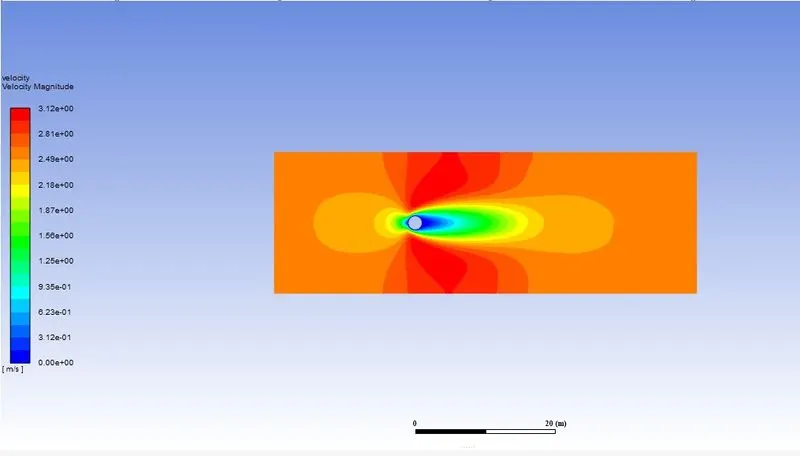
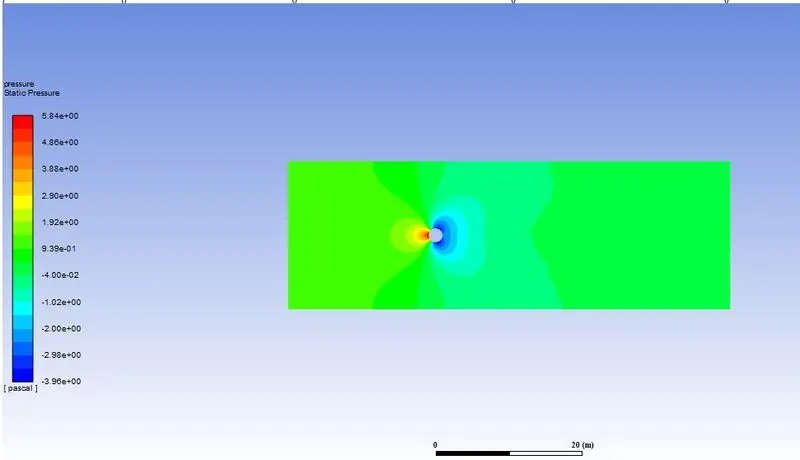
(i) Simulate the flow with the steady-state solver for Re=10.
For Re=10 velocity v=0.25m/s
- Velocity and pressure contours:
- Residuals plot:
- Drag and lift coefficient:
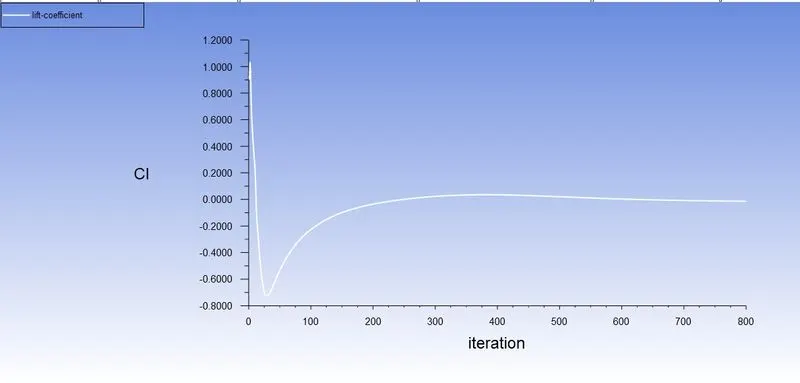
- velocity at the monitor point:
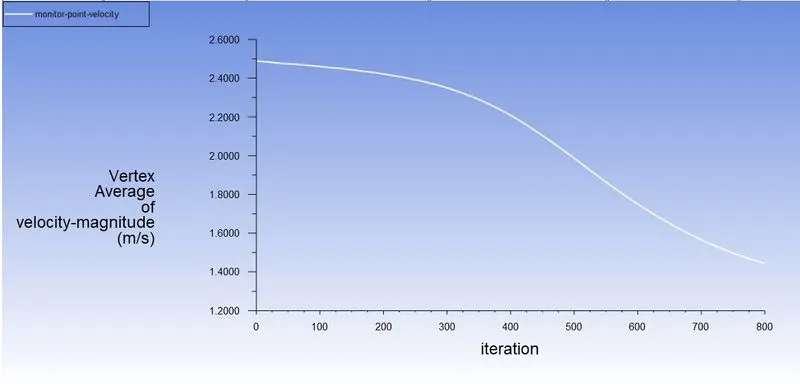
(ii) Simulate the flow with the steady-state solver for Re=100.
For Re=100 velocity v=2.5m/s
- Velocity and pressure contours:
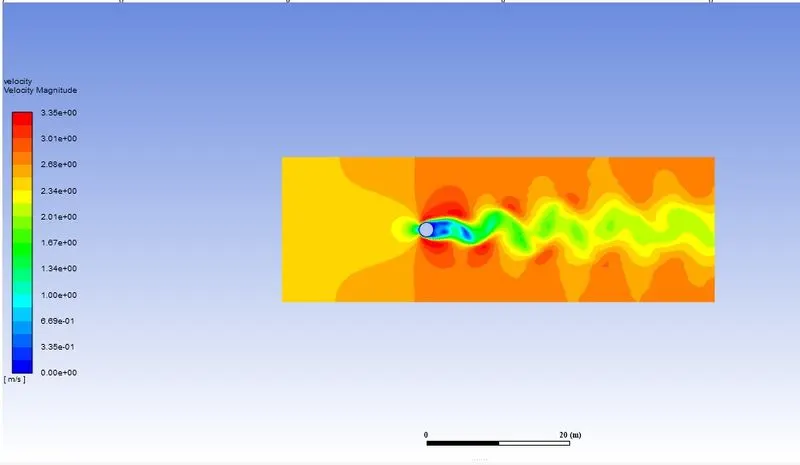
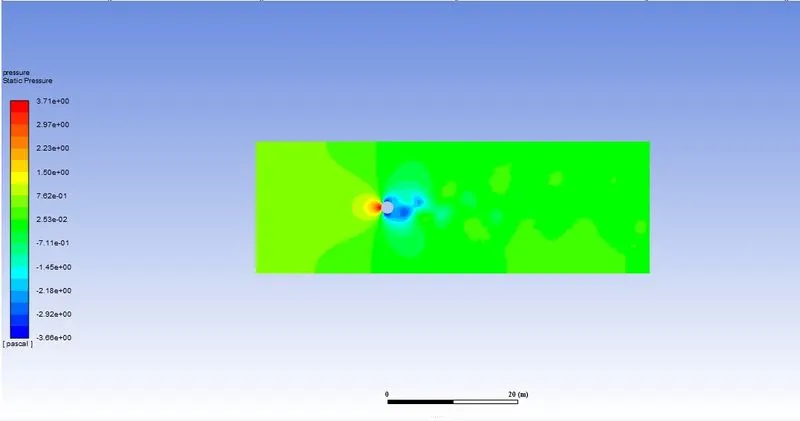
- Residuals plot:
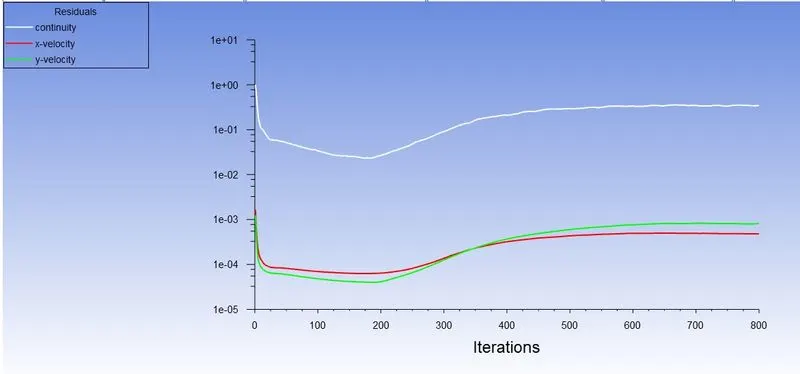
- Drag and lift coefficient:
- velocity at the monitor point:
(iii) Simulate the flow with the steady-state solver for Re= 1000.
For Re=1000 velocity v=25m/s
- Velocity and pressure contours:
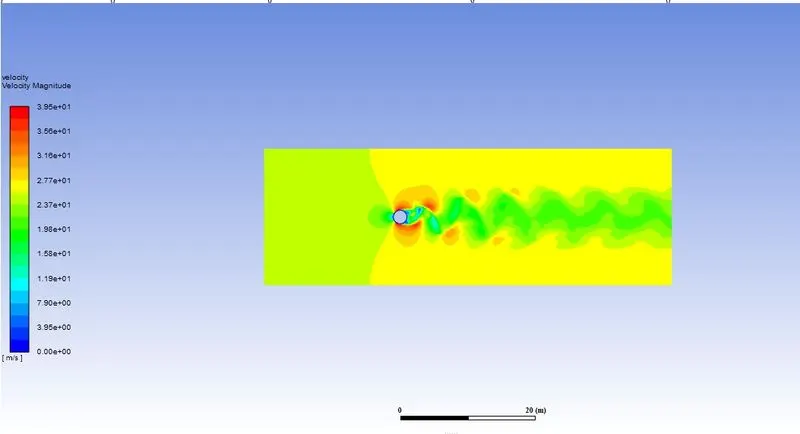
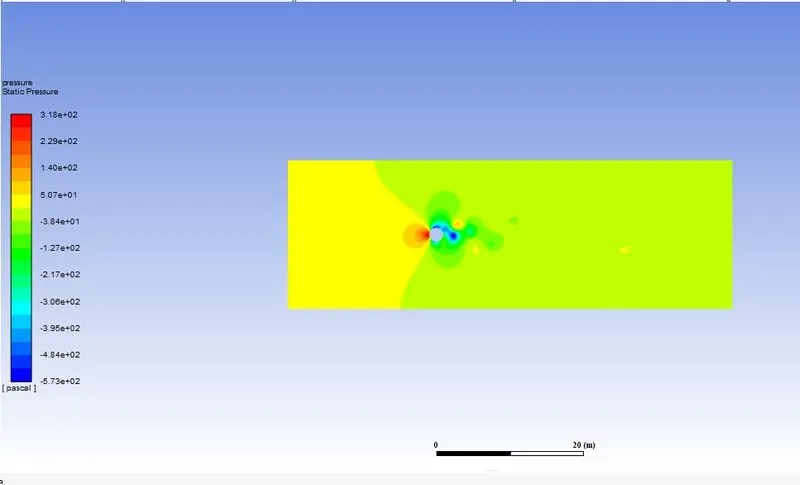
- Residuals plot:
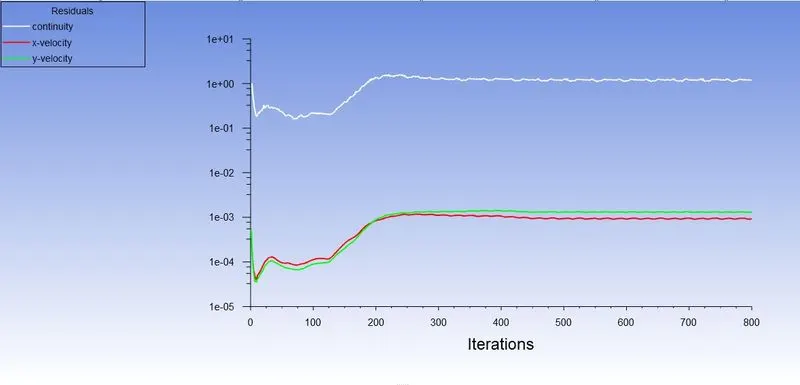
- Drag and lift coefficient:
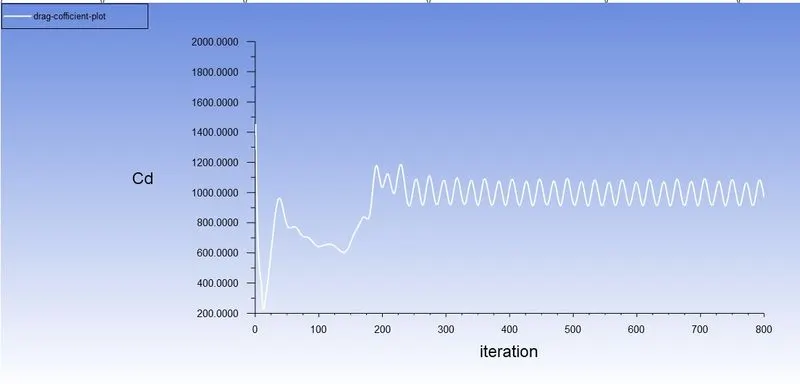
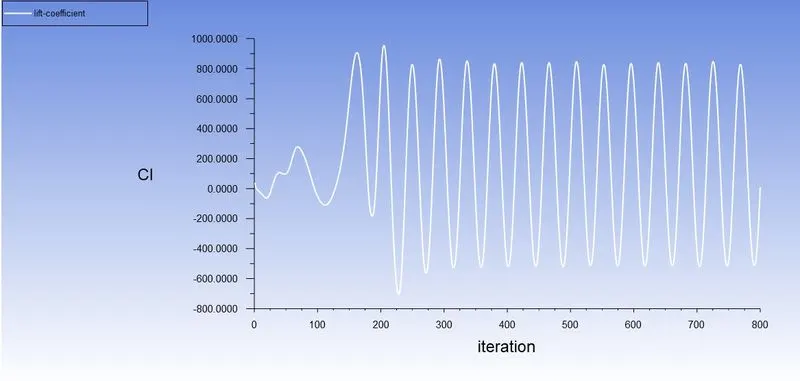
- velocity at the monitor point:
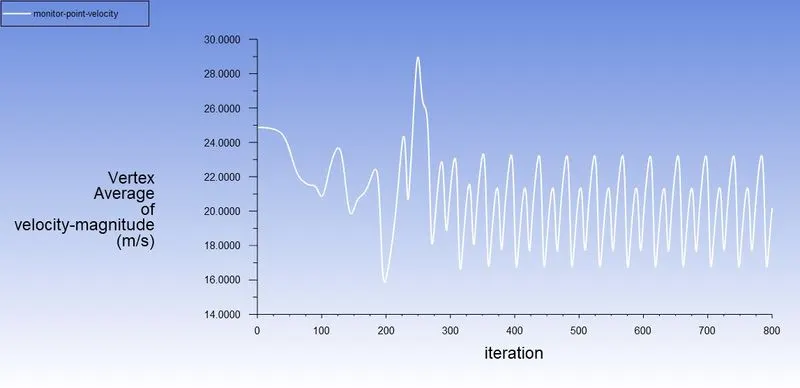
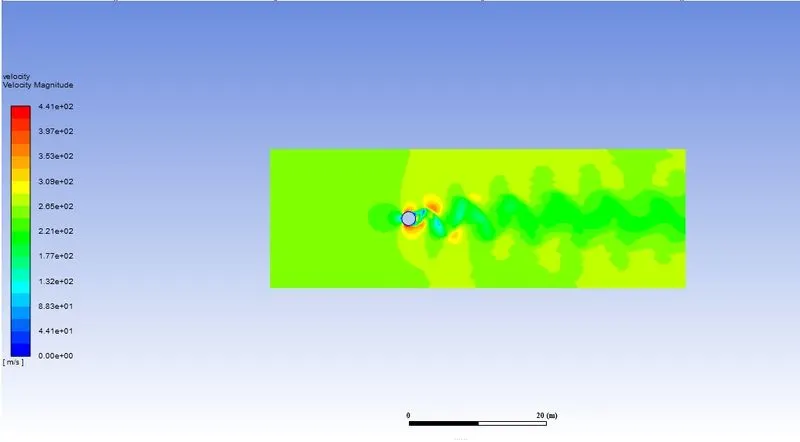
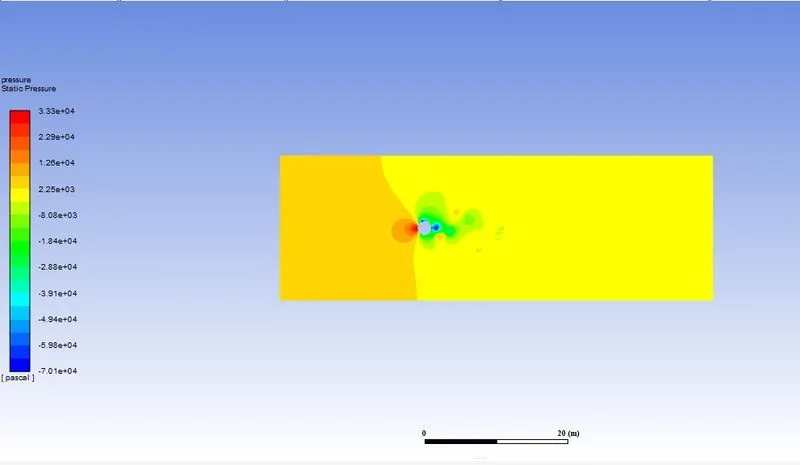
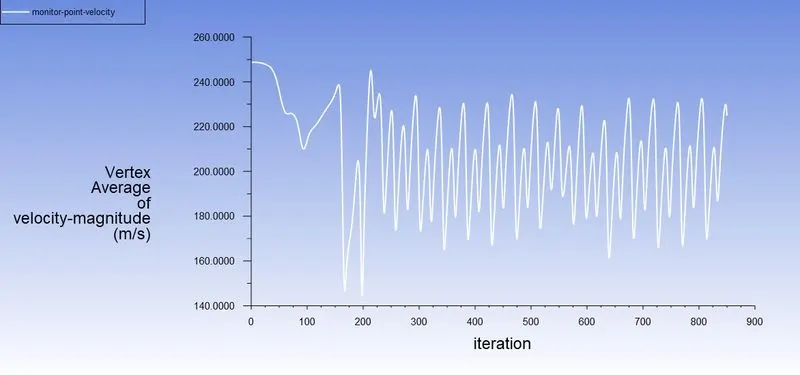
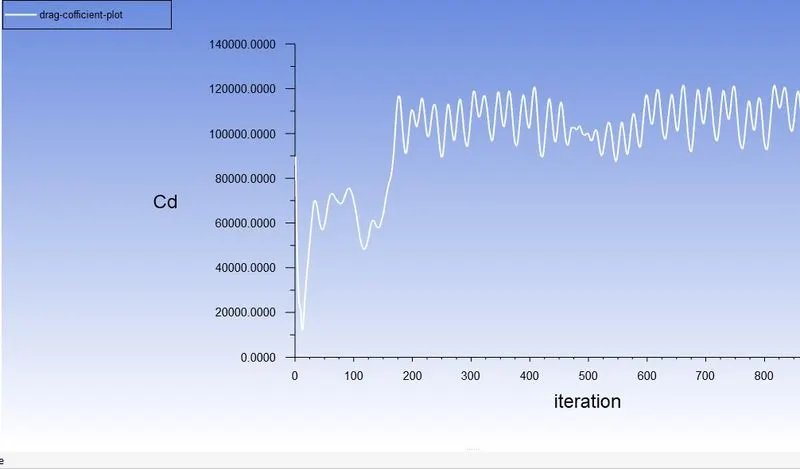
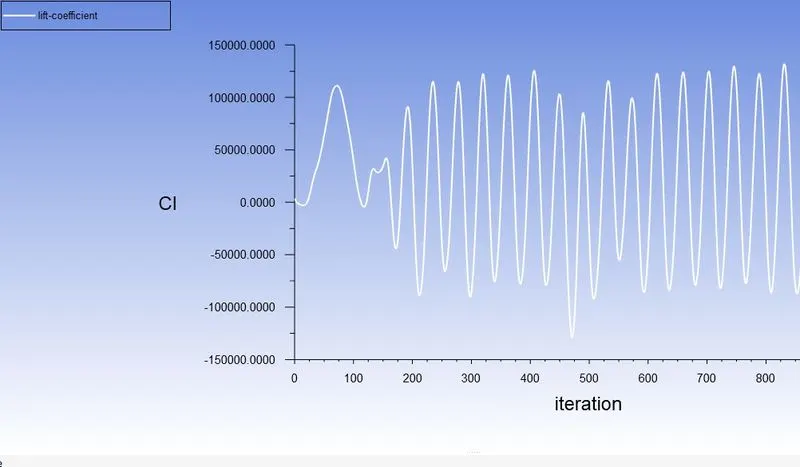
(iv) Simulate the flow with the steady-state solver for Re= 10000.
For Re=10000 velocity v=250m/s
- Velocity and pressure contours
- residual plot:
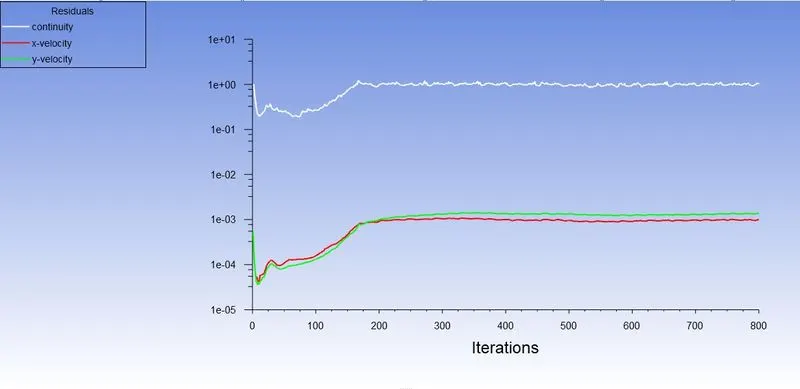
- velocity at the monitor point
- Drag and lift Coefficient:
(v) Simulate the flow with the steady-state solver for Re= 100000.
For Re=100000 velocity v=2500m/s
- Velocity and pressure contours:
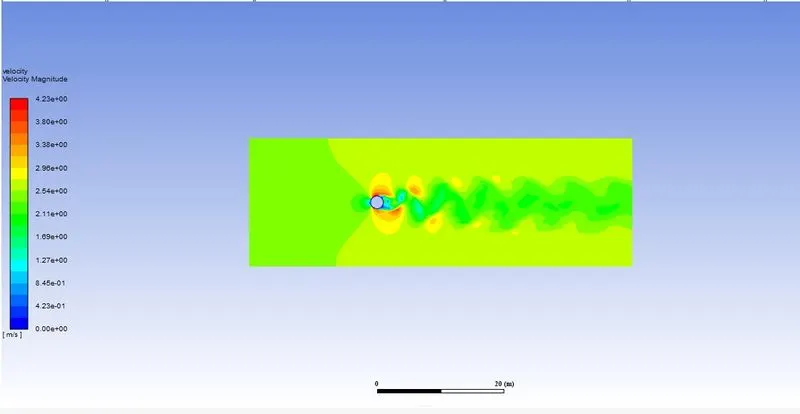
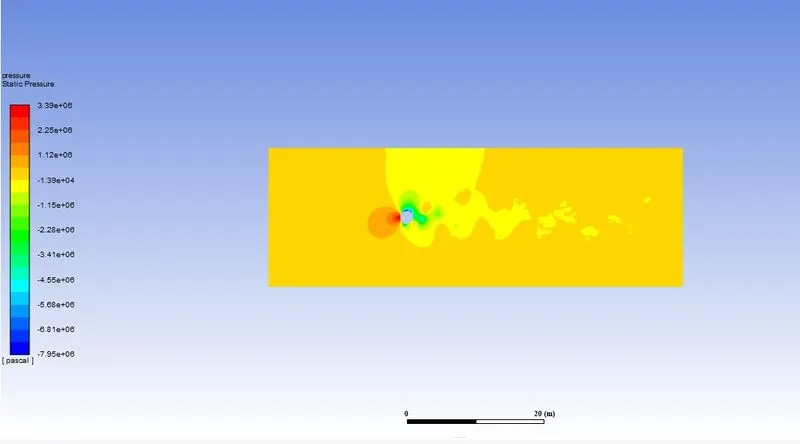
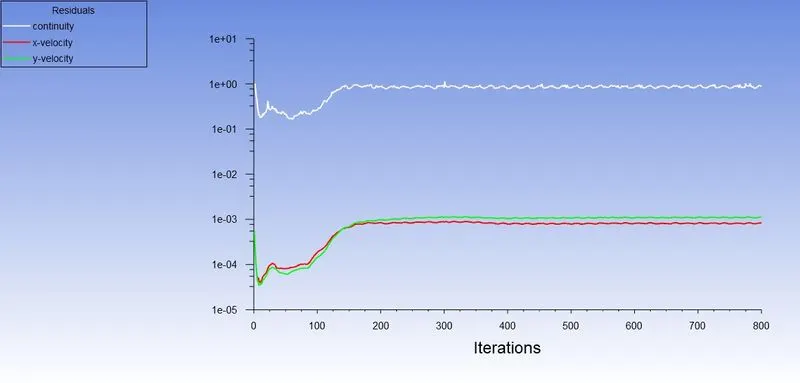
- residual plot:
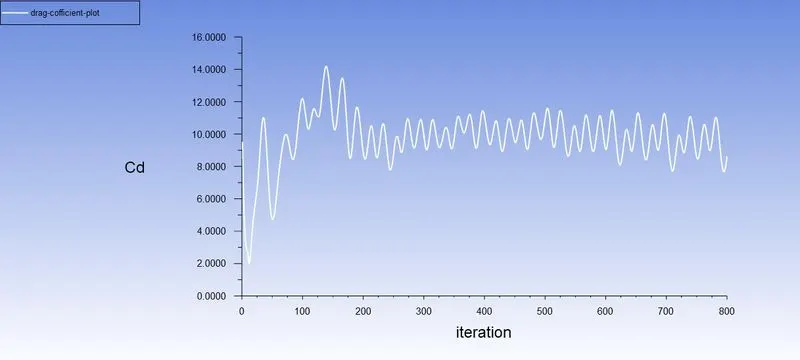
- Drag and lift Coefficient:
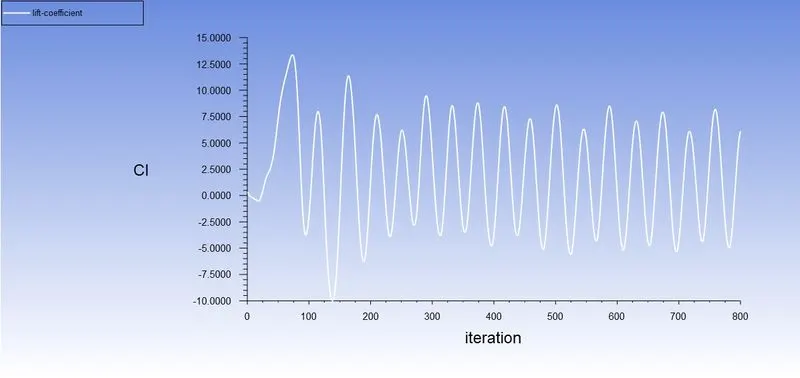
- velocity at the monitor point:
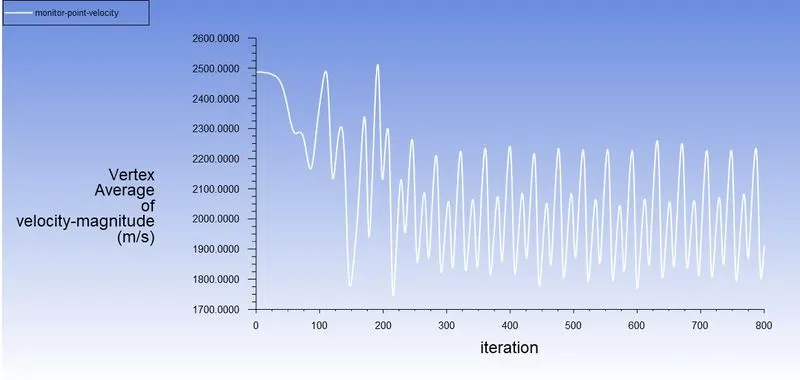
Result:
Drag and lift coefficient for different Re---- >
| Re | Cd | CL |
| 10 | 3.33 | -0.00155 |
| 100 | 1.365 | -0.13 |
| 1000 | 0.808 | -0.00839 |
| 10000 | 0.9876 | -0.373 |
| 100000 | 0.937 | 0.833 |
Error -- the theoretical values from the reference material,
| Reynolds number | theoretical Cd | Numerical Cd | error |
| 10 | 3.5 | 3.333 | 4.77% |
| 100 | 1.4 | 1.365 | 2.5% |
Conclusions:
- In the first case,
- the flow over a cylinder is simulated for both Steady and unsteady cases with Re=100, and with the results generated the phenomena of Von Karman Vortex Street are also observed.
- Necessary plots are plotted in order to observe that the flow is converged and the vortex shedding is happening.
- Contours are generated in order to observe the flow over a cylinder.
- By plotting Power Spectral Density vs Frequency, the Strouhal number is calculated.
- In the second case,
- six different simulations i.e. (Re = 10,100,1000,10000,100000,1000000) are simulated to observe the behavior of the drag and lift coefficients by changing the Reynolds number.
- In order to observe the behavior of the drag coefficients for the simulations, the velocity of the flow is varied to change the Reynolds number and the rest of the parameters are kept constant.
- As we know if the Reynold number is less than 2000, then flow in a pipe is Laminar. Hence we use the Viscous model = Laminar.
- For Re=10, it is observed that there is no formation of vortex shedding and in the rest of the cases, it is clearly observed.
- As per the basic conditions and parameters, the results are validated from the literature.
- As we refine the mesh we need to run more iterations.
- From the above table, it can be concluded that the error percentage is less than 5%.