Grid dependency test of Bevel gears using ANSYS Workbench
AIM: To perform structural analysis on bevel gears for different mesh sizes and compare the results using ANSYS Workbench.
GRID DEPENDENCY TEST: It is the process in which structural analysis is conducted using varying sizes of meshes until a suitable level of accuracy i.e required convergence is achieved. The test begins by using very coarse mesh and checking the results of critical areas. Then the mesh size is reduced and the procedure is repeated until a suitable level of accuracy is achieved. It is used in structural and other FEA analysis in order to create a balance between accuracy and simulation time.
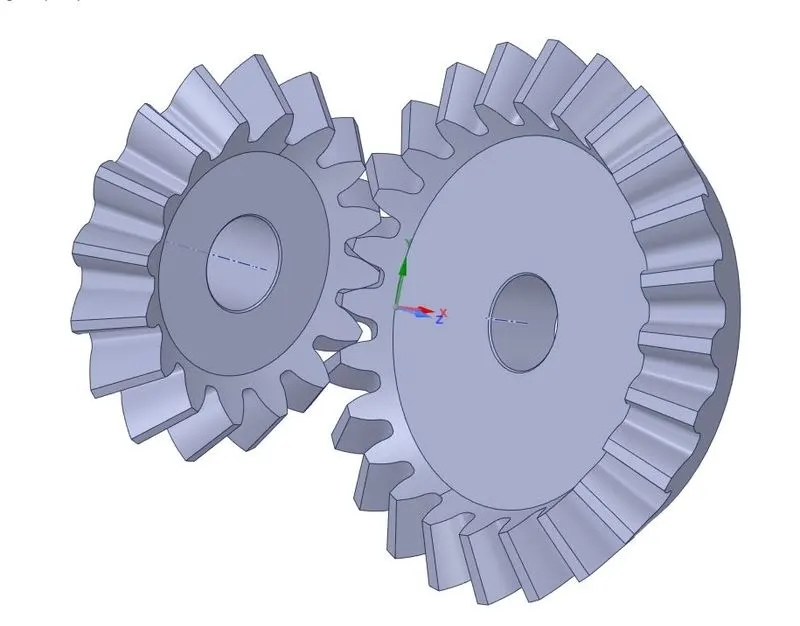
PROCEDURE: The bevel gear geometry is imported into ANSYS Workbench and is shown below:
The central part of the gears is not required for analysis and can be removed. The edited geometry of the bevel gears is shown below:
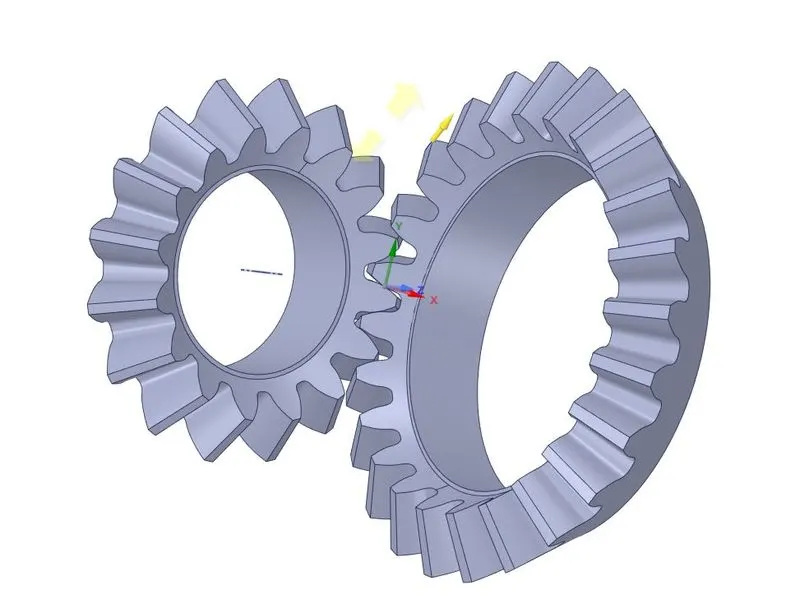
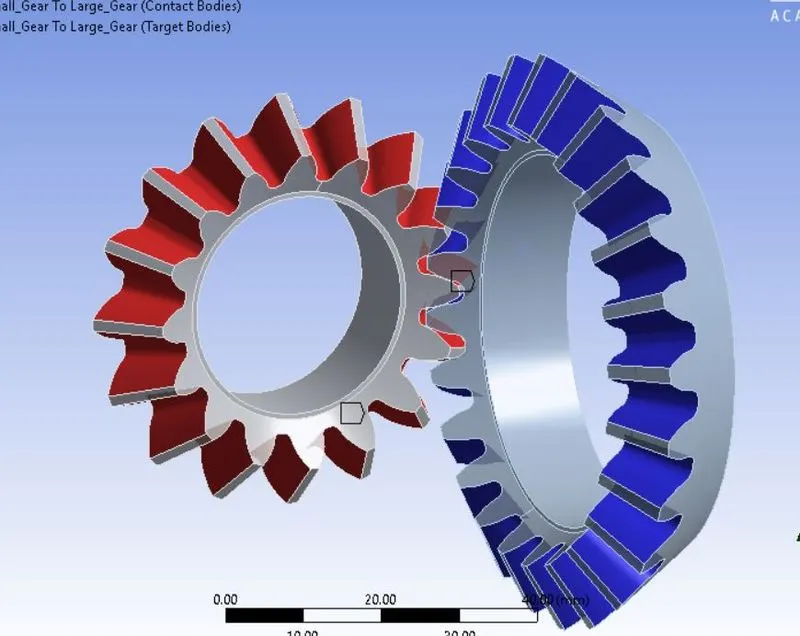
The geometry is given material "Structural Steel". The contacts are provided to the teeth of the gear as shown below:
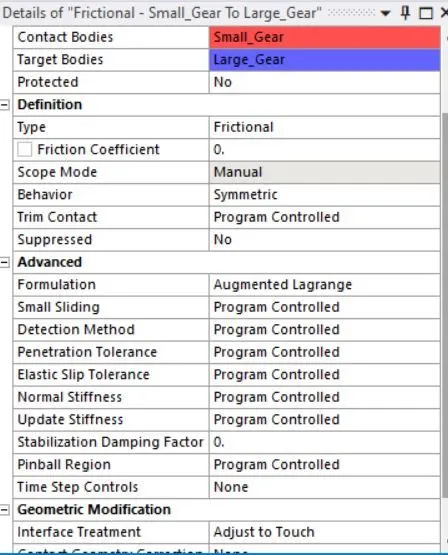
The contact type is given as frictional contact with properties given below:
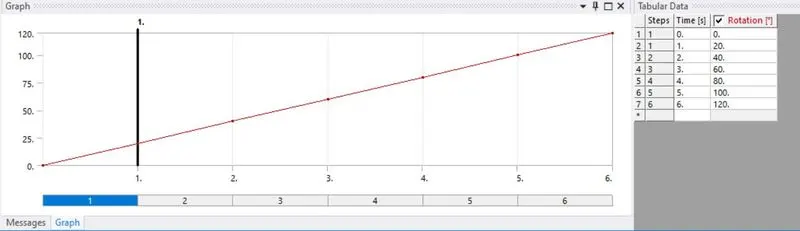
Revolute joints are given to both gears and the small gear is given rotation boundary condition till it rotates by 120 degrees in six steps as shown below:
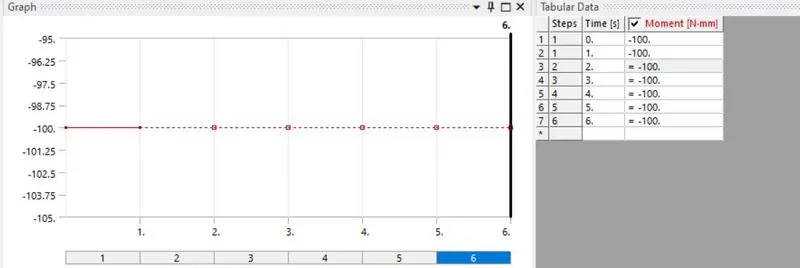
The bigger gear is given a rotational stiffness of 100 N-mm as shown below:
Initial timestep of 0.1 s is given.
CASE 1: Mesh size = 6mm:
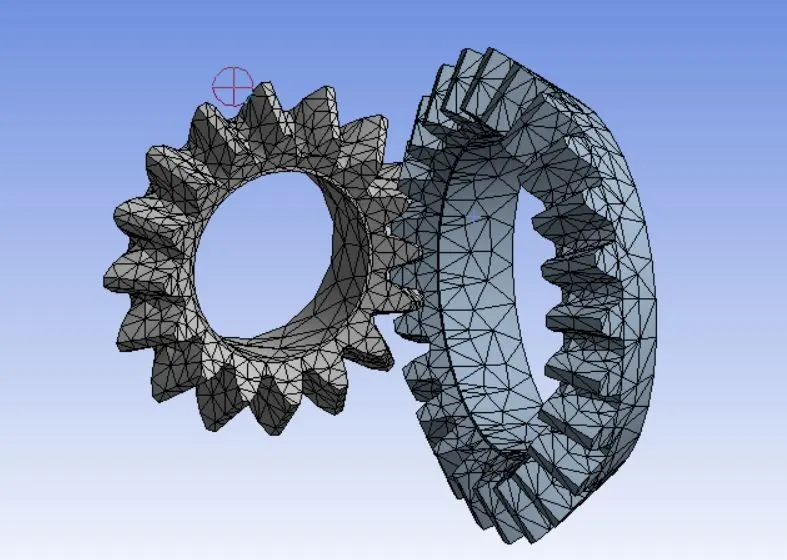
The mesh size is given as 6 mm and the mesh is given below:
The mesh metrics with distribution of mesh sizes is shown below:
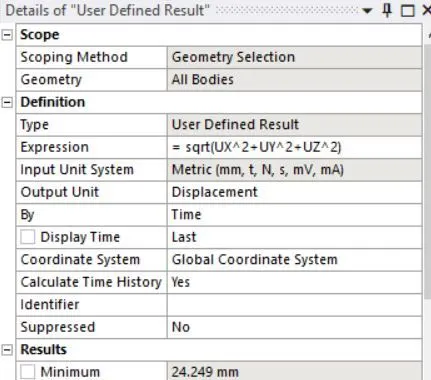
The mesh was solved for deformation, stress and strain. A user defined value for deformation was also asked as output. The value was given as U=sqrt(UX^2+UY^2+UZ^2). The user defined function settings is shown below:
The deformation contour is given below:
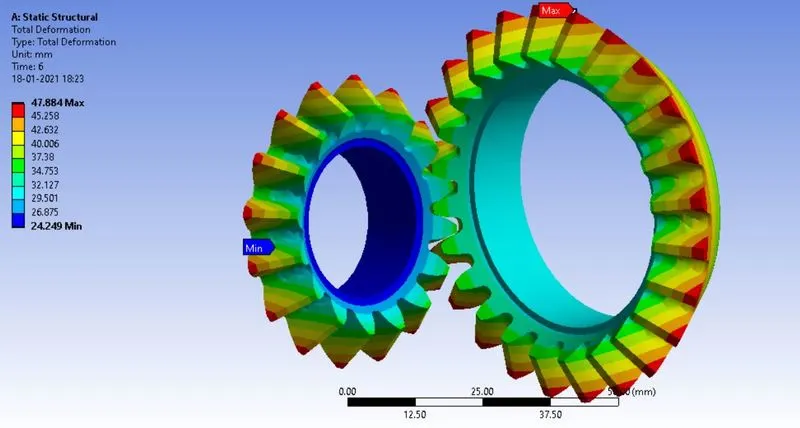
A maximum deformation of 47.884 mm is seen. This is compared to the user-defined deformation contour as shown below:
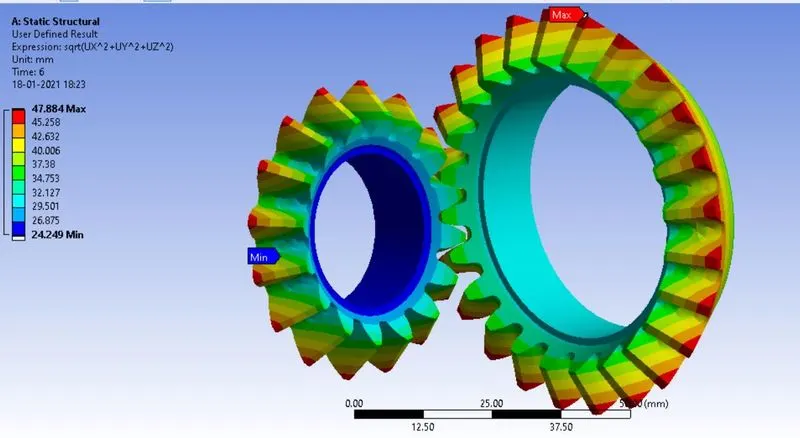
The user-defined deformation matches the program-controlled deformation and shows the same maximum of 47.884 mm deformation value. The stress contour is given below:
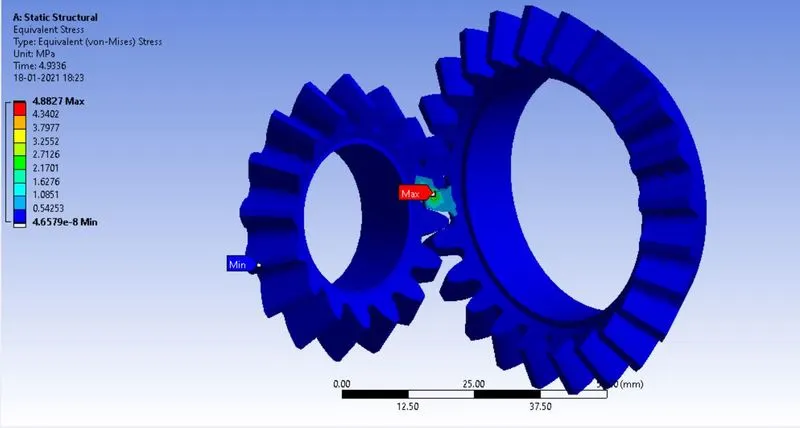
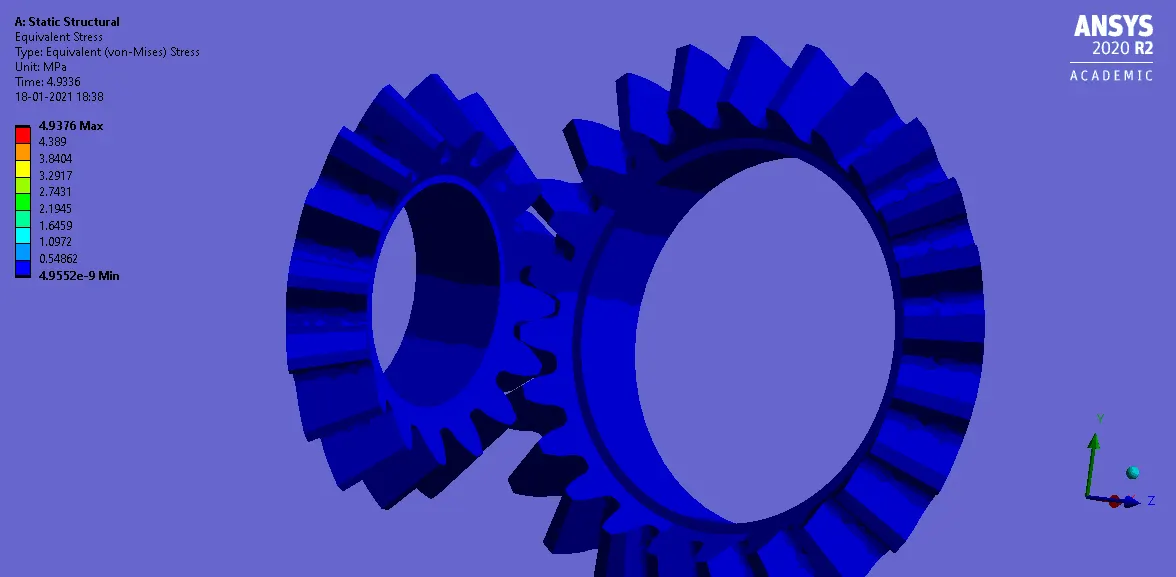
The stress variation with time is plotted below:
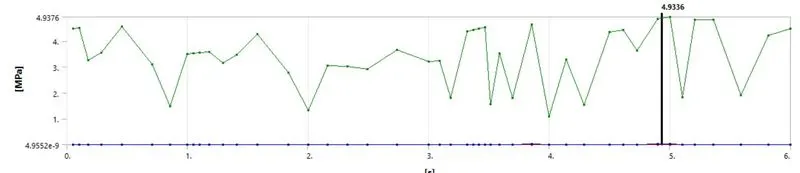
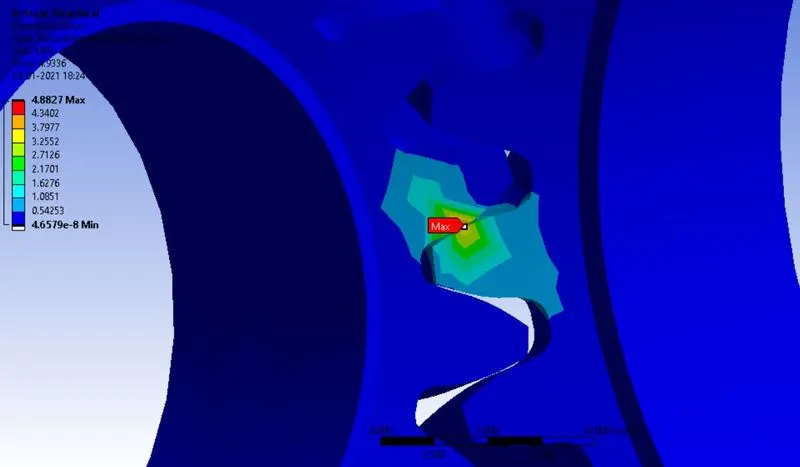
A maximum stress of 4.9376 MPa is seen. The maximum stress region is given below:
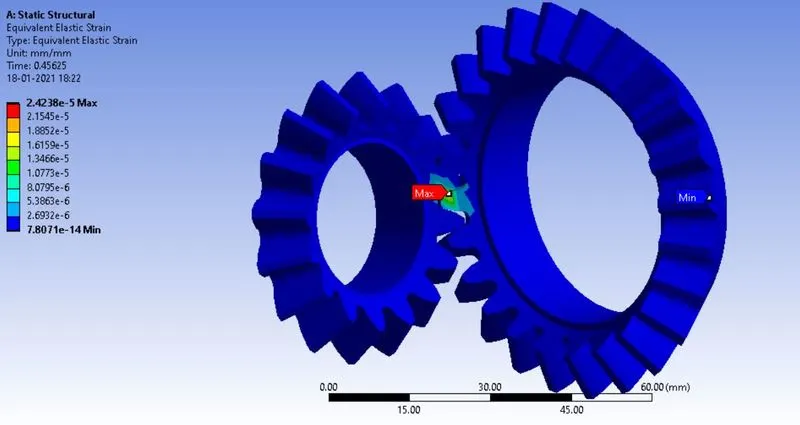
The strain contour is given below:
The strain variation with time is plotted below:
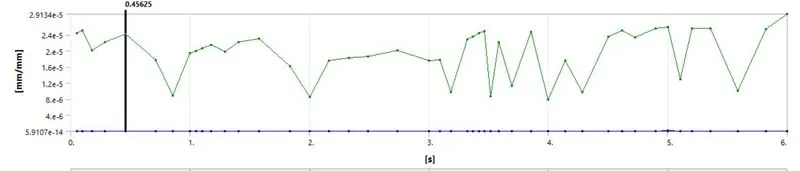
As can be seen, the maximum strain is 2.9134 e-5.
Case 2: Mesh Size = 5mm:
The mesh size of 5mm was selected and is shown below:
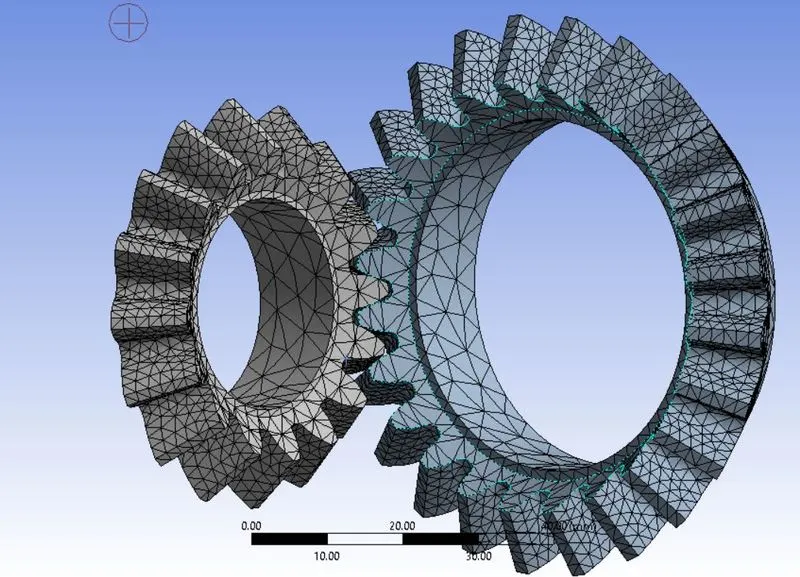
The mesh was solved for deformation, stress, strain and user-defined function for deformation. The results are given below:
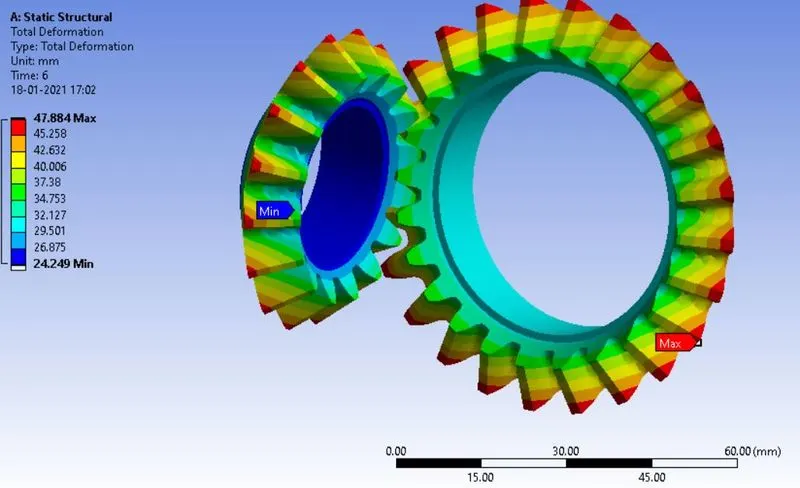
Above given is the deformation contour that peaks at 47.884 mm. This is compared to the user-defined value of deformation whose contour is given below:
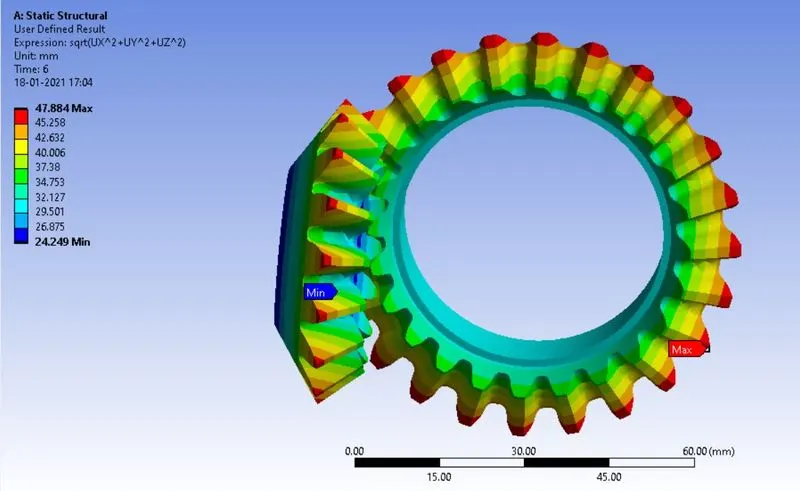
The Von-Mises stress contour is given below:
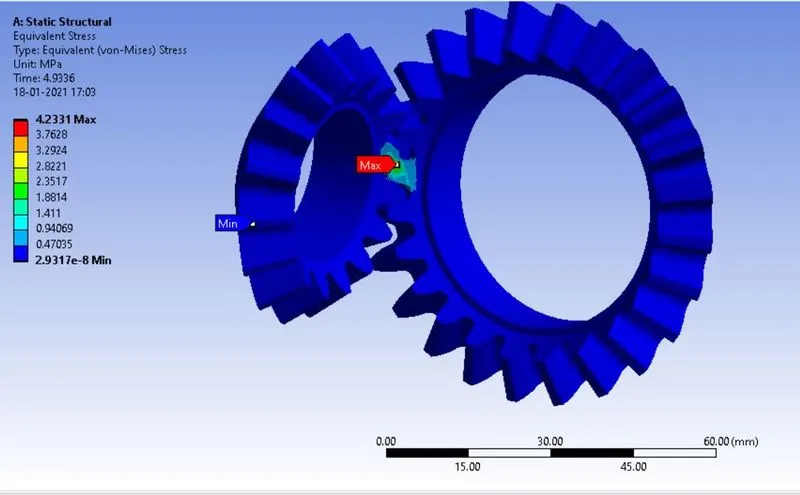
The variation of stress with time is plotted below:
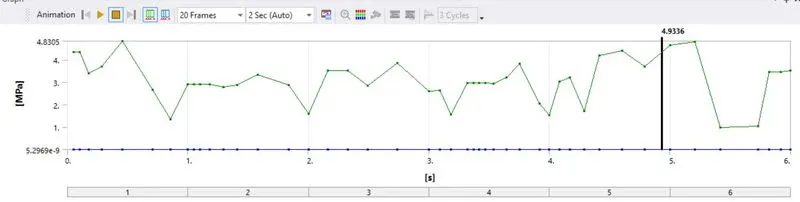
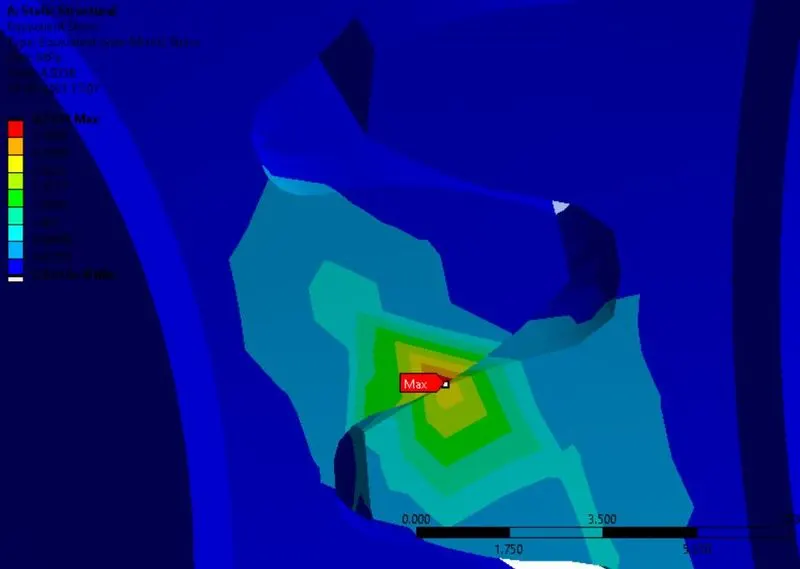
A maximum stress of 4.8395 MPa is seen. The region with maximum stress is shown below:
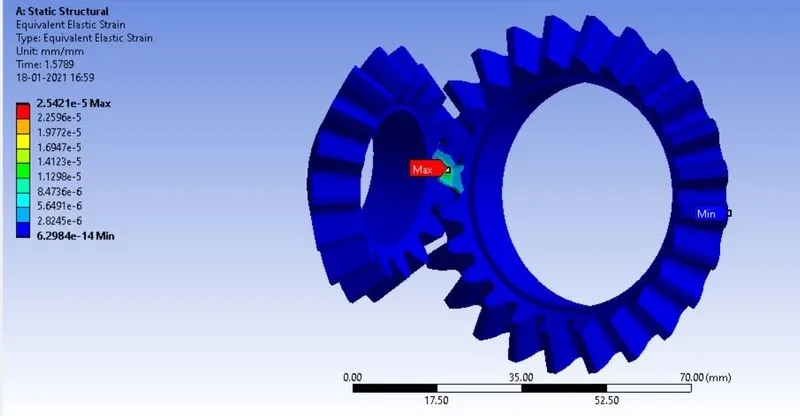
The strain contour is given below:
Strain variation with time is plotted below:
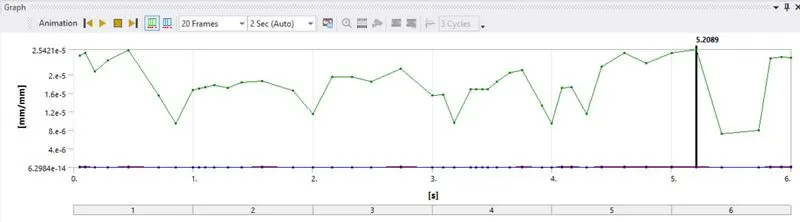
Maximum strain of 2.5421 e-5 is observed.
Case 3: Mesh size = 4mm:
The mesh size 4 mm is given as shown below:
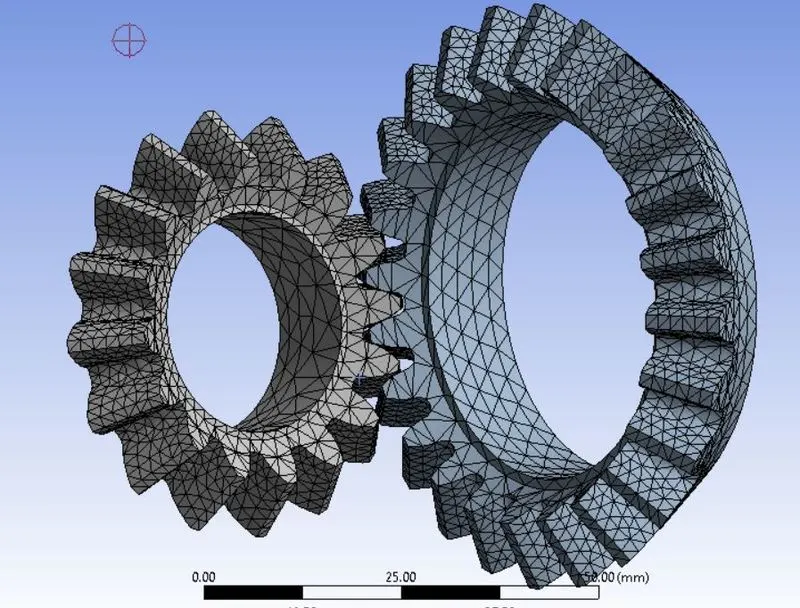
The mesh is solved for deformation, stress and strain. The deformation contour is shown below:
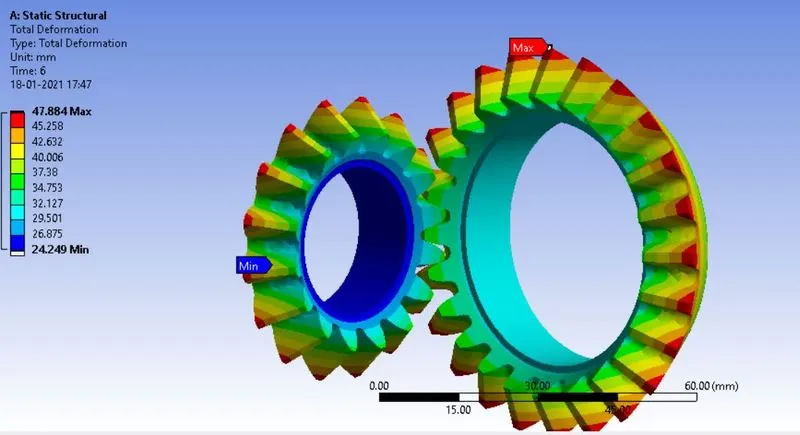
A maximum deformation of 47.884 mm is seen. This is compared to the user-defined deformation contour shown below:
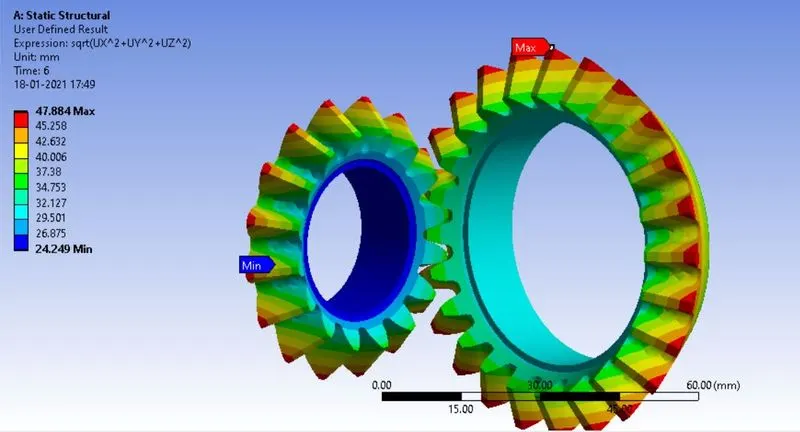
The user-defined deformation contour is the same as the previous contour with maximum of 47.884 mm.
The stress contour is given below:
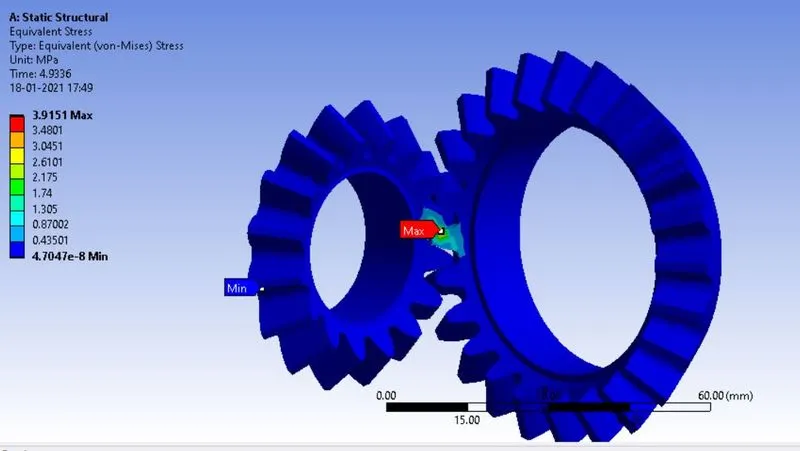
Stress variation with time is given below:
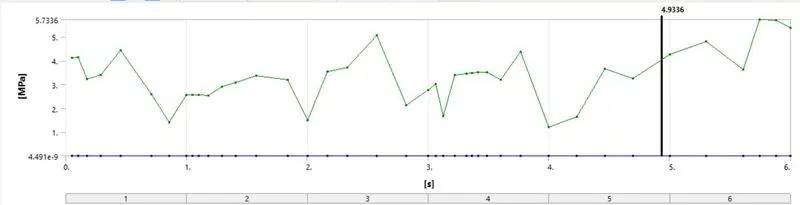
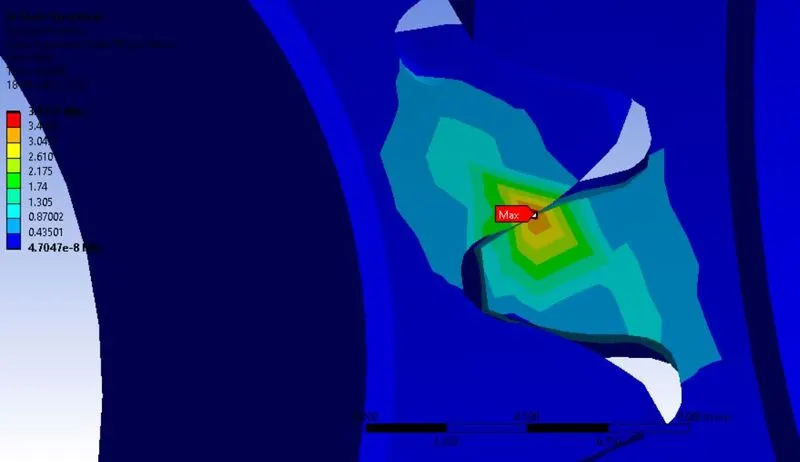
A maximum stress of 5.7336 MPa is seen. The region with maximum stress is given below:
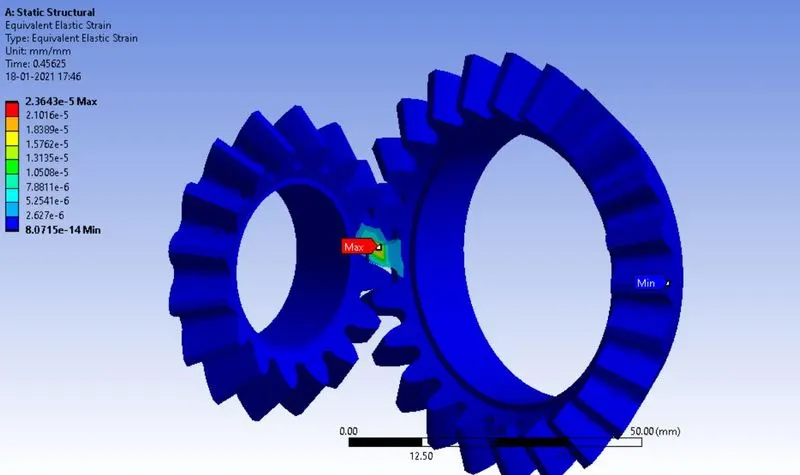
The strain contour is given below:
Strain variation with time is plotted below:
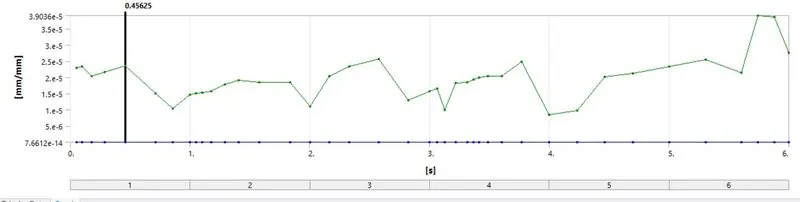
Maximum strain of 3.903 e-5 is observed.
The results from all three cases can be summarized using the table below:
|
Mesh Size |
Max Deformation |
User-Defined Deformation |
Max Stress |
Max Strain |
|
6 mm |
47.884 mm |
47.884 mm |
4.9376 MPa |
2.9134 e-5 |
|
5 mm |
47.884 mm |
47.884 mm |
4.83 MPa |
2.5421 e-5 |
|
4 mm |
47.884 mm |
47.884 mm |
5.7336 MPa |
3.903e-5 |
As can be seen, the deformation values do not change irrespective of mesh sizes. Also, the user-defined deformation value is the same as the program-controlled deformation value. Hence, the user-defined function is valid.
Maximum stress value changes with mesh size and is maximum at 4mm mesh size. Similarly, strain value changes with mesh size and is maximum at 4mm mesh size. This variation is due to change in accuracy. Lower mesh size leads to higher accuracy. Higher mesh size leads to more results being reliable on the corresponding element's interpolation function which leads to inaccuracies in results. Therefore, the results obtained when using 4mm element size is the most reliable result.
CONCLUSION: The structural analysis of the bevel gear was successfully performed and the results such as deformation, stress and strain were discussed and compared quantitatively.