Week 12 - Final Project - Modelling and Analysis of a Datacenter
Aim: To model the data center and analyze airflow patterns and temperature distribution in the data center
Introduction:
A data center is a building, a dedicated space within a building or a group of buildings used to house computer systems and associated components, such as telecommunications and storage systems.
A data center is a facility that centralizes an organization's shared IT operations and equipment for the purposes of storing, processing, and disseminating data and applications. Because they house an organization's most critical and proprietary assets, data centers are vital to the continuity of daily operations.
Data centers are made up of three primary types of components: compute, storage, and network.
The essential components of any data center often include cybersecurity systems, firewalls, routers, servers, storage systems, and switches. A core commonality of all data centers is servers.
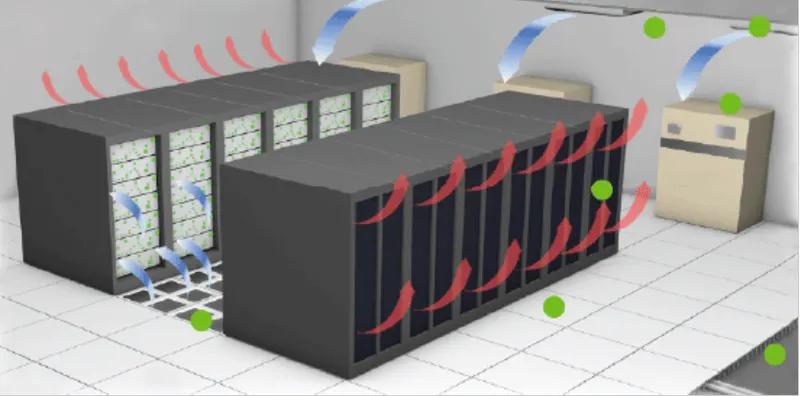
A typical data centers are shown below


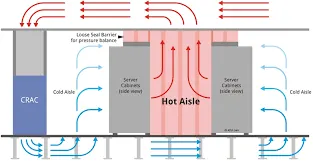
A typical Data center cooling technique is shown below
Procedure:
Step 1: Building up the model
1. Building the cabinet
The default cabinet is resized with the dimensions given as per the data given
(Note: All the dimensions given in this problem are in imperial system)
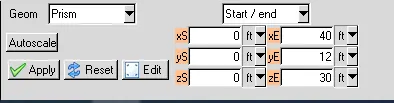
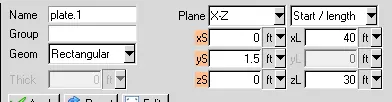
2. Create a plate in x-z plane at a distance of 1.5 ft in +y direction with the same area as the cabinet.
3. Creating CRAC panel from the Macros with the following specifications.
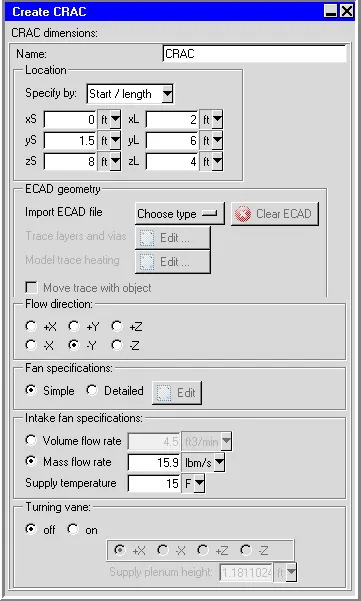
The CRAC unit, intake fan and exhaust fan is created in a group under the name CRACs.
Create a copy of CRACs at a distance of 10 ft in z direction. The model after modeling two CRAC units will be seen as shown in Fig. 3.1
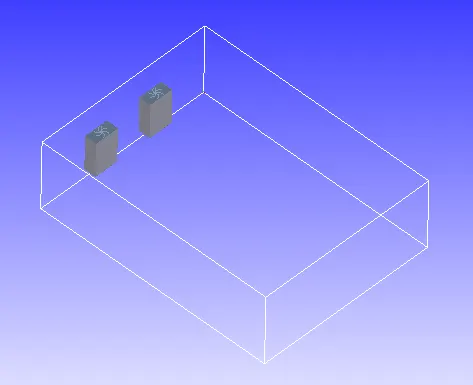 Fig. 3.1 CRAC units
4. Create a Rack (Front to Rear) using Macros with a heat load of 3000 W along with the following specifications.
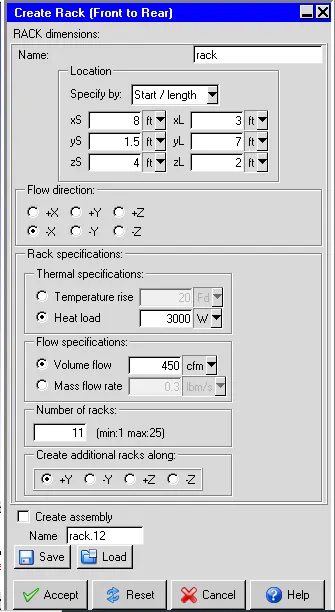
After creating the Rack, the model will look as shown in Fig 4.1
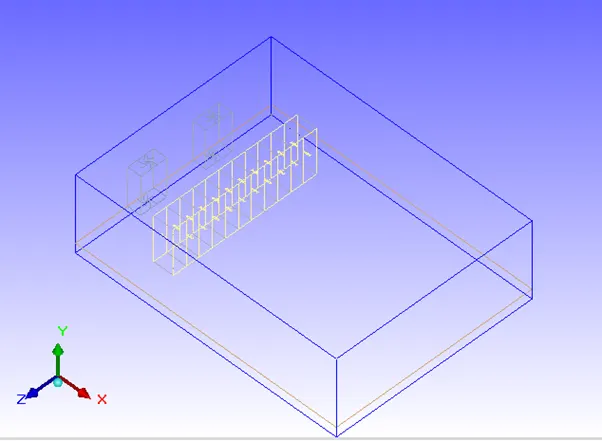
Fig. 4.1 Rack (Front to Rear)
Now create a group named RACKs and add all the components relating to RACK in the group. Create a copy of RACKs as shown in Fig. 4.2.
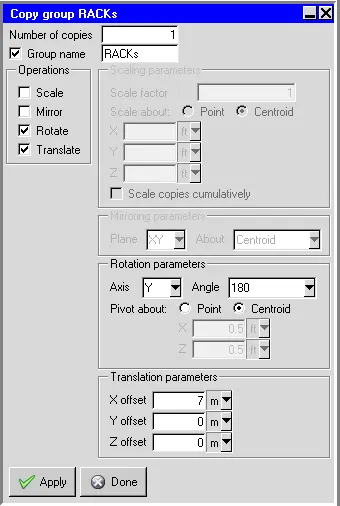 Fig. 4.2 copy of RACKs
5. Again create another group of HDRACKs with the heat load of 7000 W the following specifications
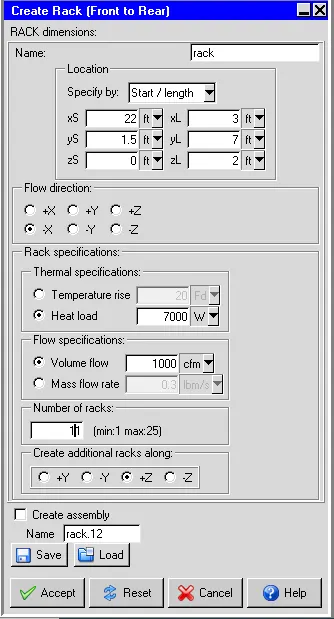
Repeat the procedure as shown in Fig. 4.2 under the group name HDRACKs
Final model after creating the RACKs and HDRACKs is shown in Fig. 5
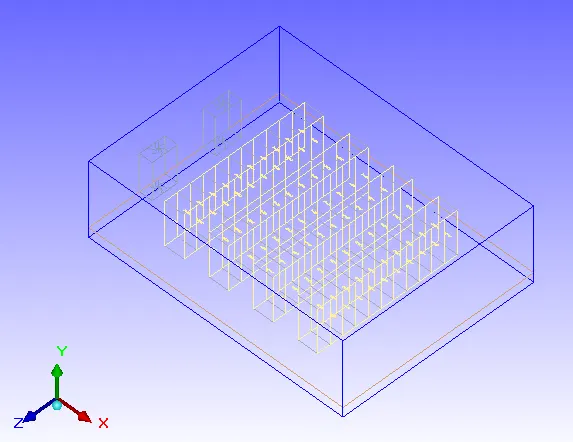
Fig. 5 RACKs and HDRACKs
6. Create tiles using the option in MACROS with the following specifications:
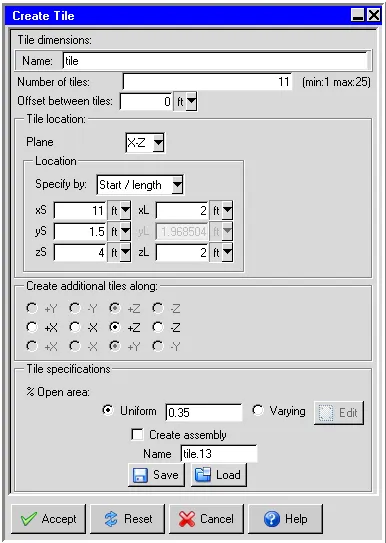
Create a group named TILEs which consists of all the tile components.
Copy the group TILEs and translate it with an X offset of 2 ft.
Next copy the whole group of TILEs and translate it with an X offset of 14 ft.
The model, after creating the TILEs is shown in Fig. 6
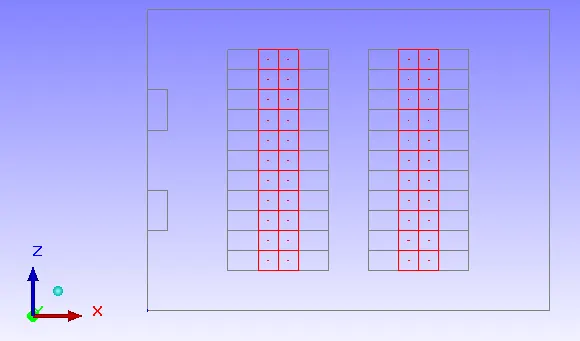
Fig. 6 Creation of Tiles
7. Create another plate in x-z plane for the ceiling plenum at a distance 10 ft in +y direction with an area of 1200 sq. ft as shown in Fig. 7
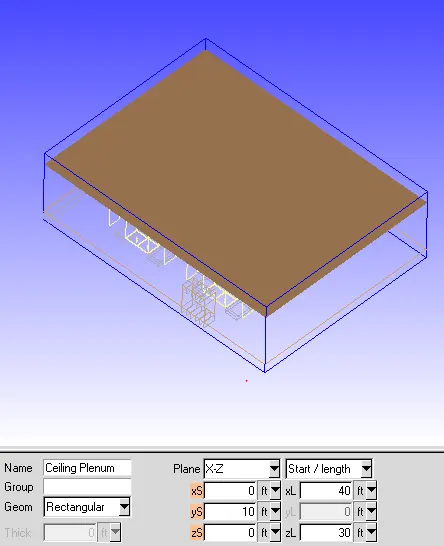
Fig. 7 Ceiling Plenum
8. Creating Grilles near the RACKs and HDRACKs
Create a grille in the x-z plane at the following location. set the free area ratio to 0.5
Create this grille in the CEILING-RETURN group.
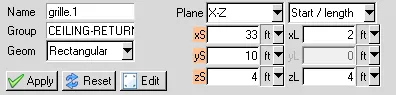
Create 2 copies of the grille under the same group name with z offset of 9 ft as shown in Fig 8.1
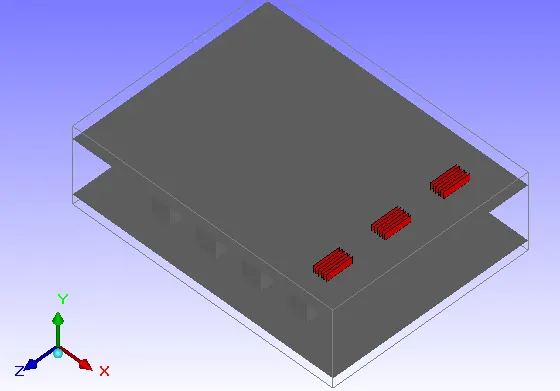
Fig. 8.1 Copy of Grilles
Copy the ceiling-return grilles with an x-offset of -14 ft.
The model after creating grilles is shown in fig. 8.2
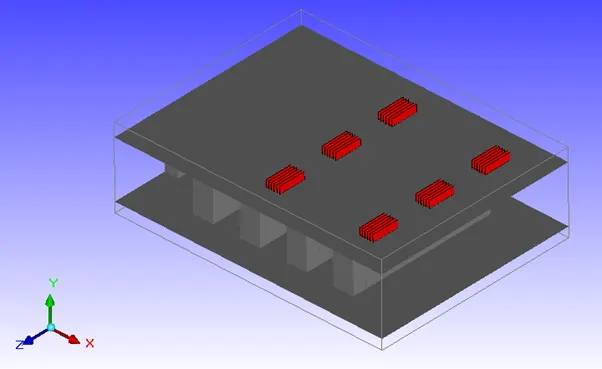
Fig. 8.2 Grilles near the HDRACKs nad RACKs
Create two more grilles naming Ceiling-return-crac1 on the Ceiling plenum above the CRACs units with the following location with the free area ratio of 0.5.
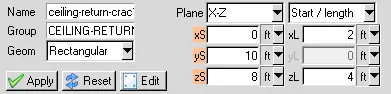
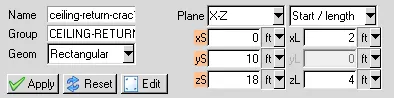
The model is shown in Fig. 8.3
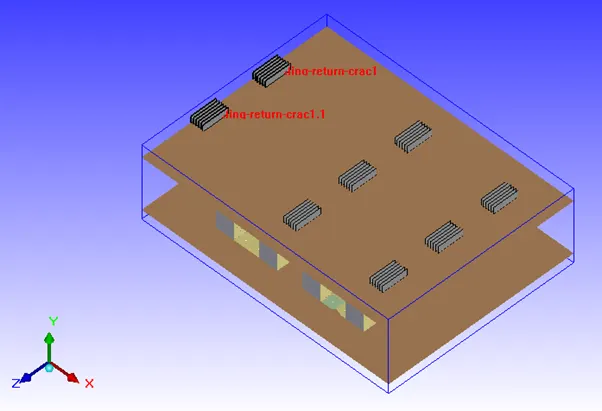
Fig. 8.3 Grilles above CRACs units
9. Create PDU (Power Distribution Unit) using MACROS with a heat output of 3600 W with the following specifications:
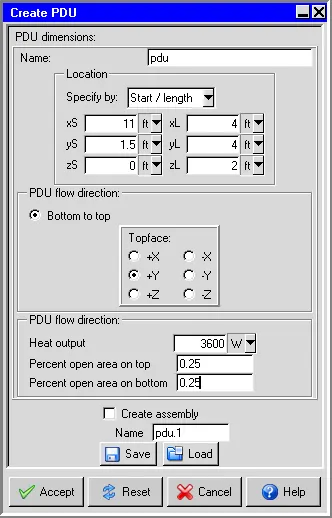
Create a new group naming PDUs. Copy the group PDUs and translate it with an x offset of 14 ft and z offset of 28 ft under the same group PDUs.
After modeling the PDU, them model is shown in Fig. 9
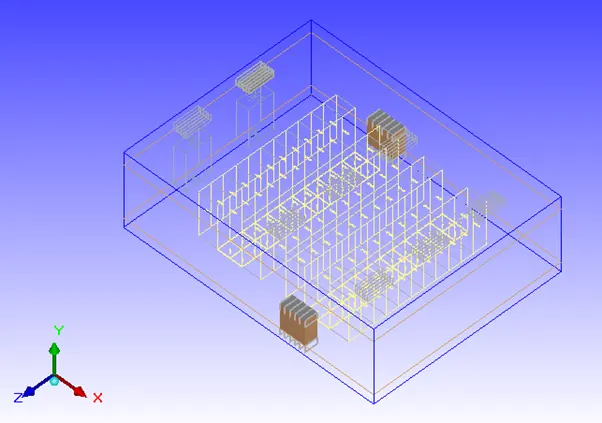
Fig. 9 Power Distribution units (PDUs)
10. Create piping below the CRAC units.
- Create a block named Piping under the group BLOCKAGE with the following specifications:
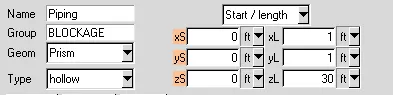
The model is shown in Fig. 10.1
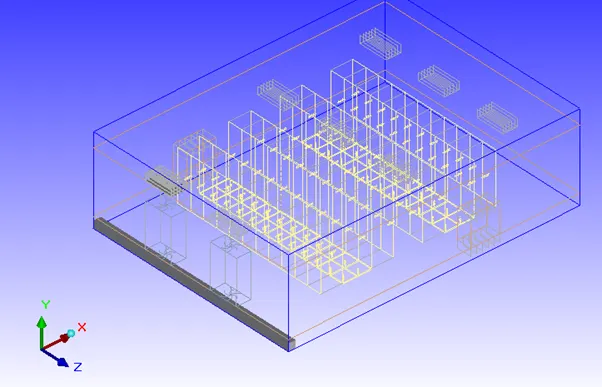
Fig. 10.1 Piping
Create another block naming blockage under the same group BLOCKAGE with the following specifications
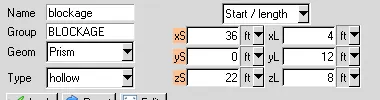
The model is shown in Fig. 10.2
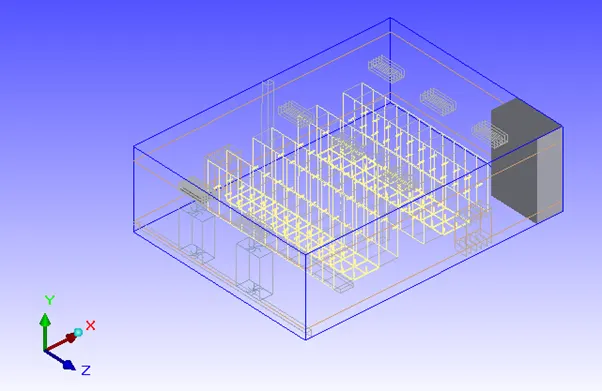
Fig. 10.2 Blockage
11. Creating Columns between the RACK and HDRACK
Create two blocks naming column1 and column2 under the group COLUMNs with the following specification:
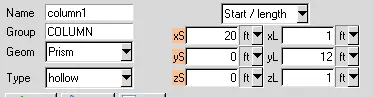
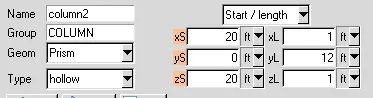
12. Creation of Cabletrays
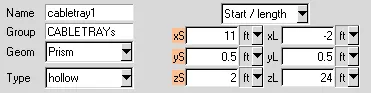
Create a block naming cabletray under the group name CABLETRAYs with the following specifications:
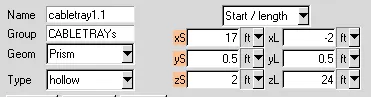
Create another cable tray under the same group name CABLETRAYs with the following specification:
Copy the CABLETRAYs group and translate with an X offset of 14 ft. The final model is shown in Fig. 12
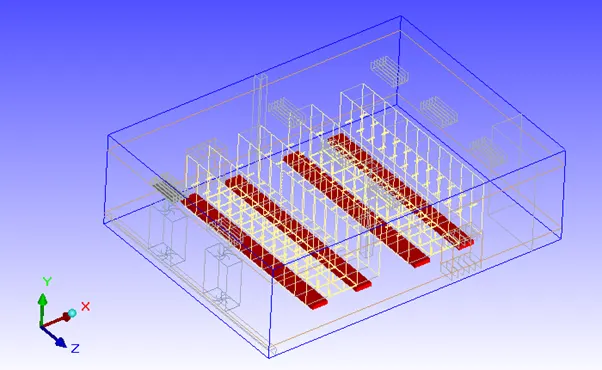
Fig. 12. Cable trays
The final geometry is shown in Fig. 13
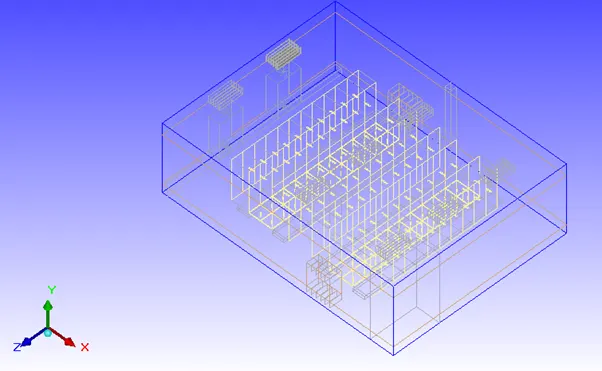
Fig. 13. Final Model
Step 2: Meshing
The mesh is generated with the following specifications
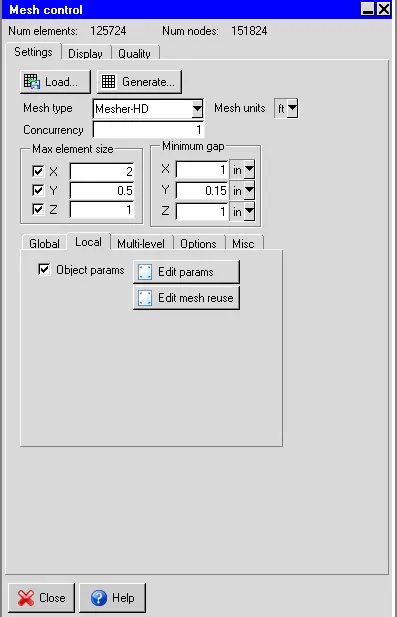
A normal mesh is created which has resulted in a mesh count of 125724 elements. The cutplane mesh in X plane through centre, Y plane through centre and Z plane through center is shown in Fig. 14a, 14b and 14c respectively.
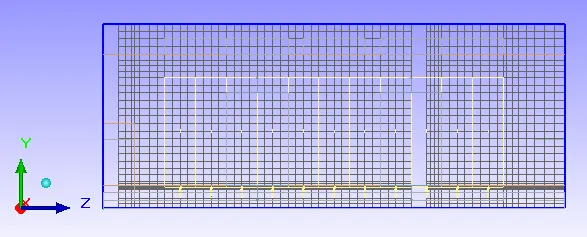
Fig. 14 a
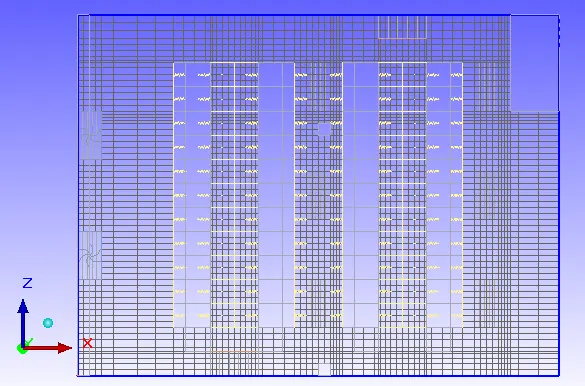
Fig. 14 b
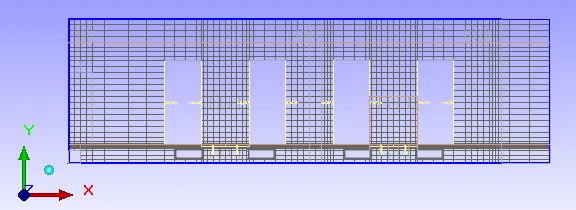
Fig. 14 c
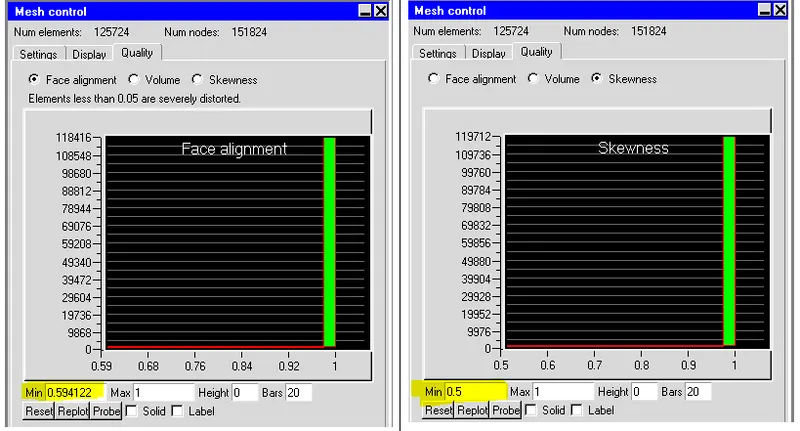
The quality of the mesh looks good with the given specifications. The face alignment and teh skewness is shown in below.
Two monitor points were created to know the temperature above the exhaust fan of the CRAC units.
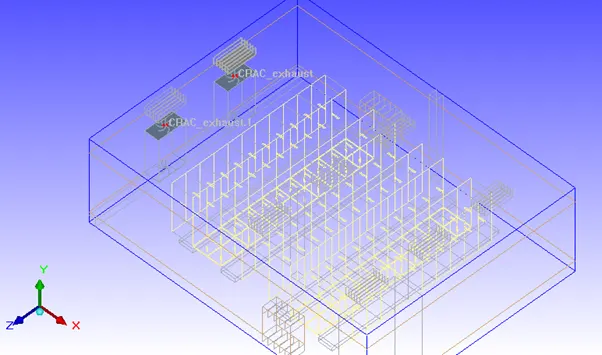
Fig. Creation of monitor points
Step 3: Problem setup and solver settings
The problem is solved for velocity and temperature without radiation.
The flow is considered to be turbulent and zero equation turbulence model is used along with enabling gravity vector to consider natural convection too.
The default material is chosen to be Mica-typical for solid and paint-non-metallic for default surface.
An initial velocity of 0.5 m/s in Y direction is given for initializing the solution and the problem is solved using ideal gas law.
The species option is enabled in the advanced setup.
The h2o concentration for CRAC_intake and CRAC_intake.1 is given as 0.5.
For solution settings, double precision is used. The body force discretization scheme is used for pressure and first order discretization scheme is used for Momentum, temperature and h20. Under relaxation factors of 0.2 and 0.1 were used for momentum and body force respectively.
Step 4: Results and Discussion
After getting the convergence, the results are plotted.
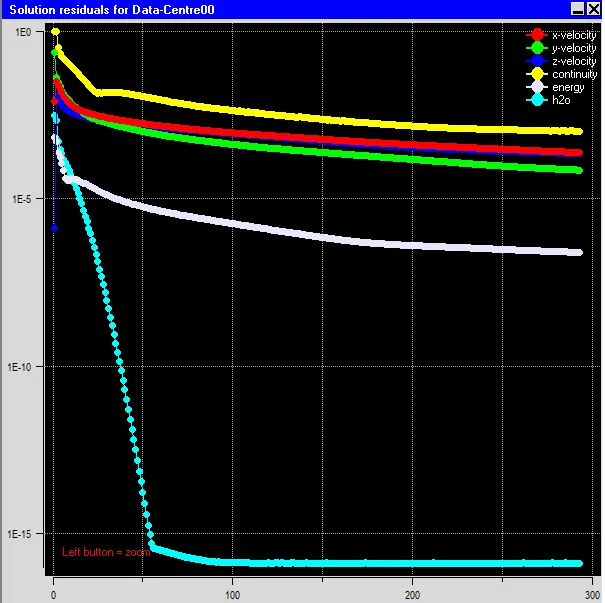
Fig. Convergence plot
Results:
The temperature distribution in CRACs, RACKs, HDRACKs and PDUs are shown in Fig. 15
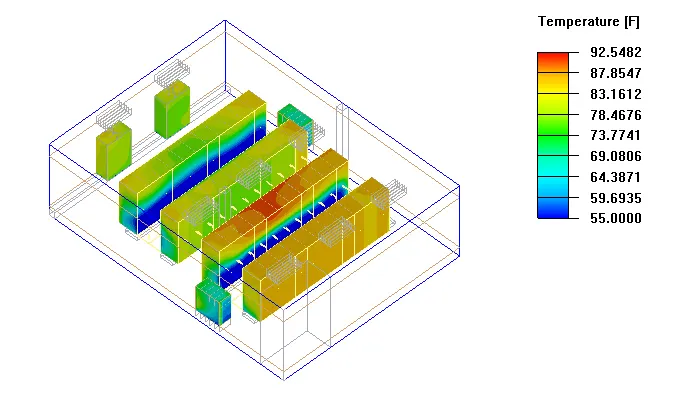
Fig. 15 Temperature contour
From the Fig. 15, it is clear that the maximum temperature in the cabinet is 92.5oF near the HDRACKs as it was generating maximum amount of heat.
The cut plane temperature is plotted in Fig. 16
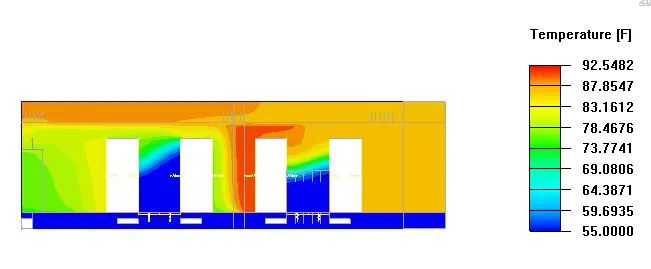
Fig. 16 Z plane through center temperature plot
In Fig. 16, it is clear that the maximum temperature is 92.5oF and minimum temperature is 55oF. The cold air is flowing in the below the bottom plate.
The particle tracks of air in the Data center is shown in Fig 17.
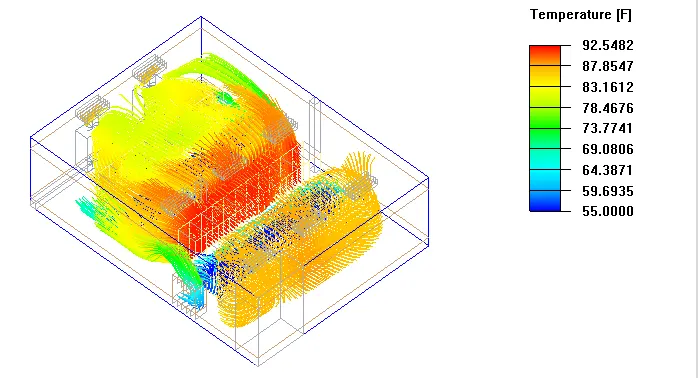
The particle movement video link is given below
Conclusion
In this challenge, we learnt about the modeling of Data center components using Macros.
The temperature contours and the air flow pattern in/through the important components like CRACs, RACKs, HDRACKs and PDUs were analysed. It is seen the temperature of the Data center is operating within the temperature limits with the given flow specification.