Week-11 Challenge: Braking
AIM:- 1) To find the energy required for braking.
2) To discuss the electric and mechanical braking.
3) To make a MATLAB program for contour plot of torque, speed and efficiency.
QUESTIONS:-
Q.1) For a defined driving cycle, calculate the energy required for braking.
The braking energy is calculated by using the following Kinetic Energy formula while accelerating.
`K.E. =1/2*m*v^2`
The Braking energy is calculated in an excel sheet.
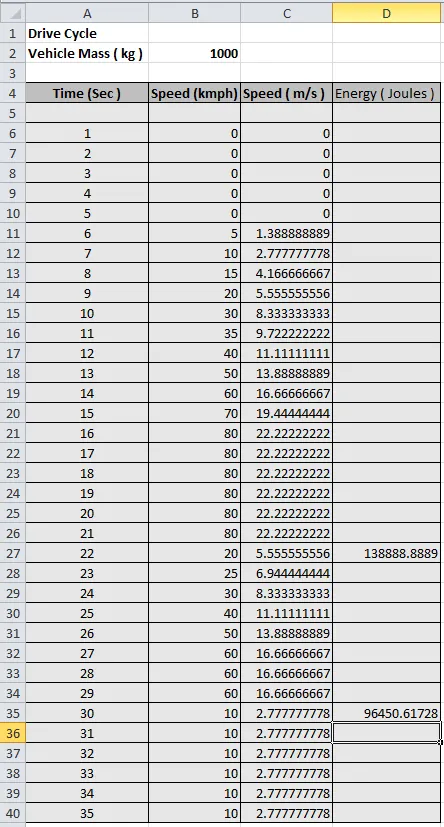
While calculating the kinetic energy while acceleration, we take initial velocity as a minimum and final velocity as maximum. But in the braking case, it is the reverse of that. Her we take initial velocity as maximum and final velocity as a minimum.
Therefore,
Braking Energy = `K. E. = 1/2*m*(Vi - Vf) ^2` (in Joules)
Where,
m = Mass of vehicle (kg)
Vi = Initial Velocity (m/s)
Vf = Final velocity (m/s)
Here, in the mentioned drive cycle two times brakes are applied. For deceleration from 80kmph to 20kmph.the energy required is 138.88 kJ. And from 60 kmph to 10 kmph, the energy required is 96.45 kJ. Hence, the Total Braking Energy required is 235.33 kJ.
Q. 2) Why electric motor can’t develop braking torque at a high speed similar to starting? How electric and mechanical brakes are coordinated?
Answer:
Braking torque at high Speed:-
Speed torque characteristics is given in the below figure.
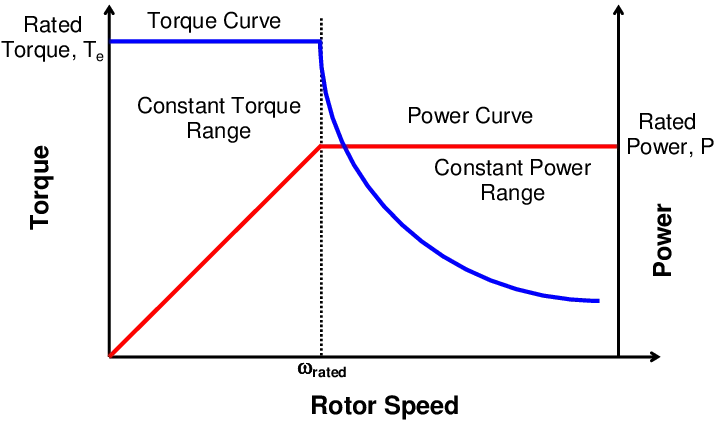
From the above figure you can observe that the vehicle requires high torque initially at low speed to gain the suitable power and vehicle runs at constant Torque region. After a while when the vehicle achieves a its maximum or required speed then it runs on constant power region cause vehicle has atained the sufficient speed.
Constant Torque and Constant Power Region are two different terminology. High Torque is required only to gain the initial speed which we can say a push force. After speed is gained, there is no need of maximum torque instead Maximum Power is required to achieve maximum speed further.
Now, before braking, the vehicle is already in running condition. So, we can say from the figure that it runs in constant power region, and not in the constant torque region.
In the constant power region, because the torque is very low, we will never get the high torque while braking ( deccelerating) as that of the time of aceeleration.
Hence, electric motor can’t develop braking torque at high speed similar to starting.
Electric and Mechanical brakes combination:
Today's EV and HEV use Regenerative Braking. Regenerative braking is unique to EVs and HEV which enables the vehicle’s kinetic energy to be converted back to electrical energy during braking (deceleration or downhill running). The converted electrical energy is stored in energy storage devices such as batteries, ultracapacitors, and ultrahigh-speed flywheels to extend the driving range by up to 10%.
Regenerative braking uses an electric vehicle's motor as a generator to convert much of the kinetic energy lost when decelerating back into stored energy in the vehicle's battery.
When the brake pedal is pressed, the power supply cuts off from the motor and now the motor runs due to its inertia in the magnetic field. So, back emf is produced which is responsible for generating the negative torque. Also, the current flow in the reverse direction by the bidirectional inverter which store in the battery. The operation happens in the presence of a negative slip which means rotor speed is maximum than the stator.
Hence, due to the effect of negative torque, the motor acts like a generator that helps to store the electrical energy in the battery and can be used for the next acceleration.
Combination of brakes
The below image shows the typical application system of brake in EV and HEV.
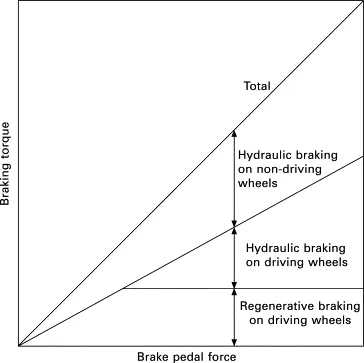
In general, EVs are equipped with the regenerative-hydraulic hybrid braking system. Whenever the regenerative braking torque is insufficient to offer the same deceleration rate as available in conventional vehicles, the hydraulic braking torque is applied. The control of their distribution is depicted in figure which aims to provide the driver with the same braking feel as that experienced in conventional vehicles while maintaining maximum regenerative braking.
During low brake pedal force, only the regenerative braking torque is applied on the driving wheels and is proportional to the pedal pressing force. The braking torque on the non-driving wheels is always due to the hydraulic braking which is also proportional to the pedal pressing force. When the pedal force is beyond a certain limit, the maximum regenerative braking torque is applied on the driving wheels, and the hydraulic braking torque is simultaneously applied on the driving wheels to top up the desired braking torque. Meanwhile, the maximum regenerative braking torque is kept constant to fully recover the kinetic energy.
Below is the practical case of electrical - Mechanical combination brakes.
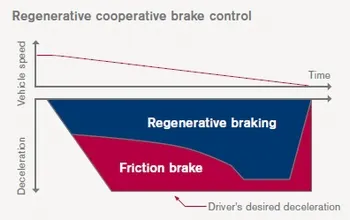
The distribution of Regenerative and Frictional braking is shown in the figure. It is the new technology of braking which is develop by 'Nissan Motor' called ' Electric Driven Intelligent Brake (EDIB)'.
Q.3) Make a MATLAB program which plots the contour of given motor speed, torque, and efficiency values. Attach the code as a .m file attach a screenshot of all the plots.
Below is the Matlab code for the contour plot.
MATLAB Code:-
clear all
close all
clc

% Motor Speed
w = linspace(0,1200);

% Torque
T = linspace(0,350);

% Coefficients of losses
kc = 0.1;     %For copper
ki = 0.05;       %For iron
kw = 0.00001;      %For windage
C = 30;     %Motor Constant loss

% Meshgrid
[X,Y] = meshgrid(w,T);

% Losses Formulation
copper_loss = kc*(Y.^2);
iron_loss = ki*X ;
windage_loss = kw*(X.^3);

Power_Output = X.*Y;   % Output Power

Power_Losses =(copper_loss)+(iron_loss)+(windage_loss)+ C ;   % Losses Power

Power_Input = Power_Output + Power_Losses ;   % Input Power


% Efficiency
Efficiency = Power_Output./Power_Input;

B = linspace(0.8,0.95,10); % Color Bar Range

% Plotting contour plot
contourf(X,Y,Efficiency,B,'ShowText','on')
colorbar
xlabel ('Speed (rad/s)')
ylabel ('Torque (Nm)')
EXPLANATION:
In the above program, the speed and torque values are defines. As efficiency is the ratio of output power and input power, both are calculated taking into account all losses in the motor. Then contour is plotted which contains speed, torque, and efficiencies. The extra color bar is also added.
Output:-
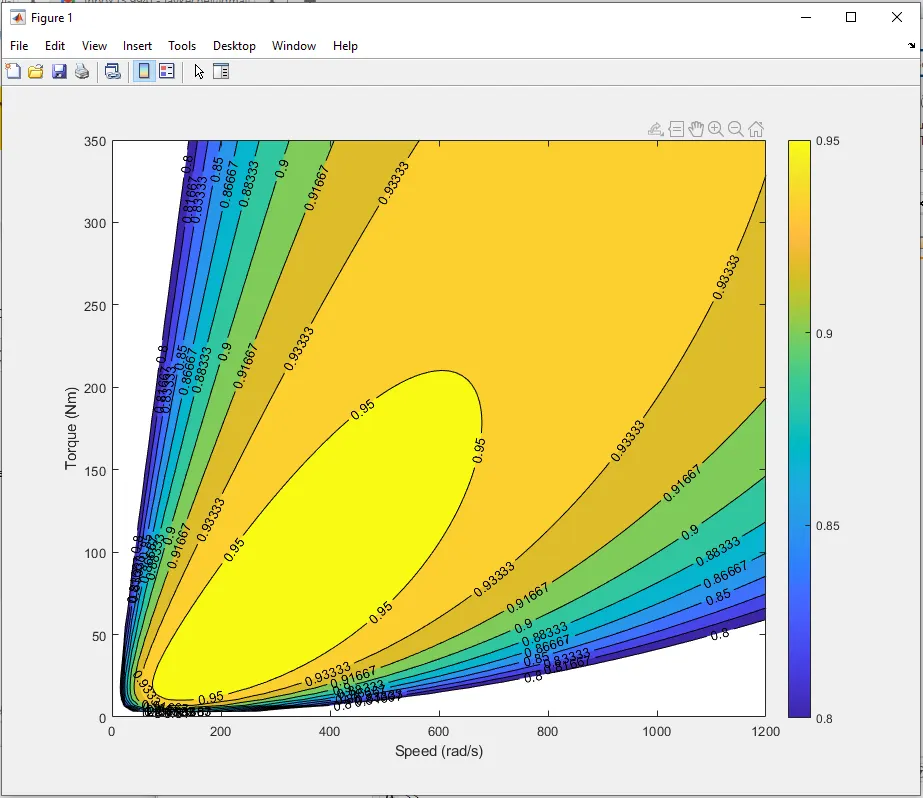
The contour plot shows the efficiency at a particular speed and torque. The maximum efficiency is about 95%.
LINK:- Below is the Google Drive link for the Drive cycle.
https://drive.google.com/file/d/1V-qT7Ak2SmYQGOasjy_Lp1yFlh2FNyur/view?usp=sharing
CONCLUSION:-
The energy required for braking is calculated. The coordination of electrical and mechanical brakes is described. Also, the contour is plotted for speed, torque, and efficiency successfully.
REFERENCE:-
https://x-engineer.org/automotive-engineering/vehicle/electric-vehicles/ev-design-electric-motors/