Steady Vs Unsteady flow over a cylinder
Simulation of flow over a cylinder and visualizing the Karman vortex street
Aim: To Simulate the 2D laminar flow over a cylinder and explain the phenomenon of Karman vortex street.
Governing equations :
- Continuity equation : x +y =0
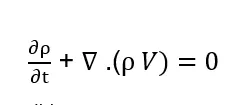
If the fluid is incompressible, ρ = constant, independent of the space and time so that x=0. The continuity equation reduces to
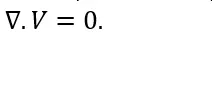
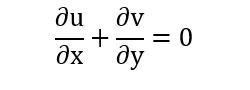
Which in Cartesian coordinate is
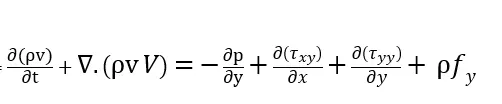
Momentum equation :
- X component

- Y component
Introduction :
For flow past a circular cylinder, usually experiences boundary layer separation and very strong flow oscillations in the wake region behind the body. In certain Reynolds number range, a periodic flow motion will develop in the wake as a result of boundary layer vortices being shed alternatively from either side of the cylinder. This regular pattern of vortices in the wake is called a Karman vortex street. It creates an oscillating flow at a discrete frequency that is correlated to the Reynolds number of the flow. The periodic nature of the vortex shedding phenomenon can sometimes lead to unwanted structural vibrations, especially when the shedding frequency matches one of the resonant frequencies of the structure.
vortex shedding :
vortex shedding is an oscillating flow that takes place when a fluid such as air or water flows past a bluff body at certain velocities, depending on the size and shape of the body.
In this flow, vortices are created at the back of the body and detach periodically from either side of the body forming a Von Karman Vortex Street. The fluid flow past the object creates alternating low-pressure vortices on the downstream side of the object. The object will tend to move toward the low-pressure zone. To analyse the vortex shedding phenomenon, a dimensionless parameter called as Strouhal number is used.
Strouhal number:
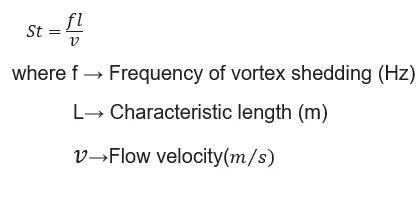
Strouhal number is a dimensionless number describing oscillating flow mechanisms.
Methodology :
- Modelling :
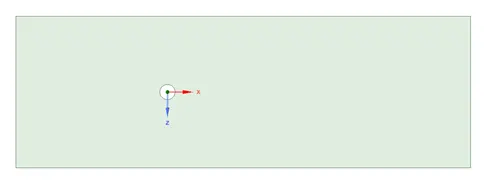
The Geometry is created using Ansys Space Claim. A circle of diameter, D= 2m is created and computational fluid domain with inlet boundary located at a distance of 10D from the centre of the circle towards the front and outlet boundary is located at a distance of 20D from the centre of the circle towards the rea. The size of the inlet is 10D and the total length of the domain is 30D.
Once the geometry is created it is then converted into the surface and the circle inside is deleted.
2.Meshing :
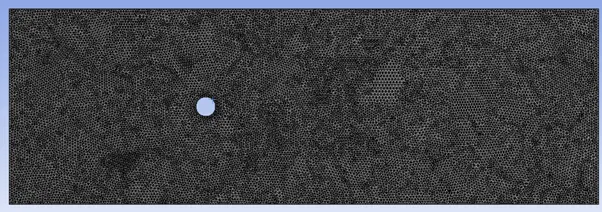
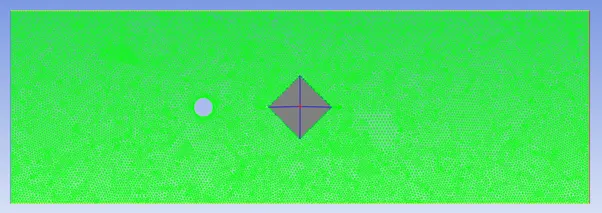
Meshing is the important part to get the accurate results of the experiment. Initially, a basic Quad dominant mesh gets created. The method is then changed to triangles with a mesh element size of 0.25m is chosen after mesh refinement.
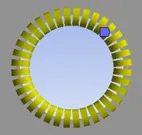
Further refinement is done by defining sizing along the edge of the circle with a number of division equals to 36 to ensure smooth development of flow separation in the simulation. An inflation layer of the first layer growth type with a growth rate of 1.2 and thickness of the first layer is 5mm is introduced In order to increase the accuracy of the force parameter along the wall of the circular body.
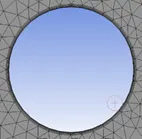
Nodes:20697
Elements:40502
Named Selections :
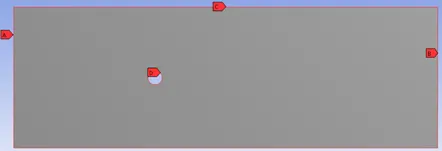

Mesh Metric: Element Quality
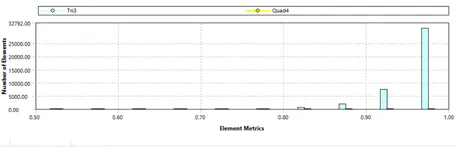
The mesh matric that identifies the elements according to their quality was employed and it can be seen that the element of lowest quality are minimal, most of the elements have very high quality in the range of 0.9-1.
3.Simulation and Results :
Part 1 :
- Steady-State Approach for Re=100:
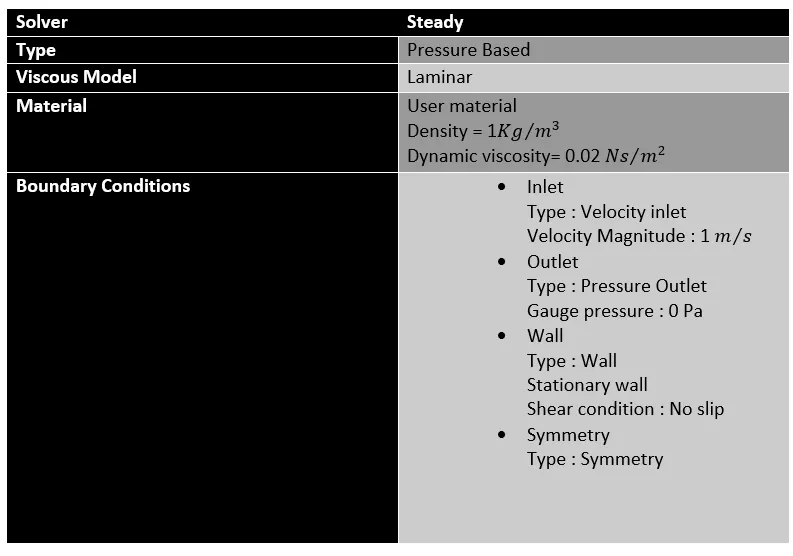
Monitor point is created at a distance of 10m from the centre of the circle, (10,0) is the coordinate of the monitor point.
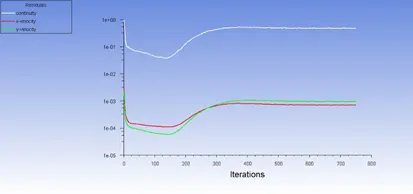
Residual plot :
Monitor point velocity :
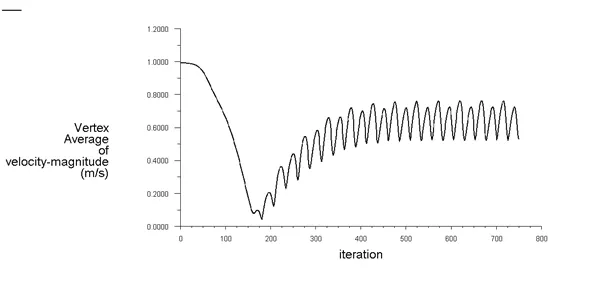
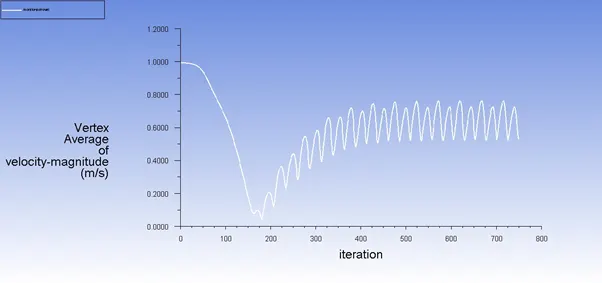
From the above plot, it is observed that the vortex shedding starts at around 150 iterations and this velocity fluctuation reaches a converged oscillatory state after 400 iterations.
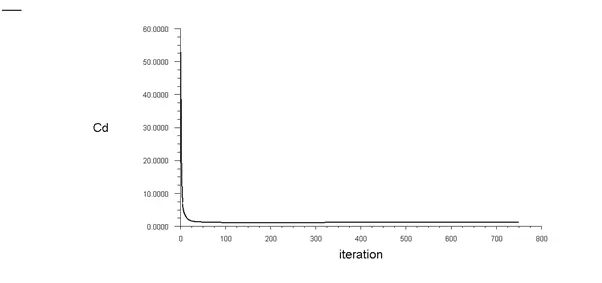
Drag Coefficient plot :
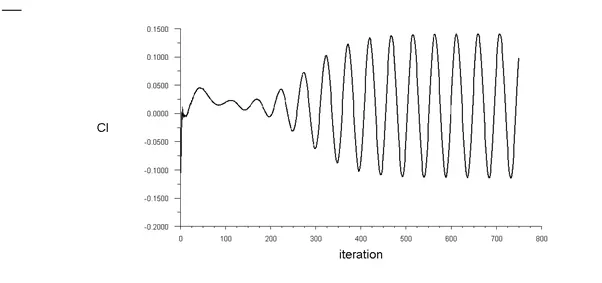
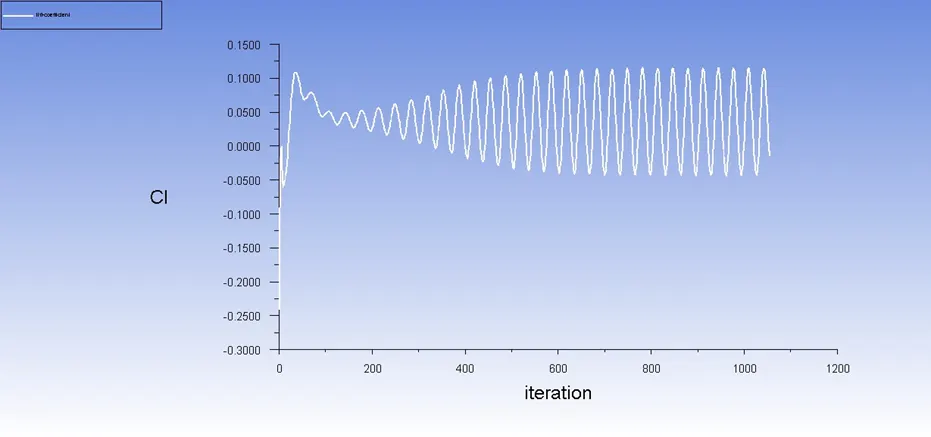
Lift Coefficient plot :
Velocity contour plot :
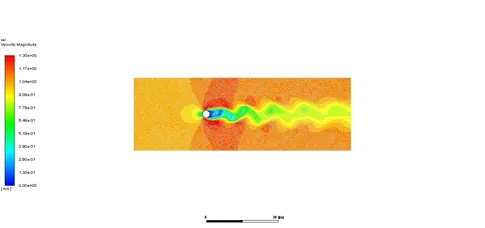
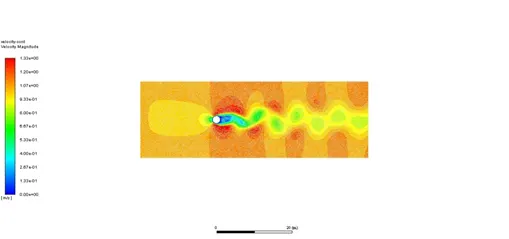
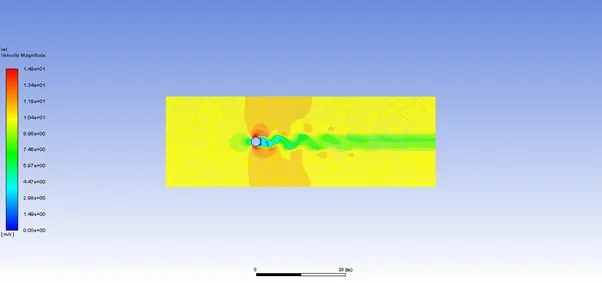
The velocity contour shows the Von Karman Vortex Street.
Pressure contour plot :
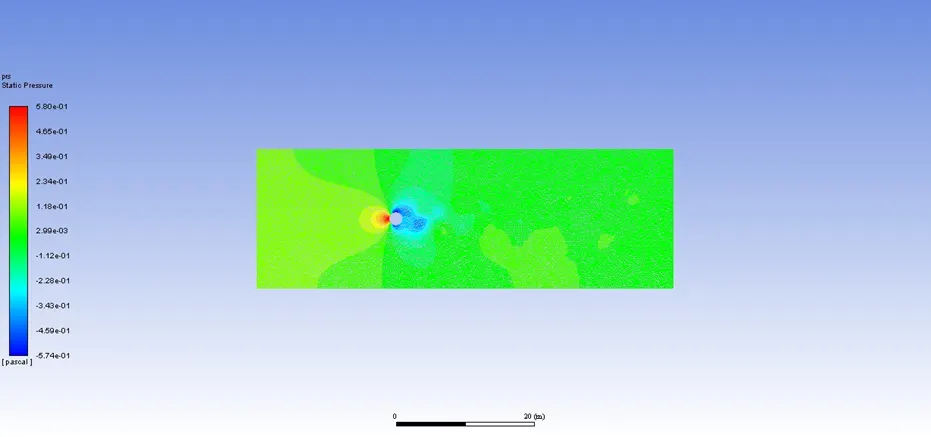
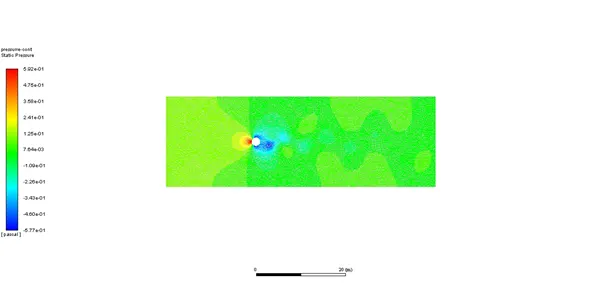
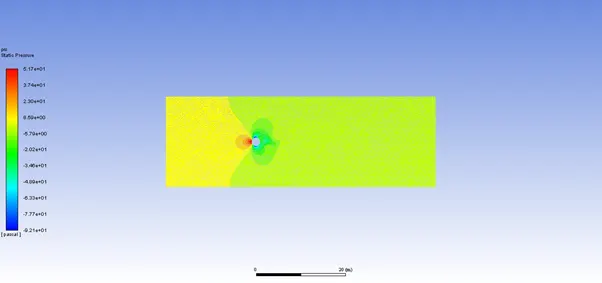
The huge stagnation pressure zone can be seen behind the cylinder which leads to flow separation and formation of the vortices which is the Von Karman Vortex Street phenomenon. However, to calculate the strouhal number, it is necessary to run a transient simulation since the frequency of the vortices is a time-dependent parameter.
Animation video Links :
- Transient Approach for Re= 100 :

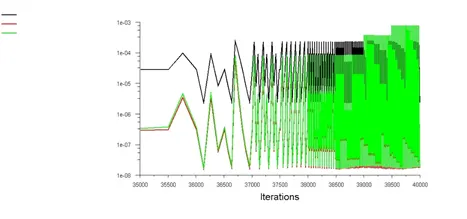
Residual plot :
Monitor point velocity :
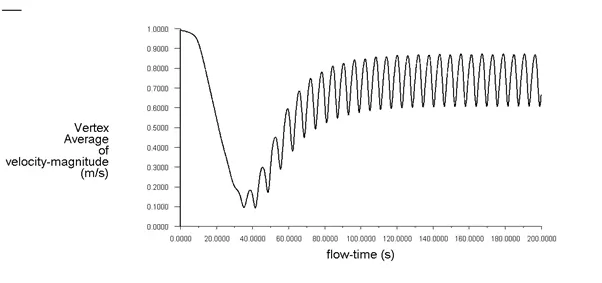
From the above plot, it is observed that the vortex shedding starts at around 35s and this velocity fluctuation reaches a converged oscillatory state after 100s.
Velocity Contour plot :
Pressure contour plot :
Drag Coefficient plot :
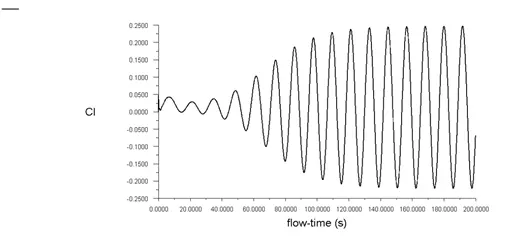
Lift Coefficient plot :
Animation video Links :
1)https://youtu.be/UVU9nVayFbM
2)https://youtu.be/ev3nhSA7iN0
Strouhal Number :
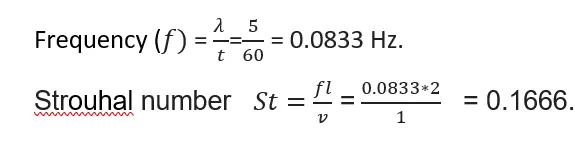
In order to calculate the Strouhal number, we need to calculate the frequency first. To calculate the frequency we choose a time period 60s between 140s and 200s of our flow time. The wavelength we obtain is 5.
Part 2 :
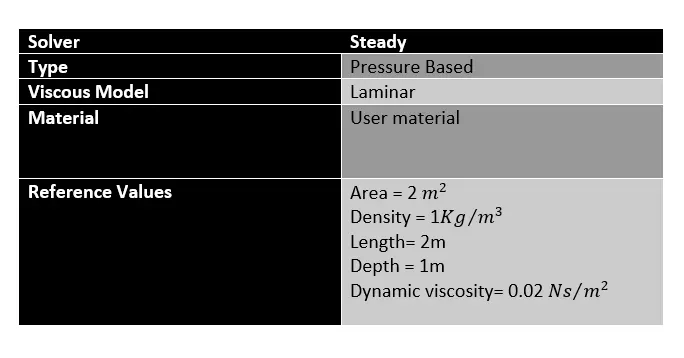
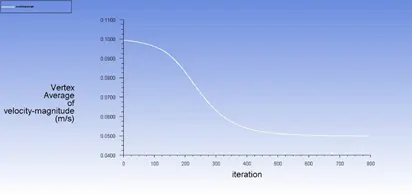
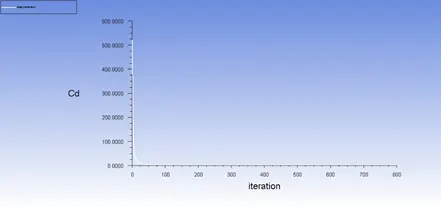
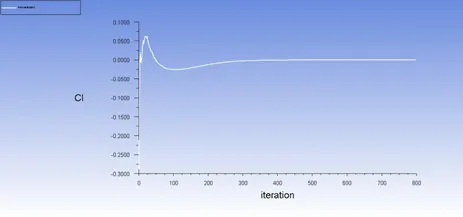
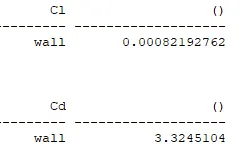
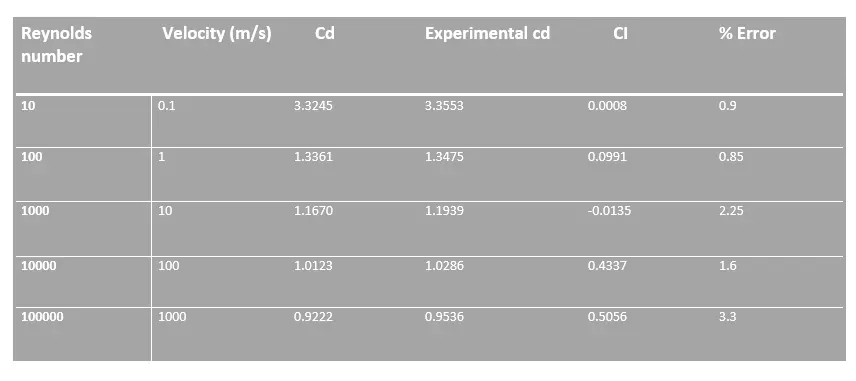
To calculate the coefficient of drag and lift by setting Reynolds number to 10,100,1000,10000 &100000, to change the Reynolds number velocity is varied.
For Re=10 :
Residual plot :
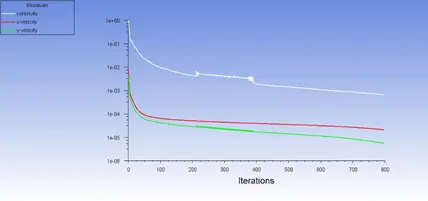
Convergence occurs at around 800 iterations.
Monitor point velocity :
Drag Coefficient plot :
Lift coefficient plot :
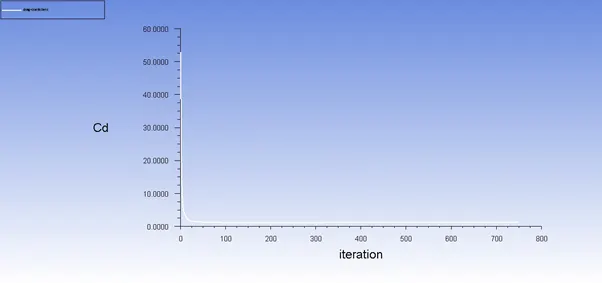
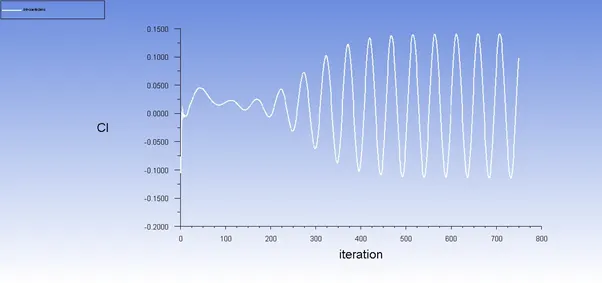
For Re=100
Residual plot :
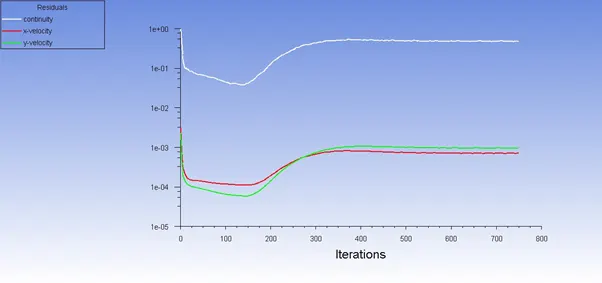
Convergence occurs at around 400 iterations.
Monitor point velocity :
Drag Coefficient plot :
Lift coefficient plot :
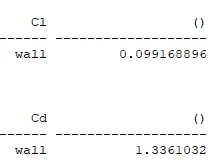
For Re=1000
Residual plot :
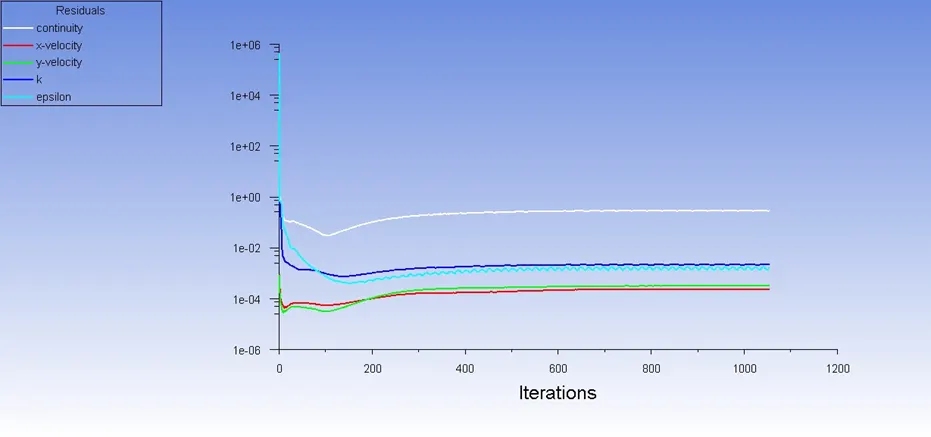
Convergence occurs at around 600 iterations.
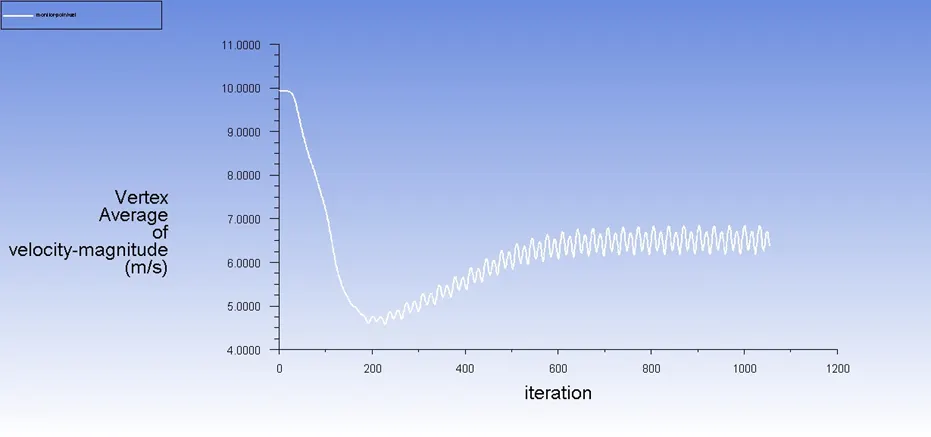
Monitor point velocity :
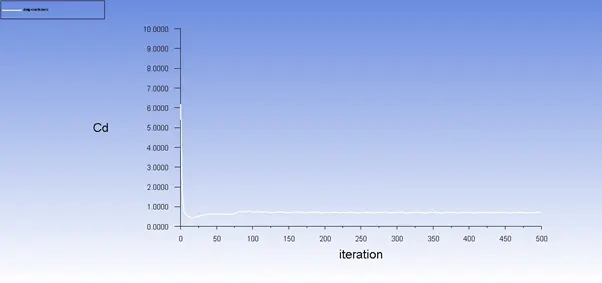
Drag Coefficient plot :
Lift coefficient plot :
Pressure contour plot:
Velocity contour plot:
For Re=10000
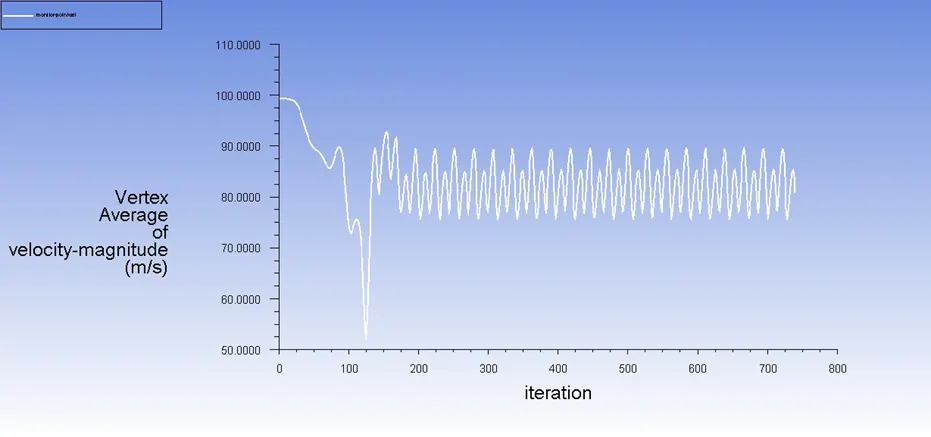
Monitor point velocity :
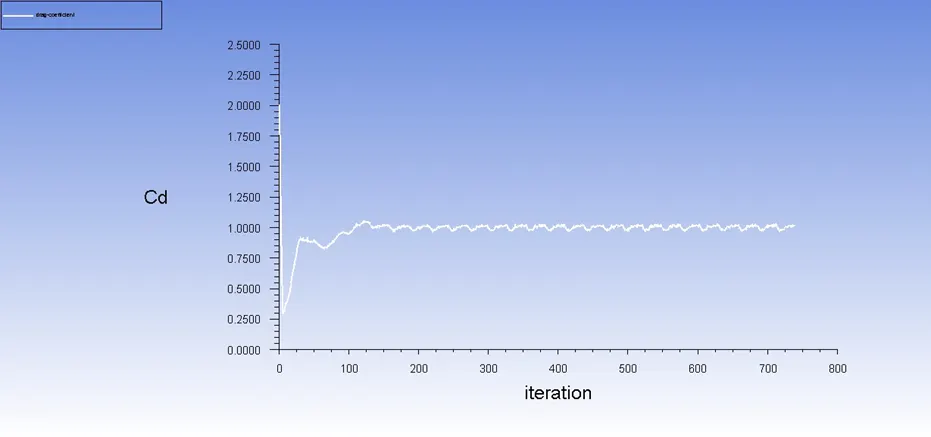
Drag Coefficient plot :
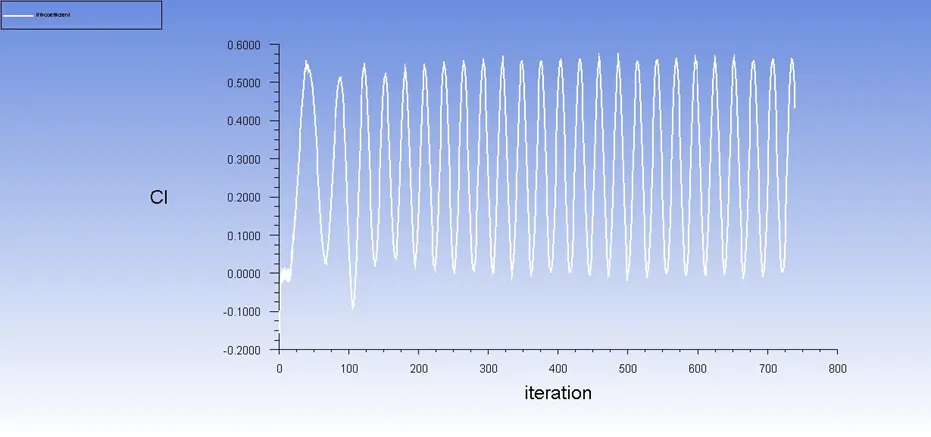
Lift coefficient plot:
For Re=100000
Residual plot:
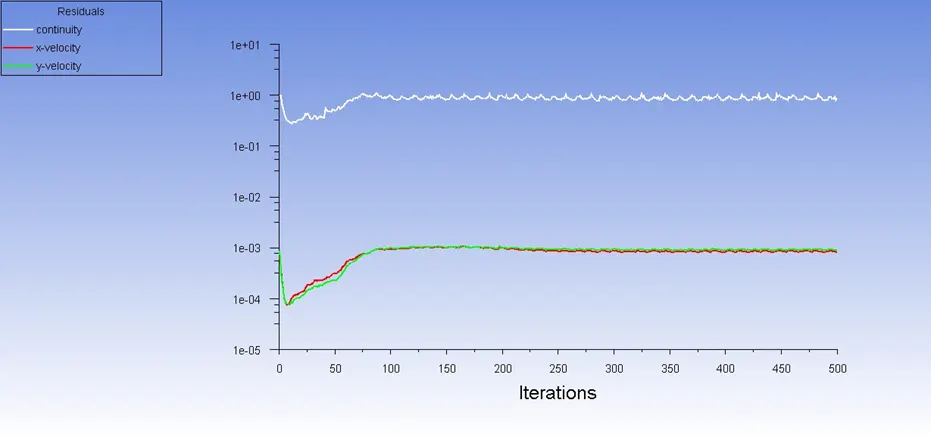
Convergence occurs at around 200 iterations.
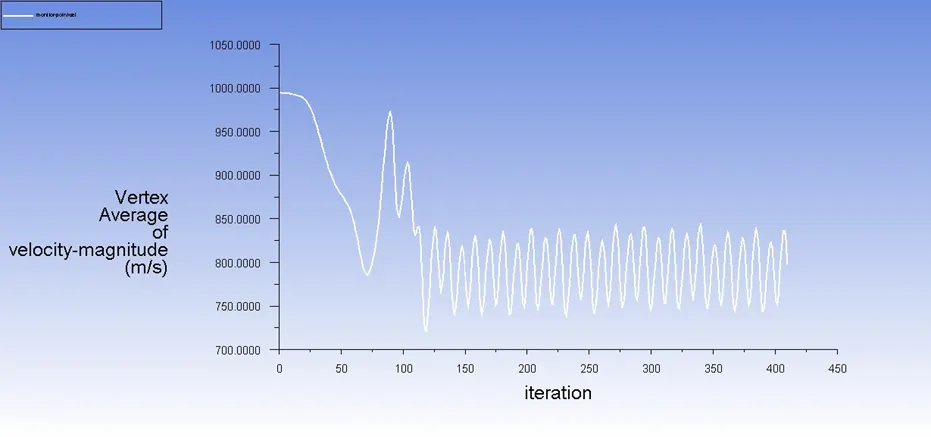
Monitor point velocity :
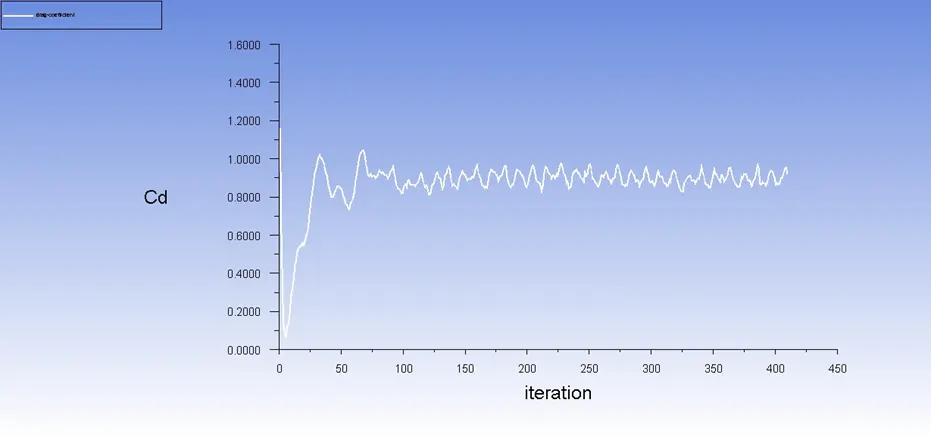
Drag Coefficient plot :
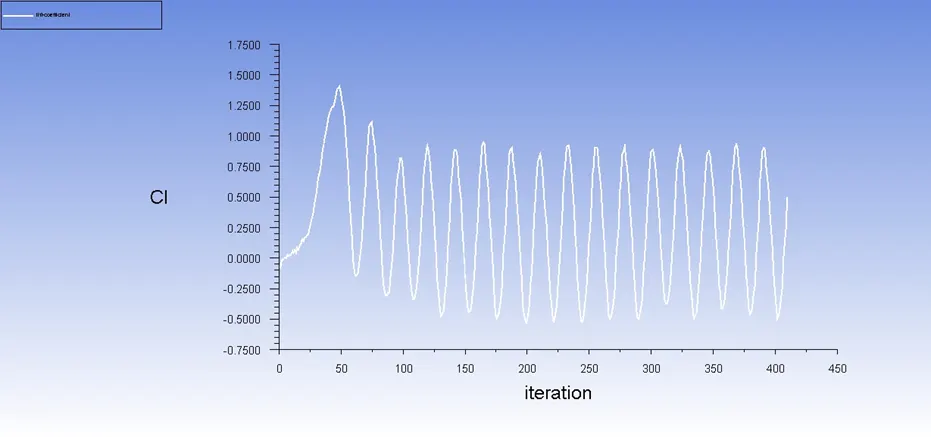
Lift coefficient plot:
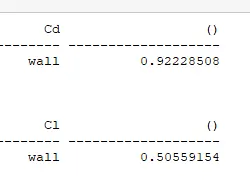
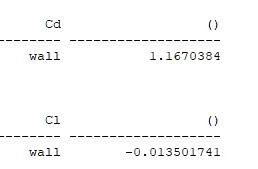
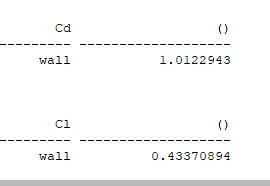
Lift and Drag coefficient value for different Re number :
Conclusion :
For Reynolds number 100, The vortex shedding phenomenon was visualized in the laminar flow over a cylinder and through transient approach, the Strouhal number of vortex shedding was calculated. Since the phenomenon of vortex shedding is a time-dependent phenomenon, simulating the flow through a transient approach is more preferable than the steady-state approach.
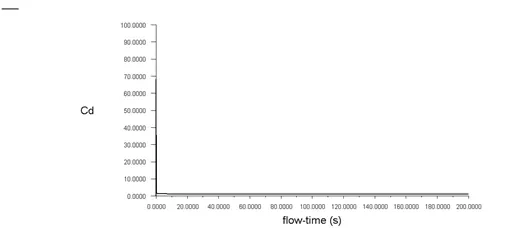
Coefficient of drag and lift were calculated for different Reynolds number by varying the velocity of the fluid. It is observed that with the increase in Reynolds number Drag coefficient decreases means that the resistance offered by the body is decreasing.
Thus, we have understood the effect of the Reynolds number in the flow around the cylinder by steady and unsteady simulation. We can employ a similar procedure to study vortex shedding due to changes in Reynolds number around various geometry.
Prefered material :
https://www.sciencedirect.com/science/article/pii/S0307904X08000243