Conjugate Heat Transfer Analysis on a graphics card.
Aim: To Perform a steady-state conjugate heat transfer analysis on a graphics card model.
Introduction :
The graphics processing unit, or GPU, has become one of the most important types of computing technology, both for personal and business computing. Designed for parallel processing, the GPU is used in a wide range of applications, including graphics and video rendering. Although they’re best known for their capabilities in gaming, GPUs are becoming more popular for use in creative production and artificial intelligence (AI).
Graphics card temperatures typically range from 40°C to 90°C. Performance class graphics cards can reach high temperatures under heavy load. The heatsink and fan assemblies on the graphics cards are designed to pull the heat away from the graphics card. A case which does not have proper airflow can prevent the heat from escaping the graphics card. Adding fans to the case which pulls cool air from the front of the case and drags hot air from the back of the case can help reduce the temperatures of the components inside PC.
In high-performing graphic computing become heat source. As temperature increases, the performance of the graphics card drops causing the same to graphic performance and in an extreme case, causing computer operations to stop. A heat sink is used to overcome the overheating issue of the graphics card. However, the transfer and flow of heat inside a computer case and distribution of temperature at the heat sink are unknown. Hence, computational fluid dynamics(CFD) simulation is carried out to investigate and observe the transfer of heat flow to solve the graphics card overheating issue.
Conduction occurs when a Processor transfers heat generated to the heat sink/Fins by surface to surface contact whereas convection occurs when a forced flow coolant into and out of the heat sink which comprises of inlet and outlet.
For heat exchange between a solid surface with heat conduction( i.e heat conduction between processor and fins) and an external fluid flow passing over it. In such case CHT analysis is essential. CHT allows the simulation of the heat transfer between solid and fluid domains by exchanging thermal energy at the interfaces between them.
The heat sink is designed to pull the heat away from the graphics card. A case that doesn’t have proper airflow can prevent the heat from escaping the graphics card. So by adding fans which pulls cool air from the front and drags the hot air from the back of the case will help reduce overheating of components.
With the fins provided, it will increase the available surface area which will be in contact with the air and thereby increasing the heat transfer rate.
Various types of Graphics card cooling solutions are
Passive cooling :
In this cooling, only the heatsink is used to cool the GPU and other components, including Video Memory and VRM. It is also called fanless cooling and is completely silent in operation.
Active Cooling :
A fan is used with a heatsink to cool down the graphics card and this combo is known as HSF or Heatsink Fan.
Water Cooling/ Liquid Cooling :
This is the best cooling method to cool down the GPU of the graphics card. In water cooling GPU of the graphics card is cooled down by a water cooling unit that consists of a radiator and a fan. In this type of cooling, water or liquid is circulated through the GPU surface using pipes and radiator, and the hot liquid running through the pipes is cooled down by the radiator fan. This process goes on repeating and it keeps the GPU temperature much lower as compared to active cooling and passive cooling solutions.
Hybrid Cooling :
Hybrid Cooling is a form of water cooling where the GPU is cooled by water/liquid cooler and other components like Video Memory and VRM are cooled actively using heatsink and fan assembly.
Hybrid Cooling = Water Cooling (GPU) + HSF (for VRAM & VRM)
Water Block Cooling :
This is a variation of water cooling where the graphics card comes with a custom water block unit having a copper base plate that is spread all over the graphics card PCB. It is a pure water cooling solution for all major components of a graphics card.
Water Block Cooling = Water Cooling (GPU+VRAM+VRM)
Here in our project, we go with Passive Cooling.
In our Graphics card, the processor is under the fine. This Processor heats up a lot and hence we need a large fin to cool the processor down. A CHT simulation is one where multiple modes of heat transfer are involved in this particular project case there is solid convection and conduction which removes heat from fin to external air.
Methodology :
Geometry :
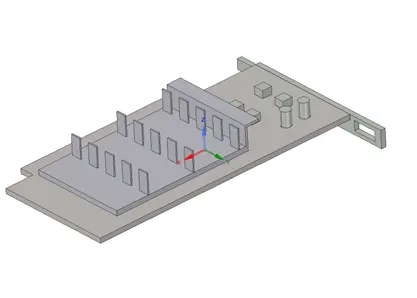
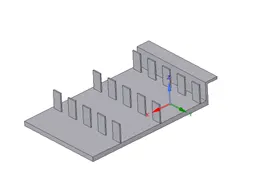
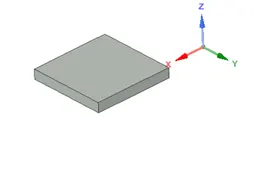
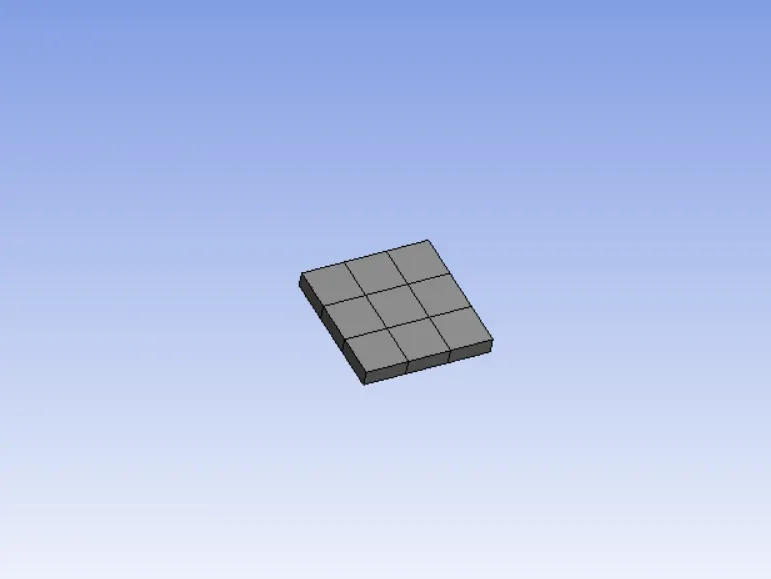
Fins Processor
L=8mm
B=8mm
H= 1 mm
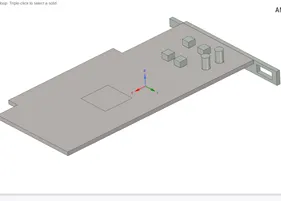
Base Circuit Board
Share Topology is set to share to have a conformal mesh.
Meshing :
|
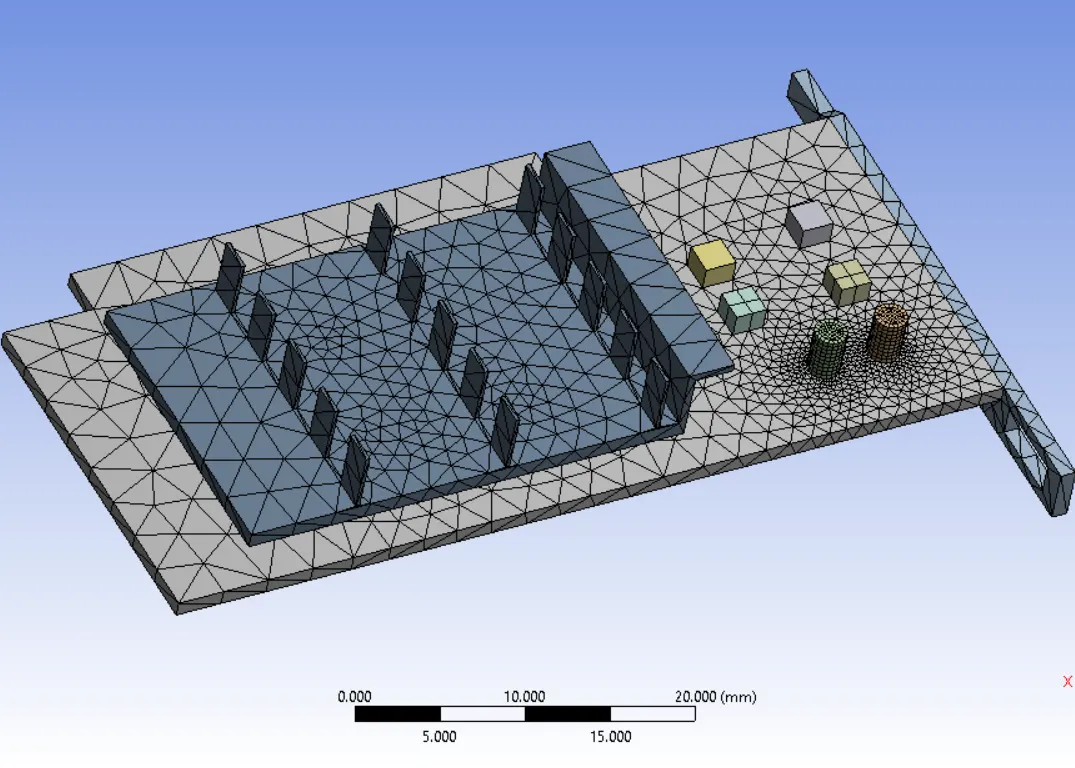
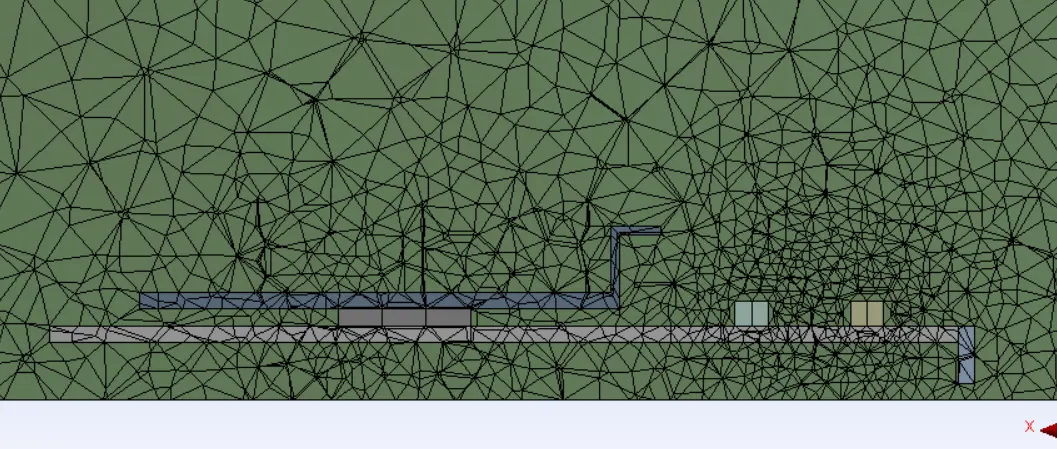
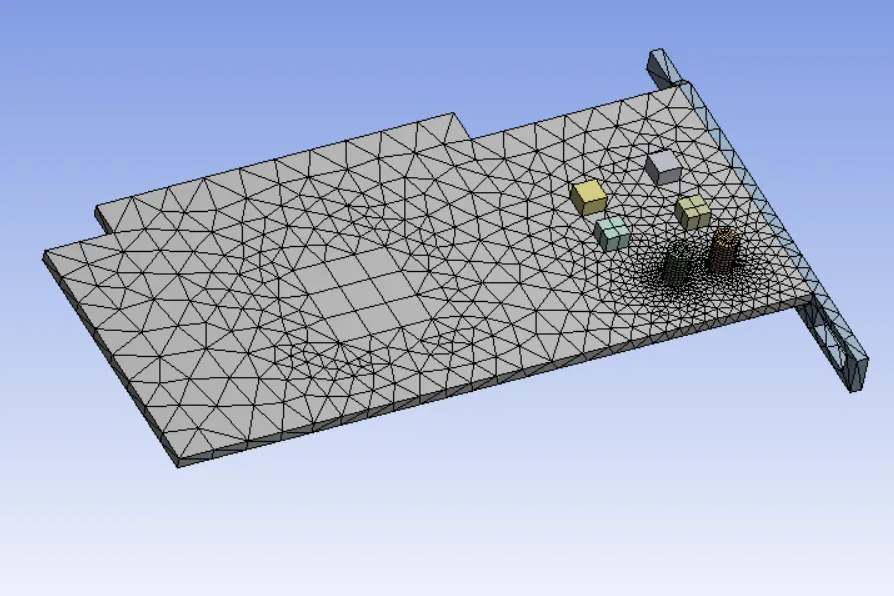
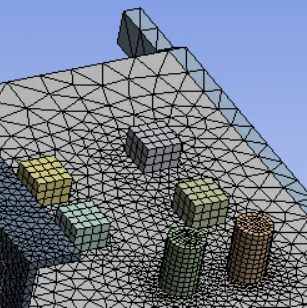
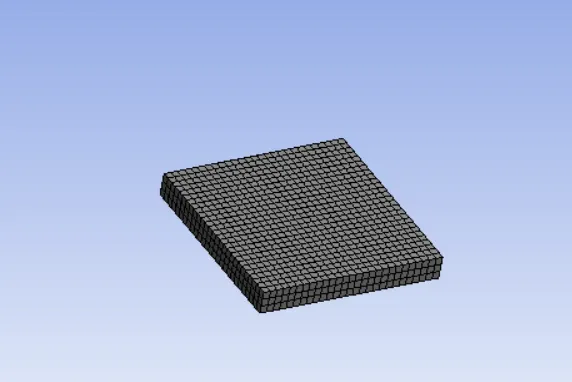
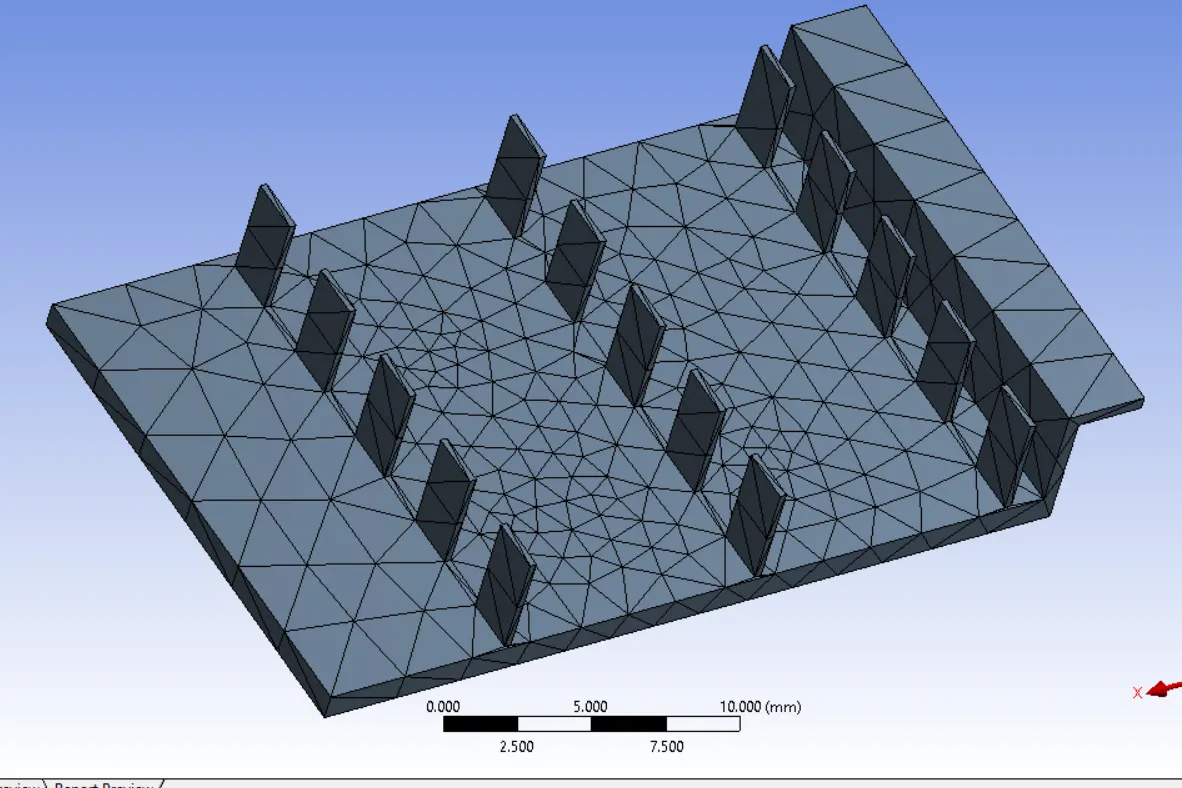
Case 1: BaseLine Mesh Element size : 3mm Processor = hexahedral mesh Tetrahedral Mesh |
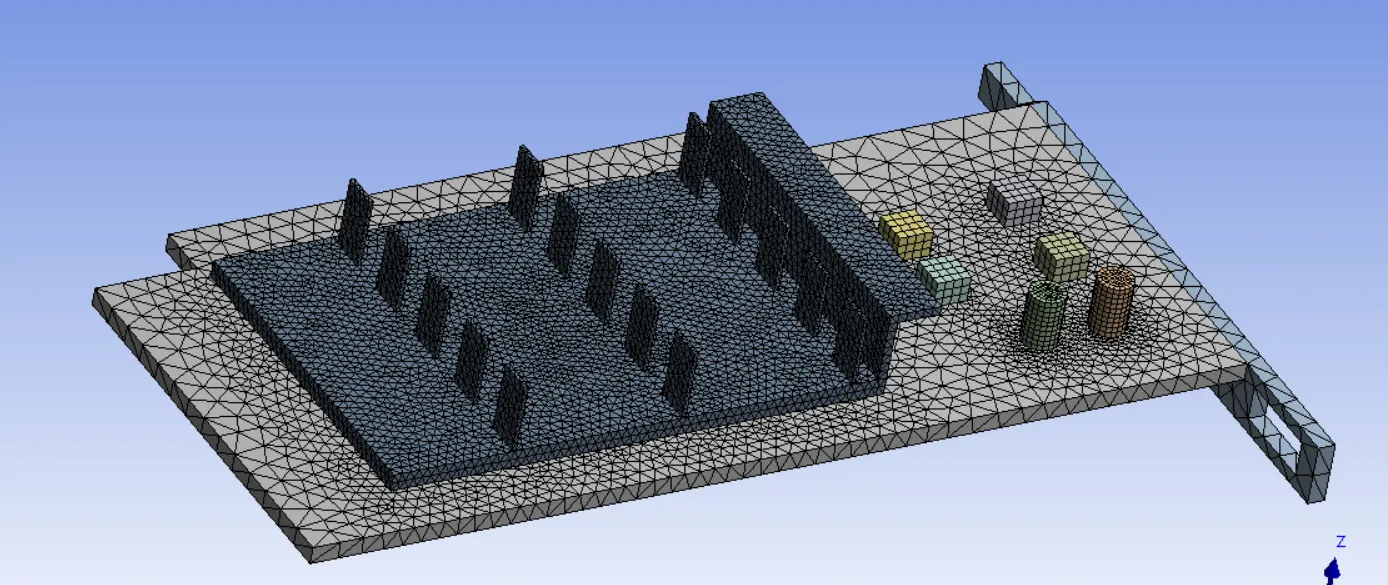
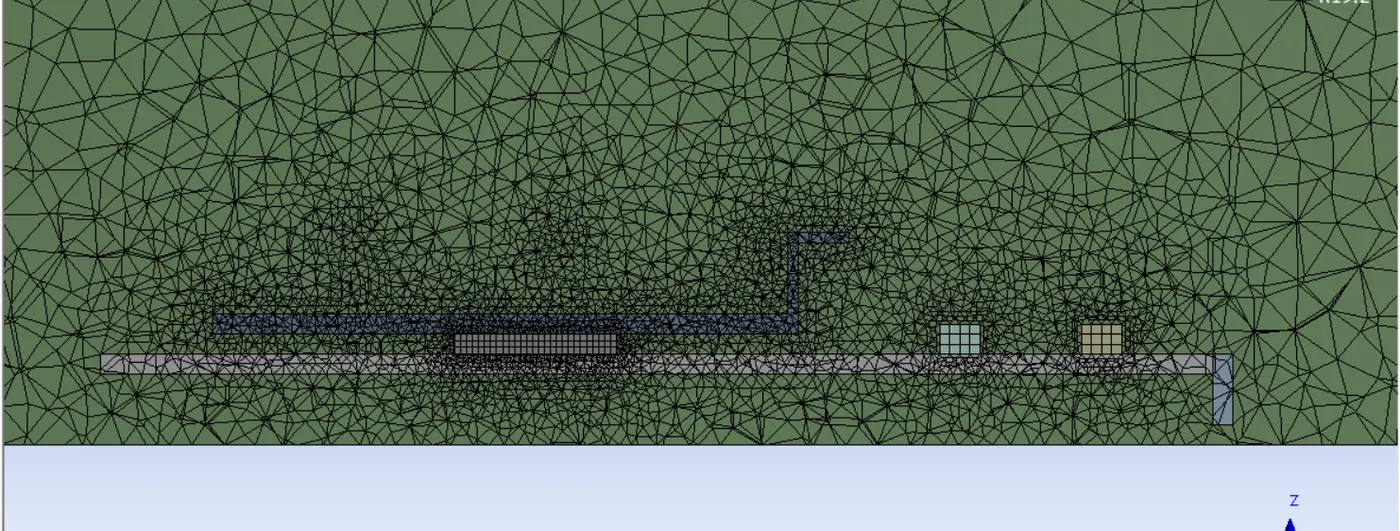
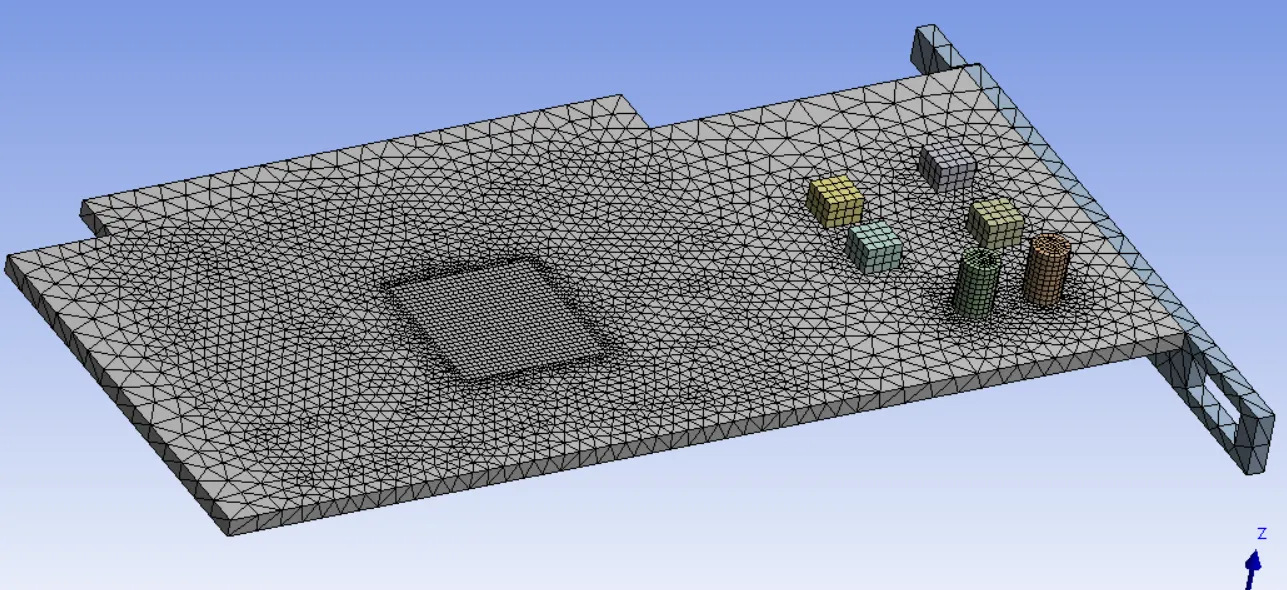
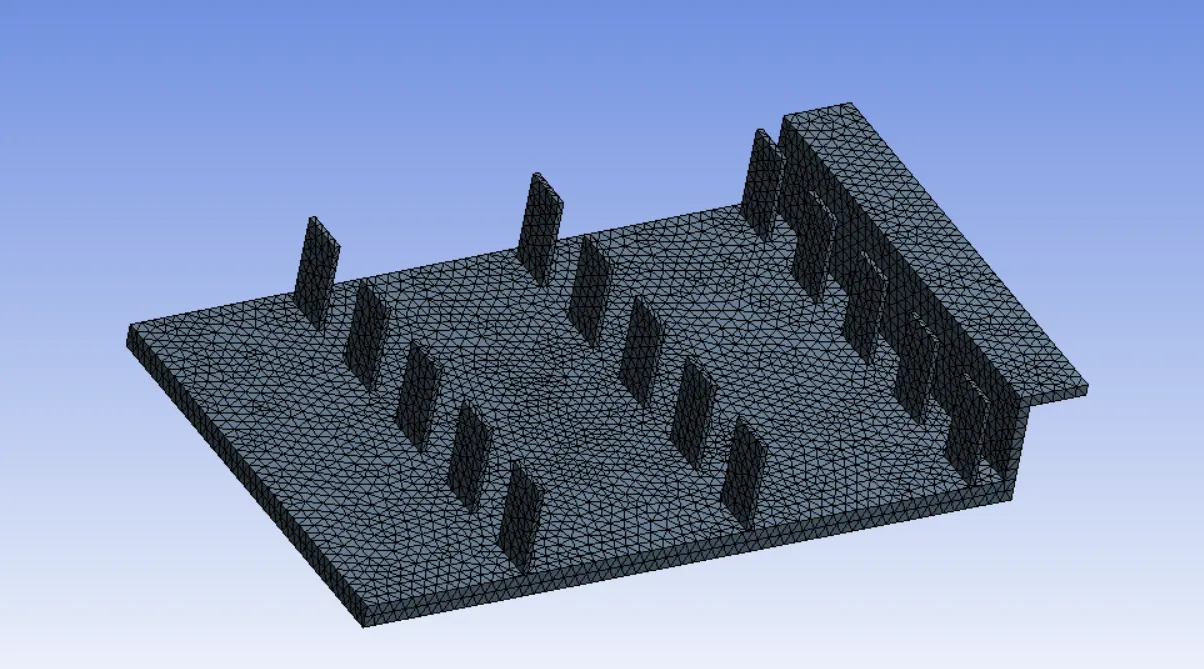
Case 2: Refined Mesh Element size : 3mm Body Sizing : Fin : 0.5 mm Base : 2mm Tetrahedral Mesh |
 |
 |
 |
 |
|
Base circuit board |
Base |
|
Processor Memories and other components |
Mesh size=1mm Processor |
|
Fins(Heat Sink) |
Fins ( Heat Sink) |
|
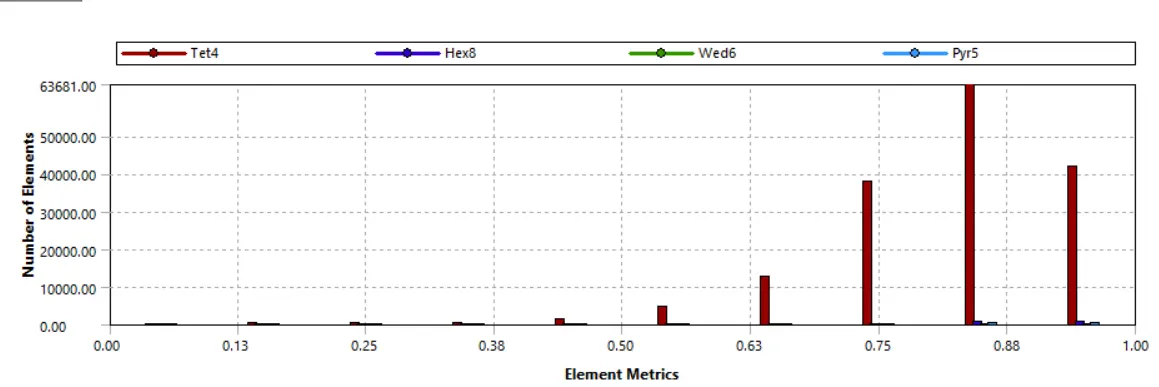
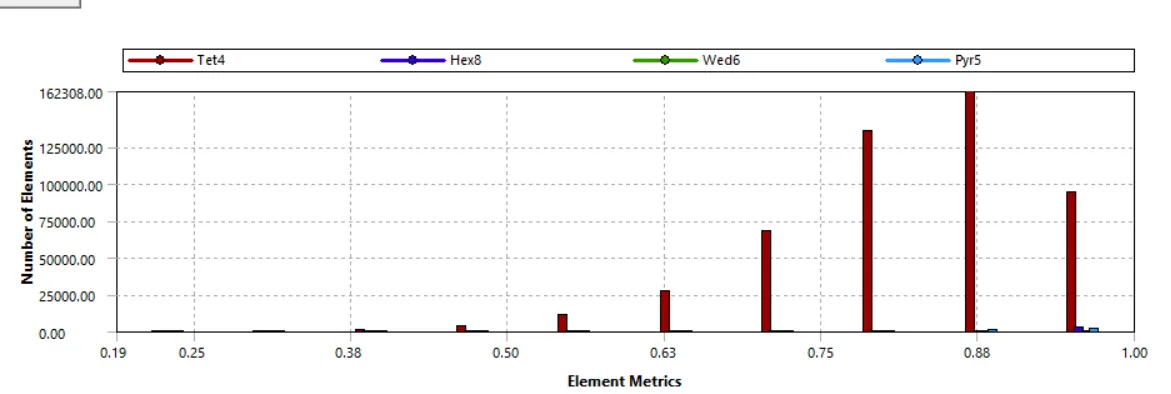
Mesh metrics: Element Quality The mesh matric that identifies the elements according to their quality was employed, it can be seen that the mesh with low quality is minimal. |
Mesh metrics: Element Quality The mesh matric that identifies the elements according to their quality was employed, it can be seen that the mesh with low quality is minimal. |
|
Nodes: 31610 Elements: 165132 |
Nodes: 91343 Elements: 506965 |
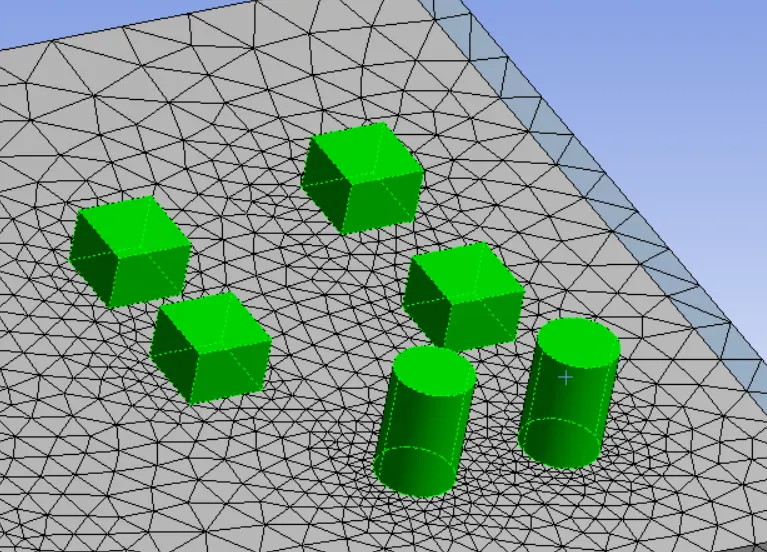
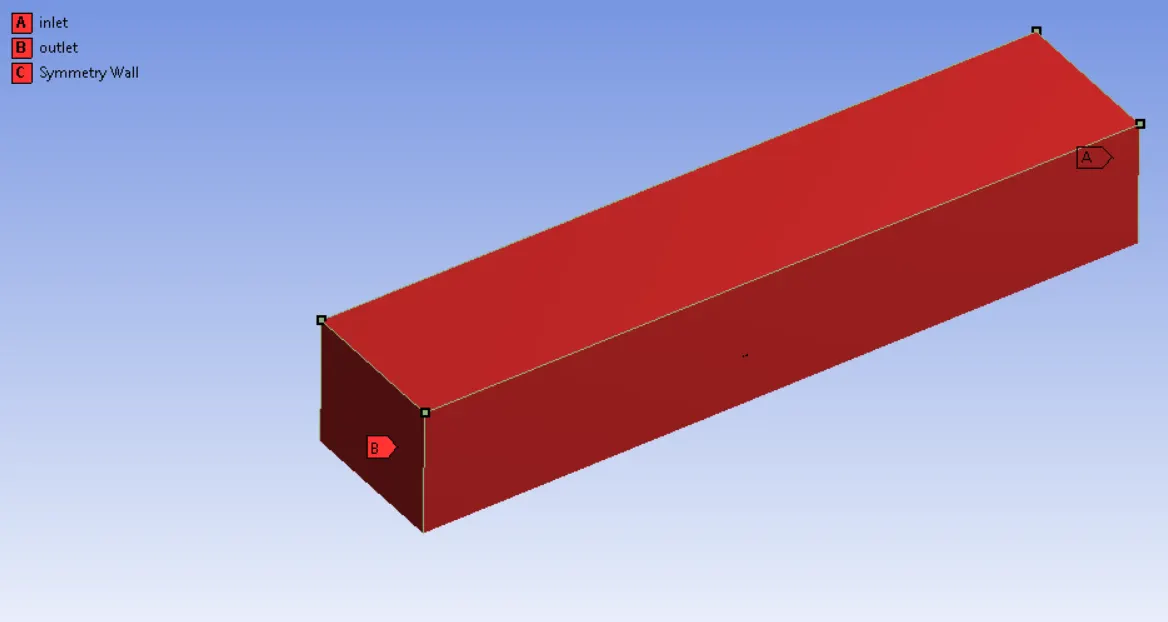
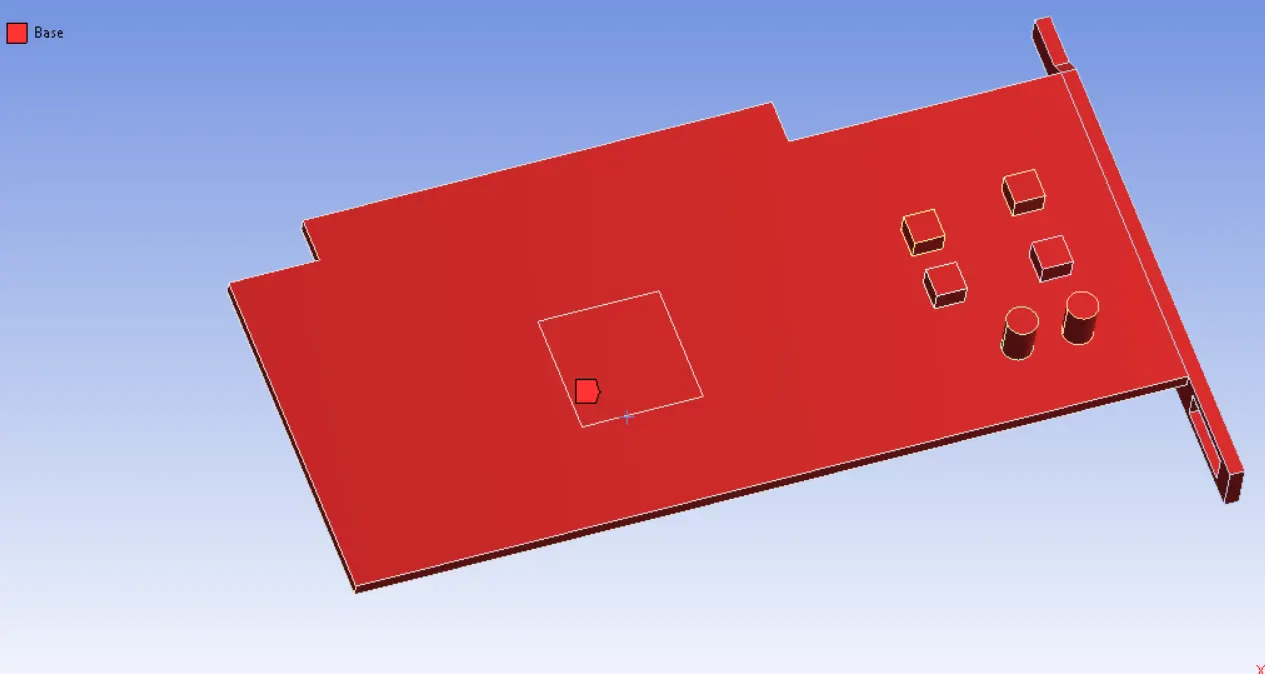
Named Selection:
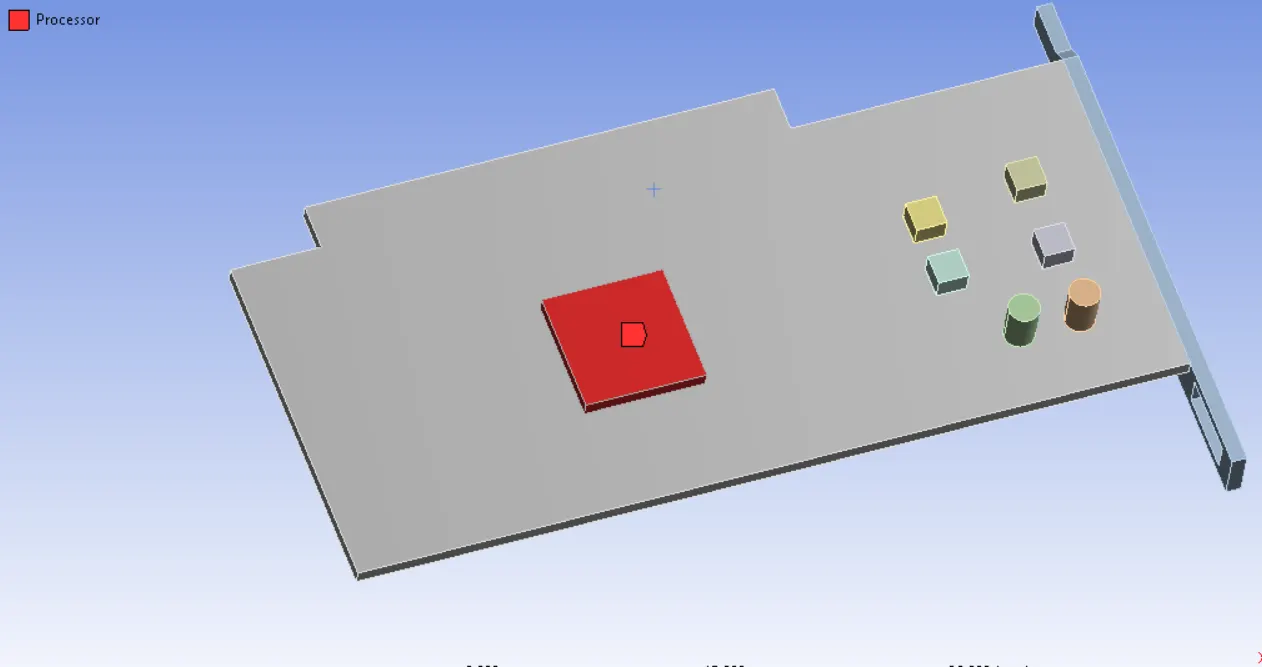
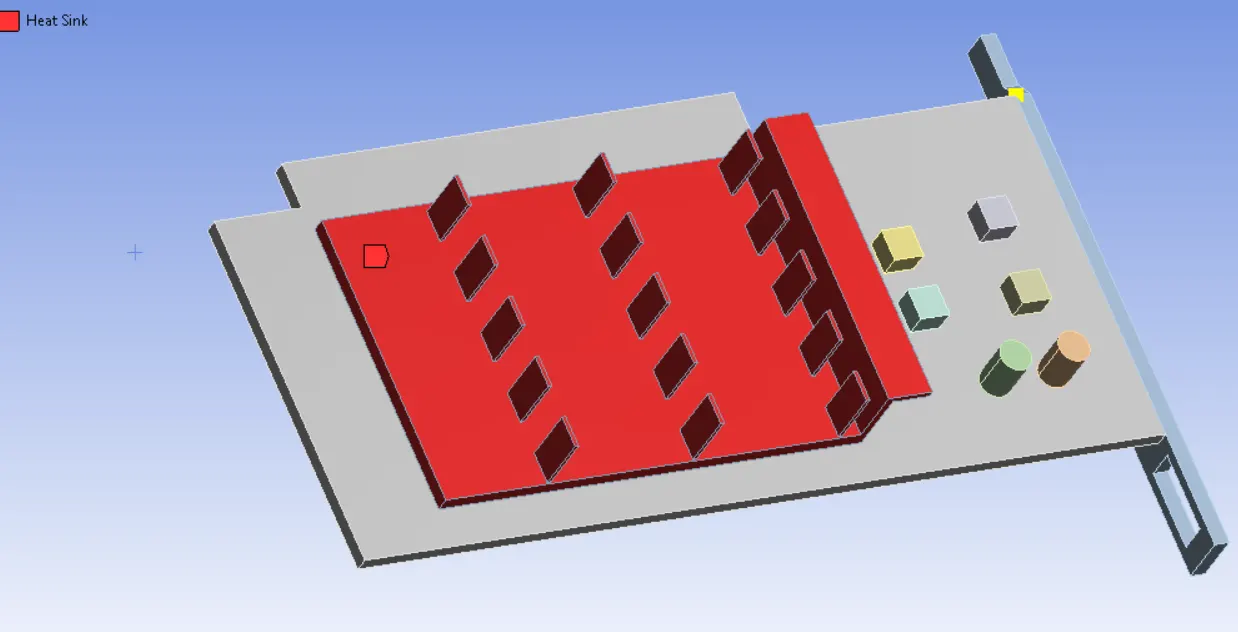
Simulation :
The simulations were performed using the ANSYS Fluent; the solver tries to solve the Navier Stokes Equation.
Setup:
Processor: Source
Power Consumed= 6W
Volume of Processor: 8mm*8mm*1mm = 64mm^3
Heat generated= Power Consumed/ Volume = 9.375e09 W/mm^3
The Power Consumption of Todays GPU has increased a lot. The Top modules demand between 110watts to 270watts from the power supply. In fact, a powerful Graphics Card under full load requires as much as the rest of the components of the PC system combined.
But here in our case, After running a simple analysis it was observed that the GPU cannot withstand high power. This might be because the GPU model is smaller. So 6watts was chosen for further analysis.
Fin, Processor, Base is attached with appropriate materials and their properties are shown below.
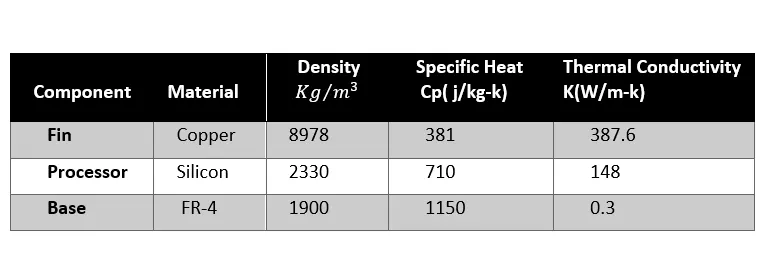
Setup:
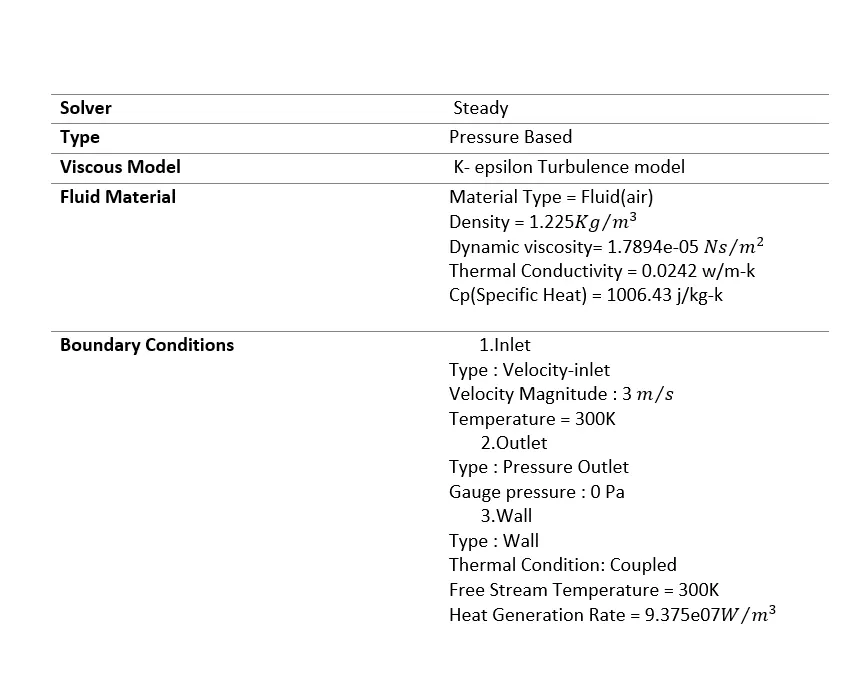
Initialize Solution: Solution is initialized (Standard Initialization).
Run calculation: Number of iterations is set to 1000 with a reporting interval of 1 (each iteration).
Result Plots :
Baseline Refined Mesh
|
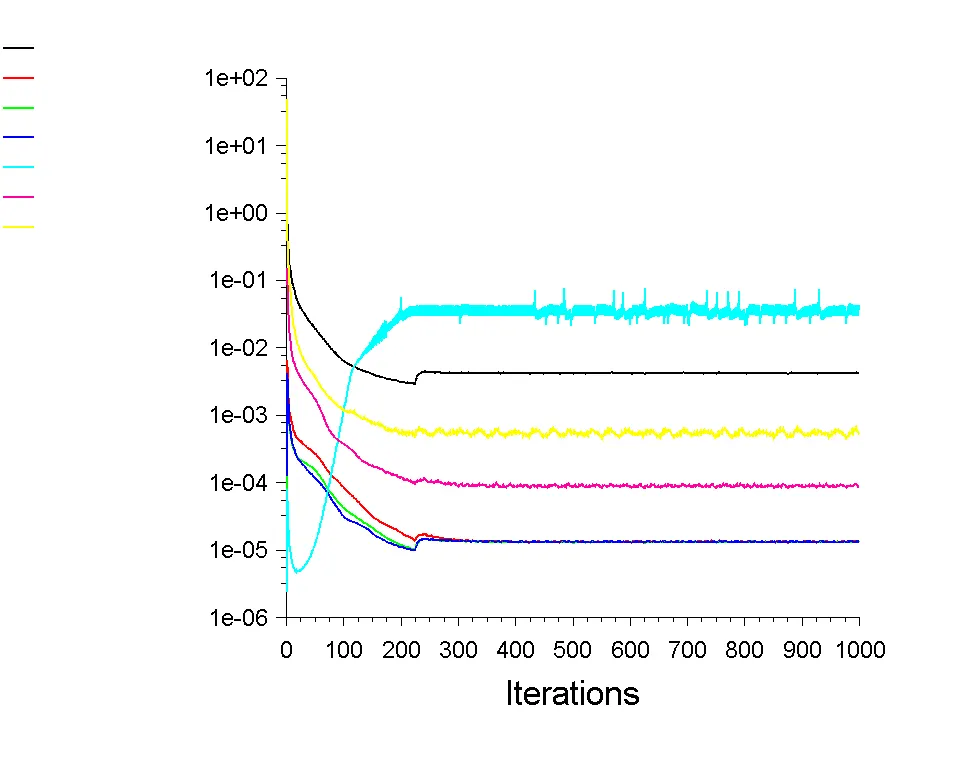
Solution is converged at around 250 iterations |
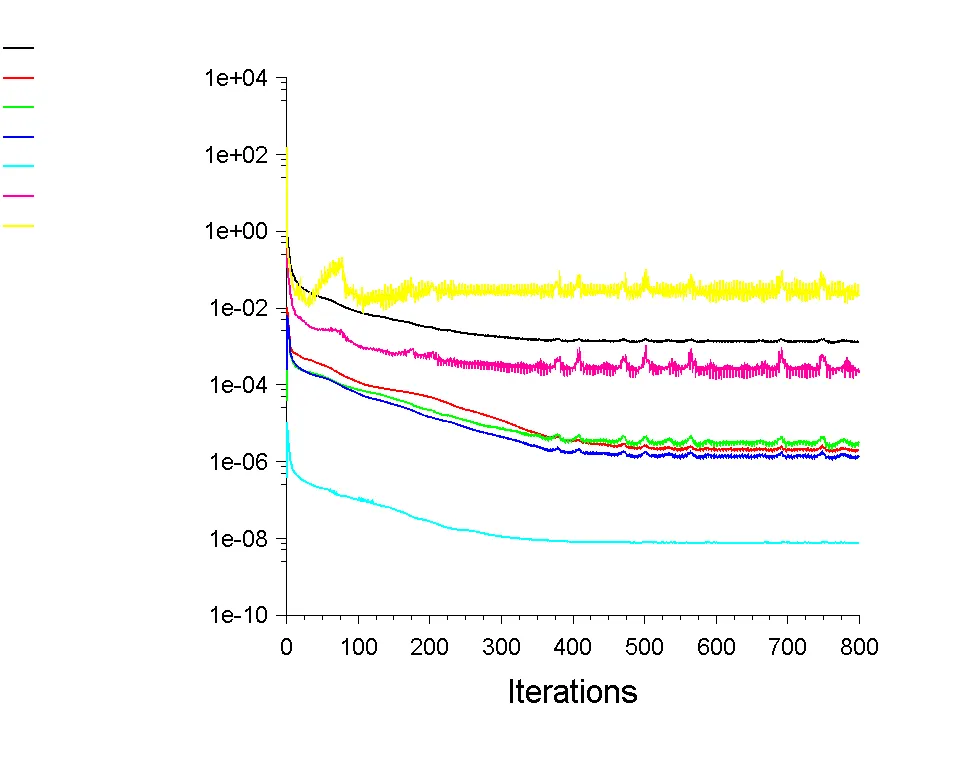
Residual Plot |
Solution is converged at around 450 iterations |
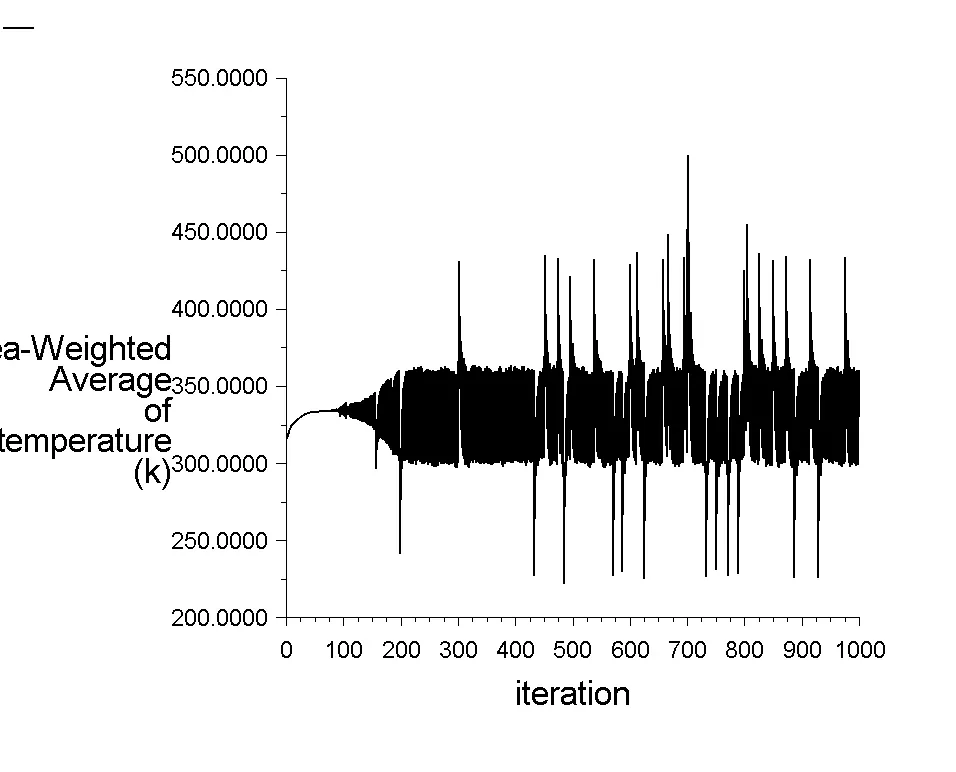 |
Temperature Plot | 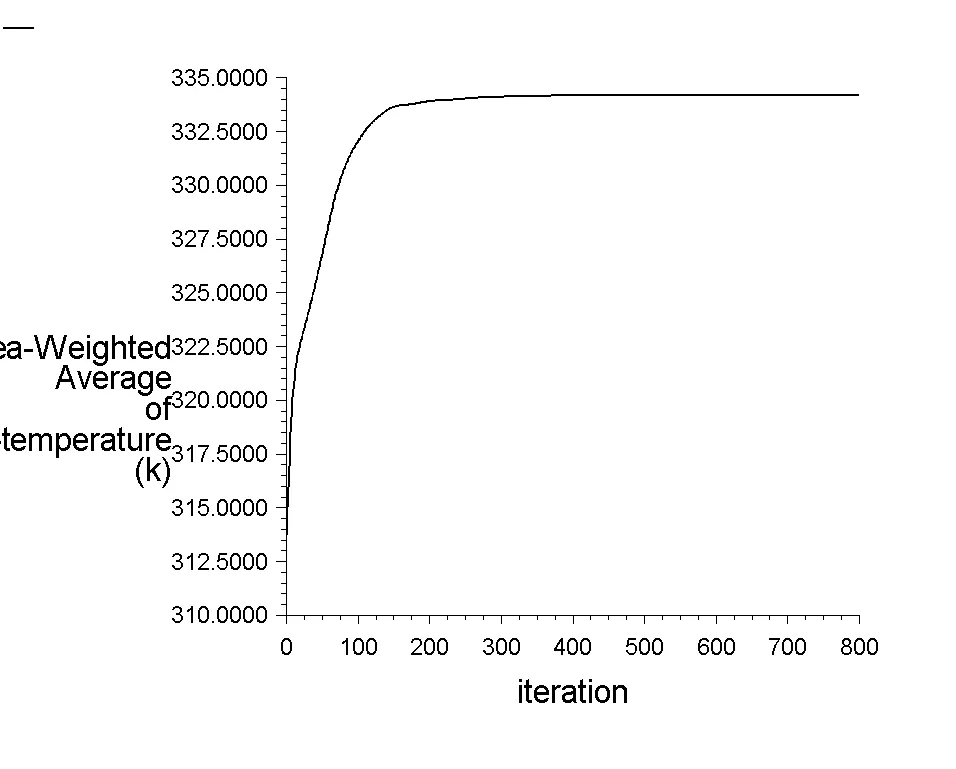 |
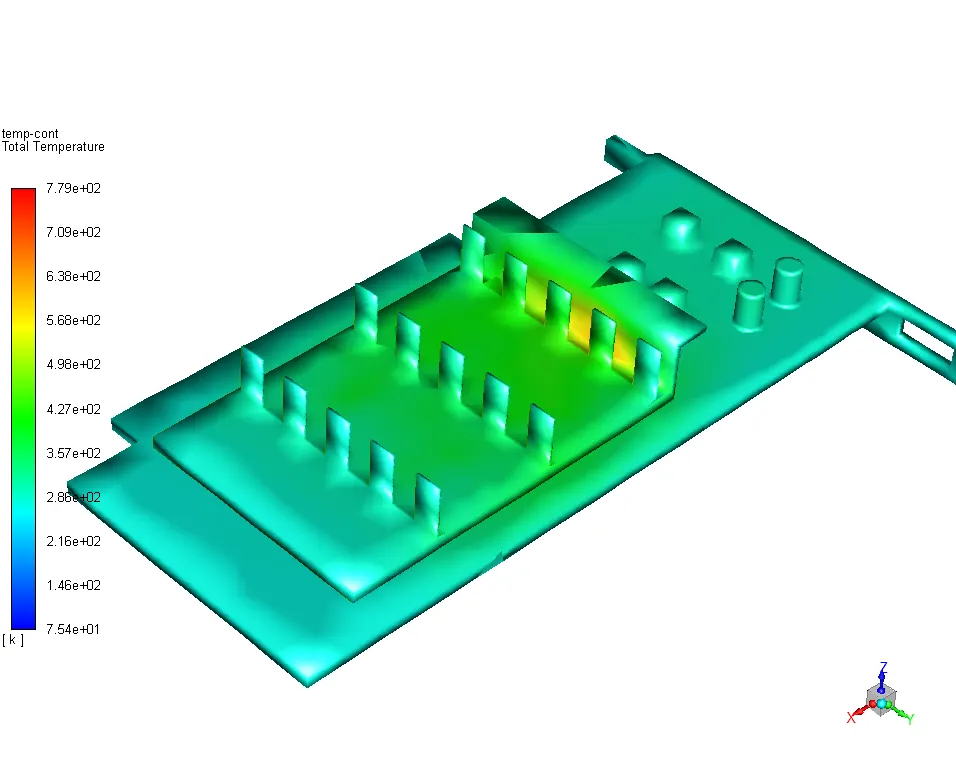 |
Temperature distribution on GPU | 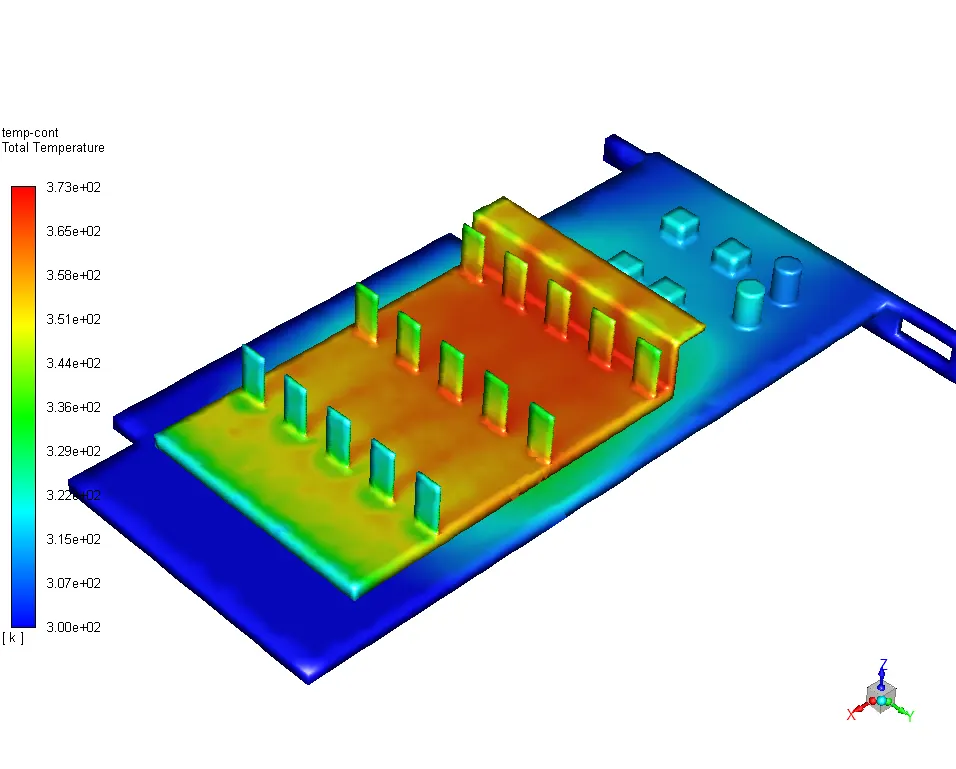 |
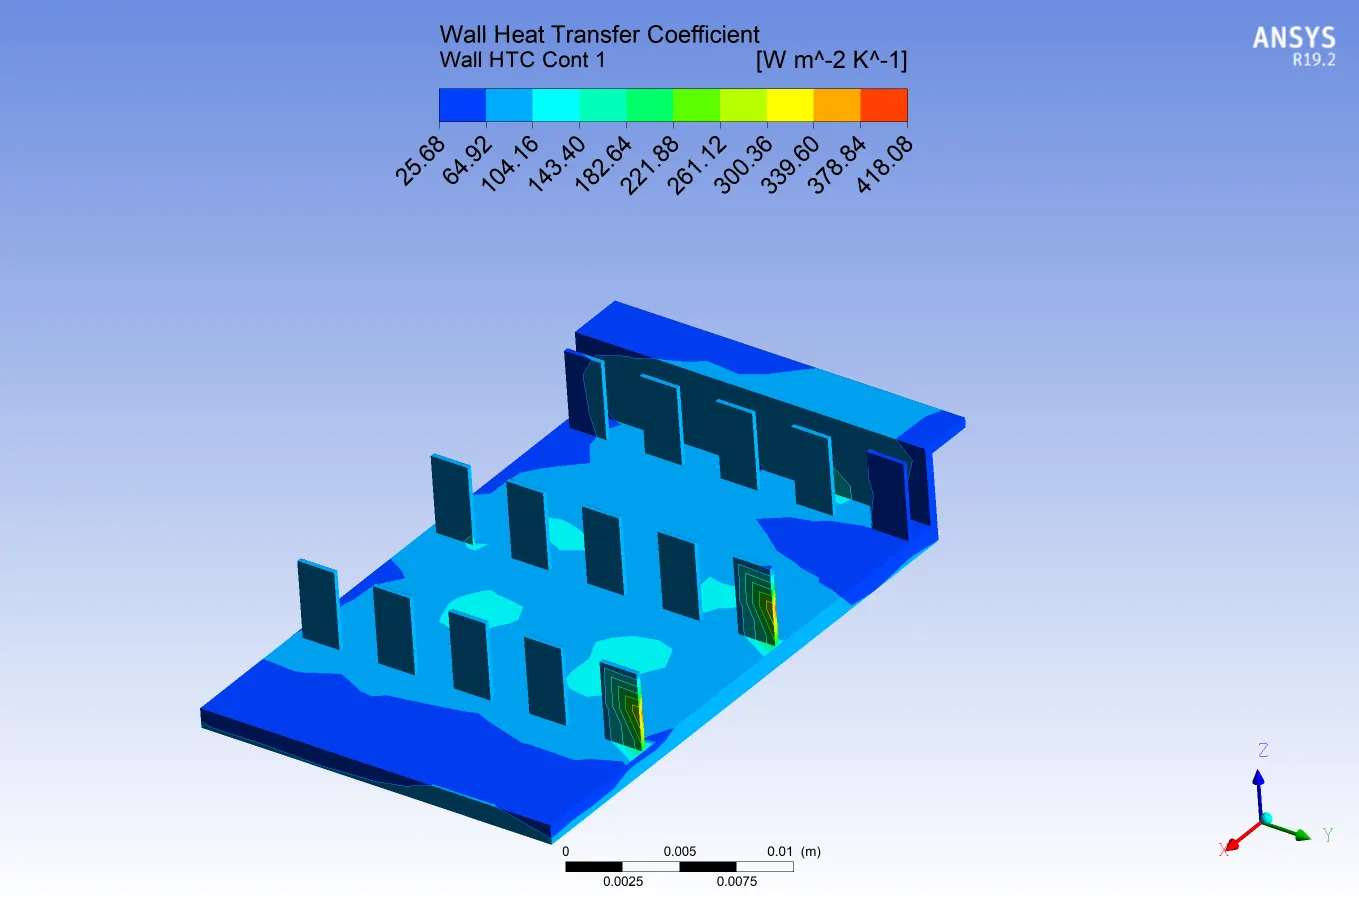 |
Wall HTC contour on Fins | 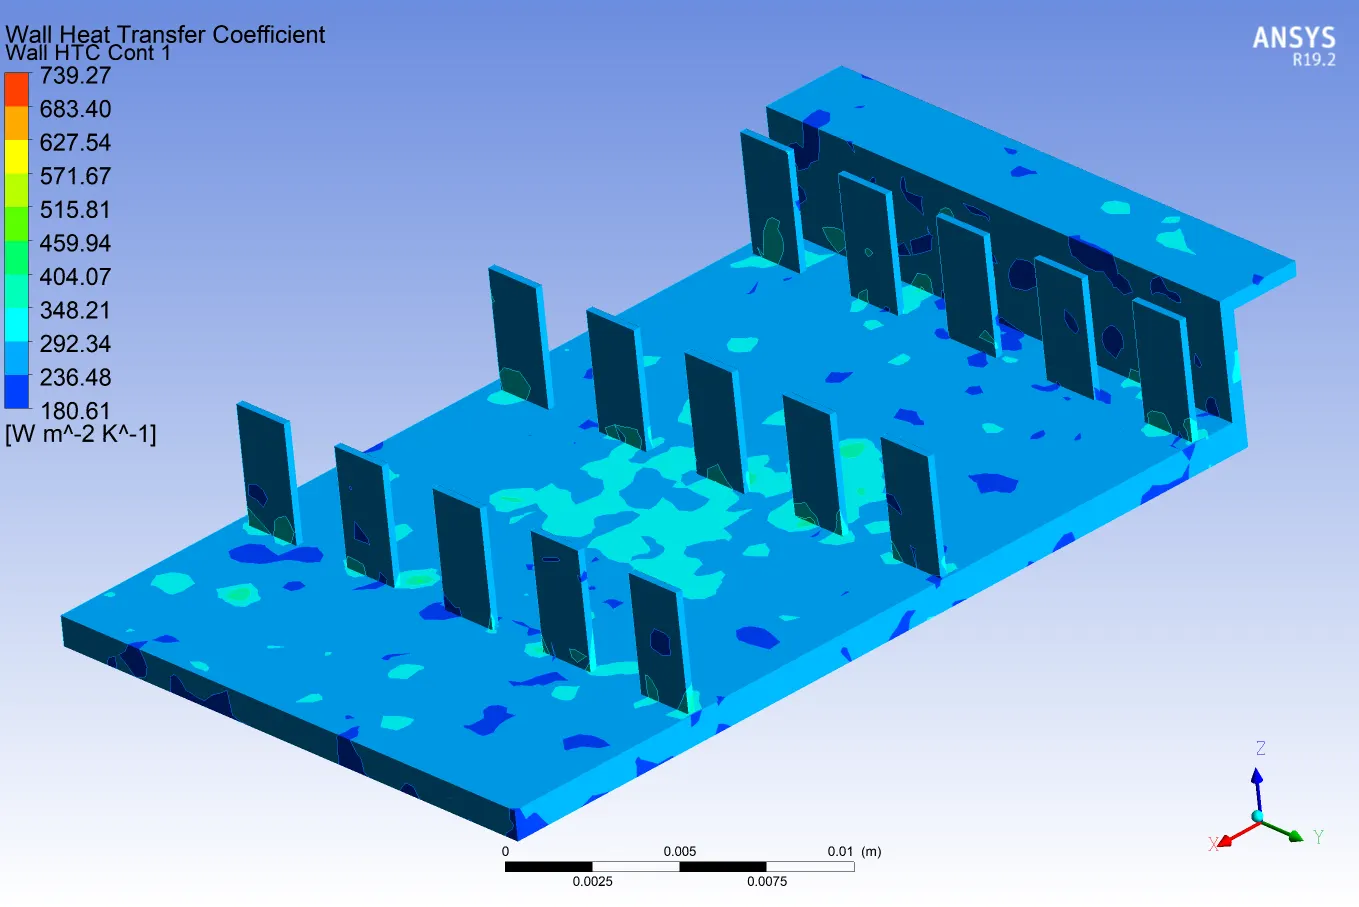 |
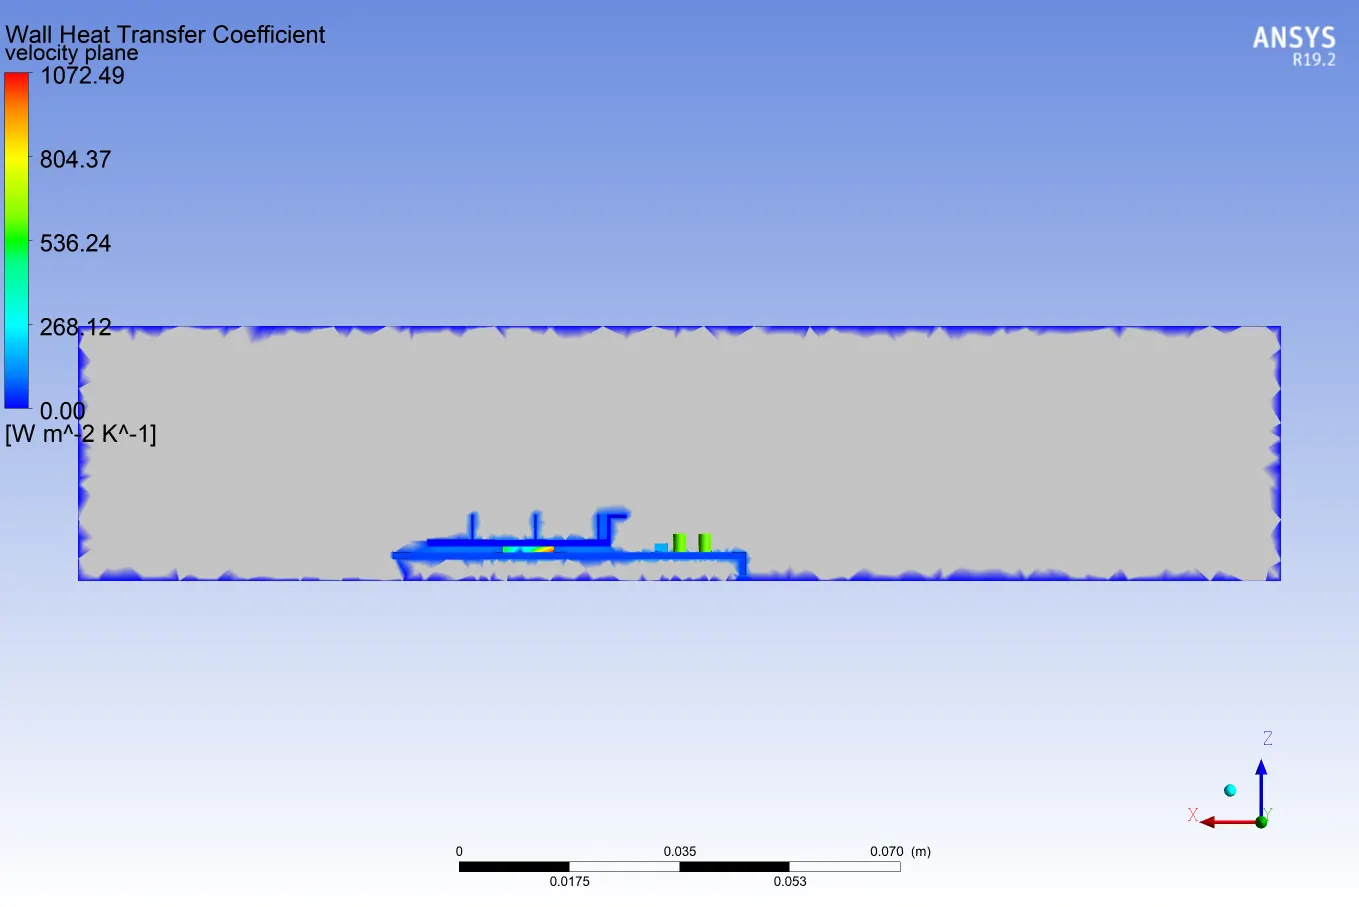 |
Wall HTC contour plot on Cut plane | 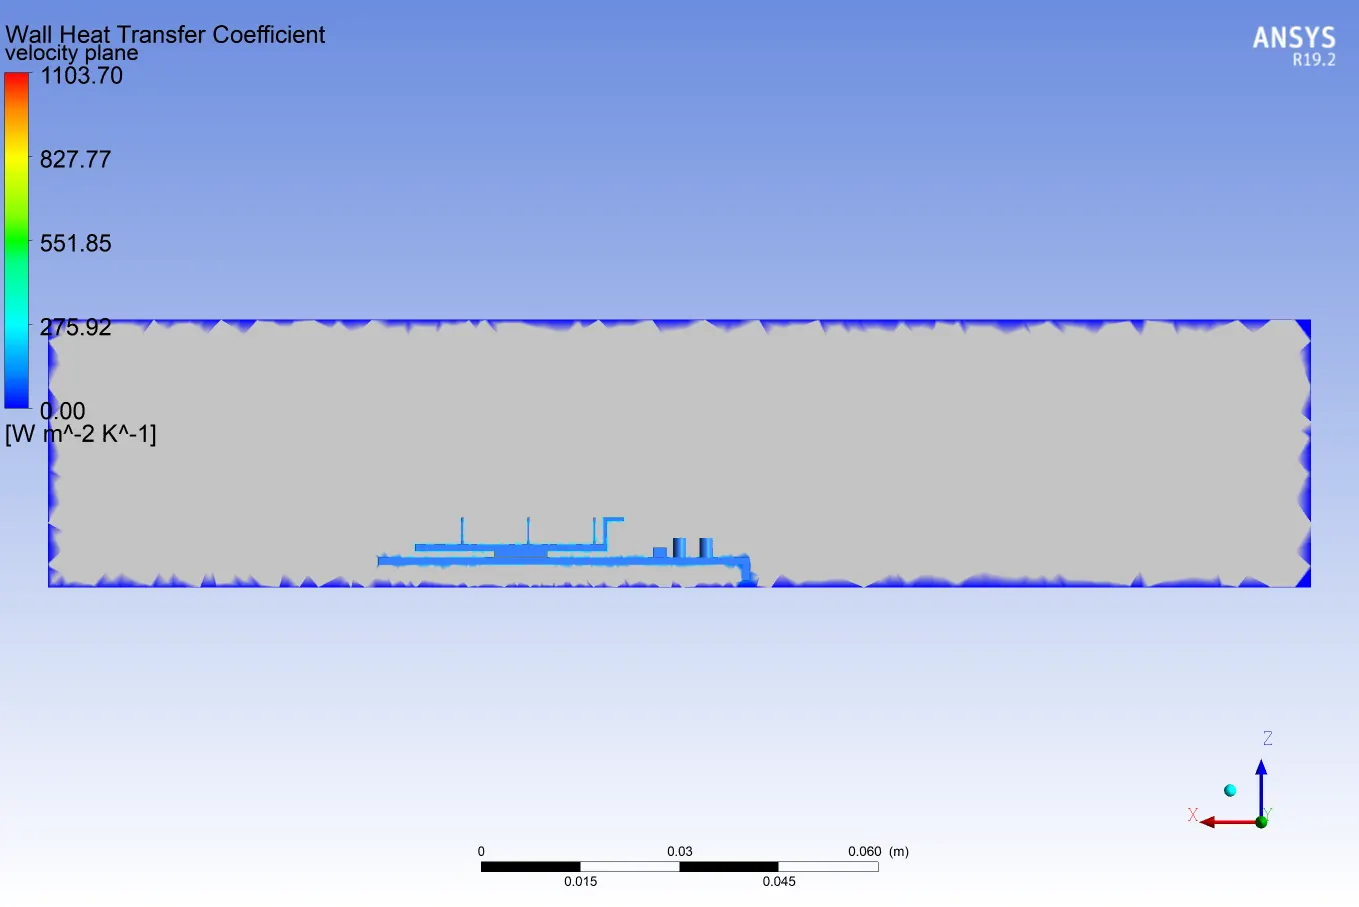 |
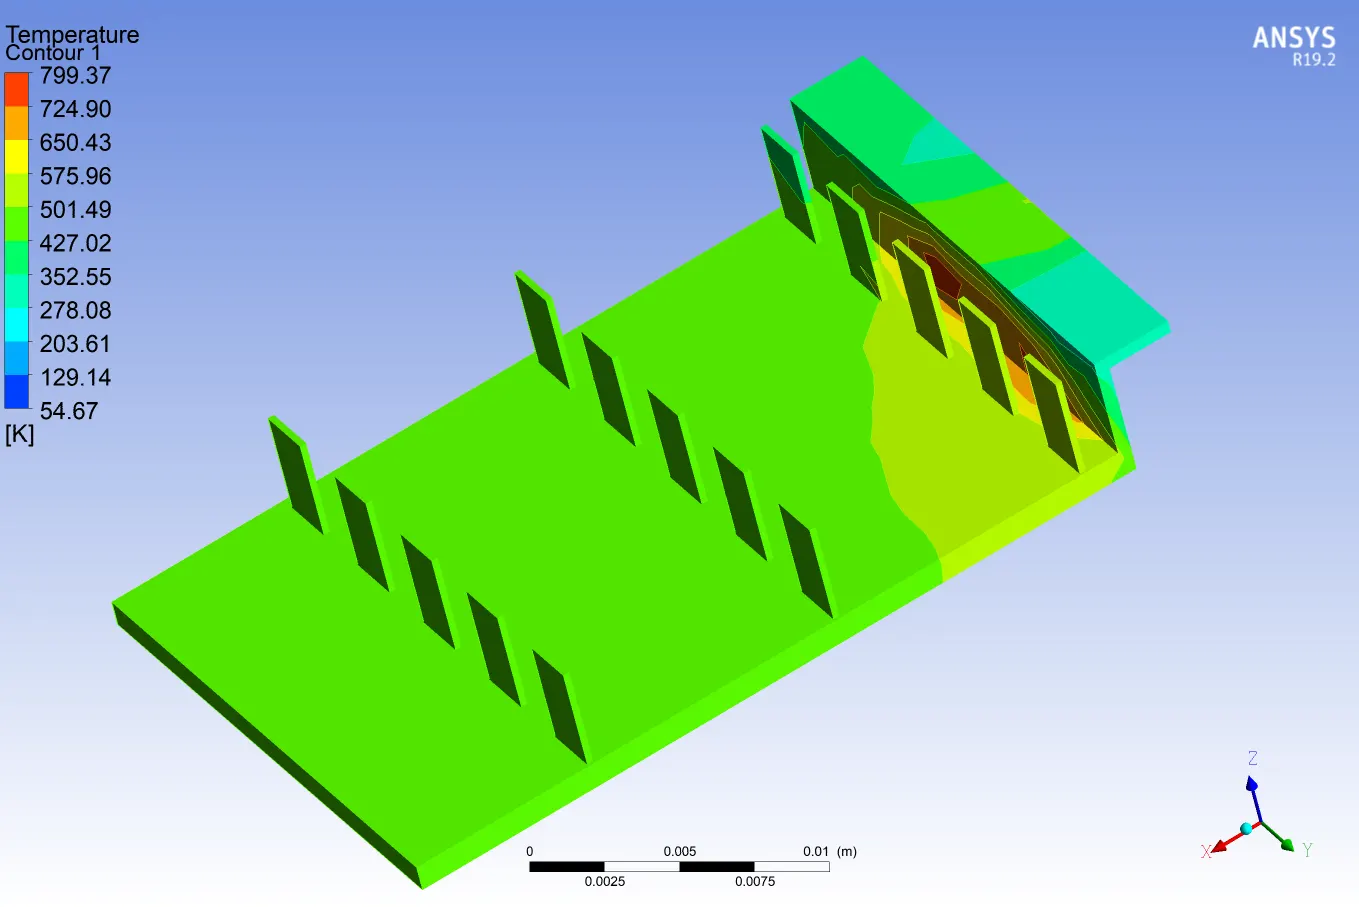 |
Temperature contour on Fins | 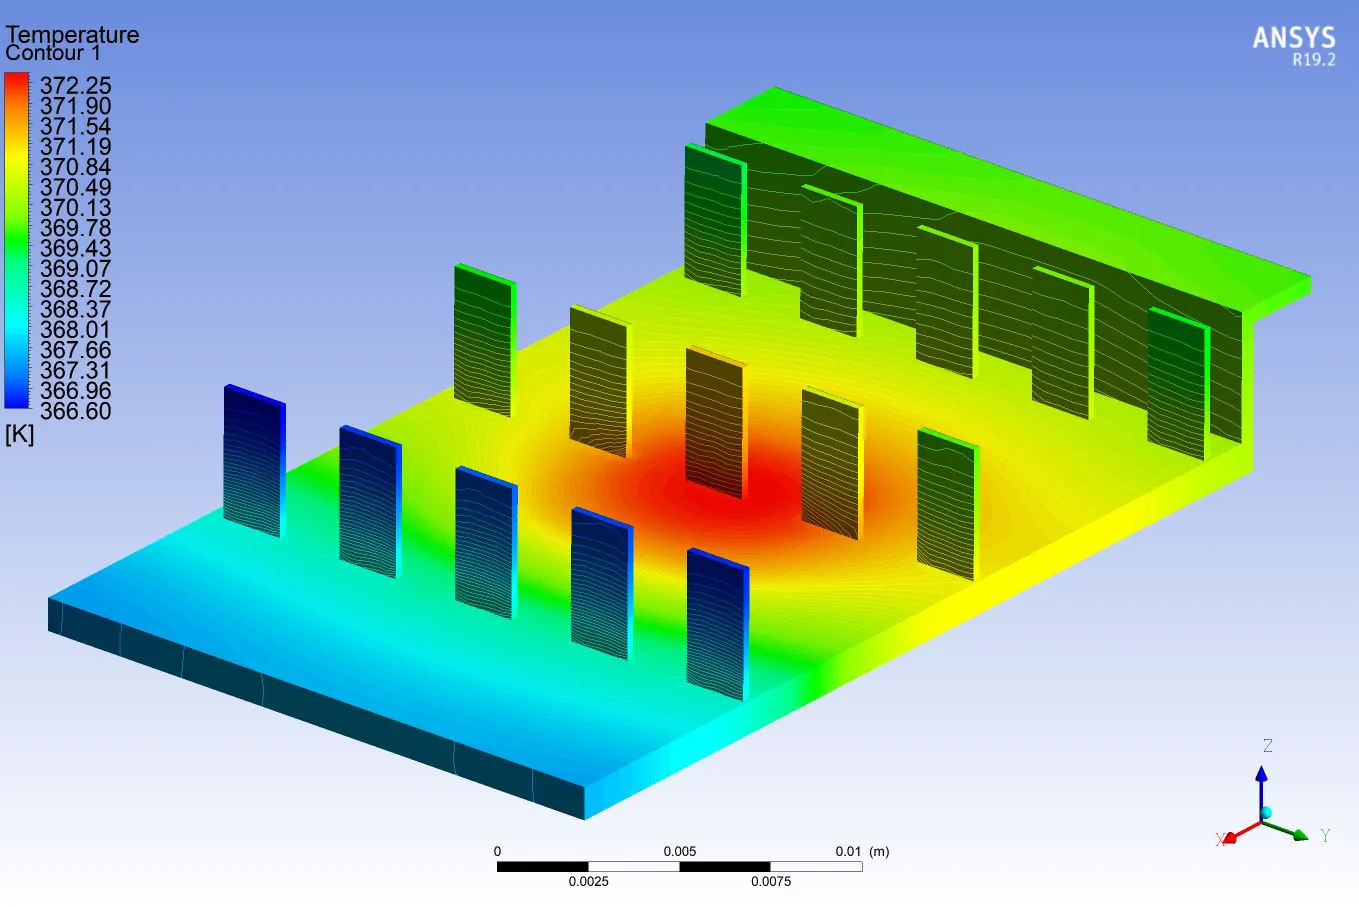 |
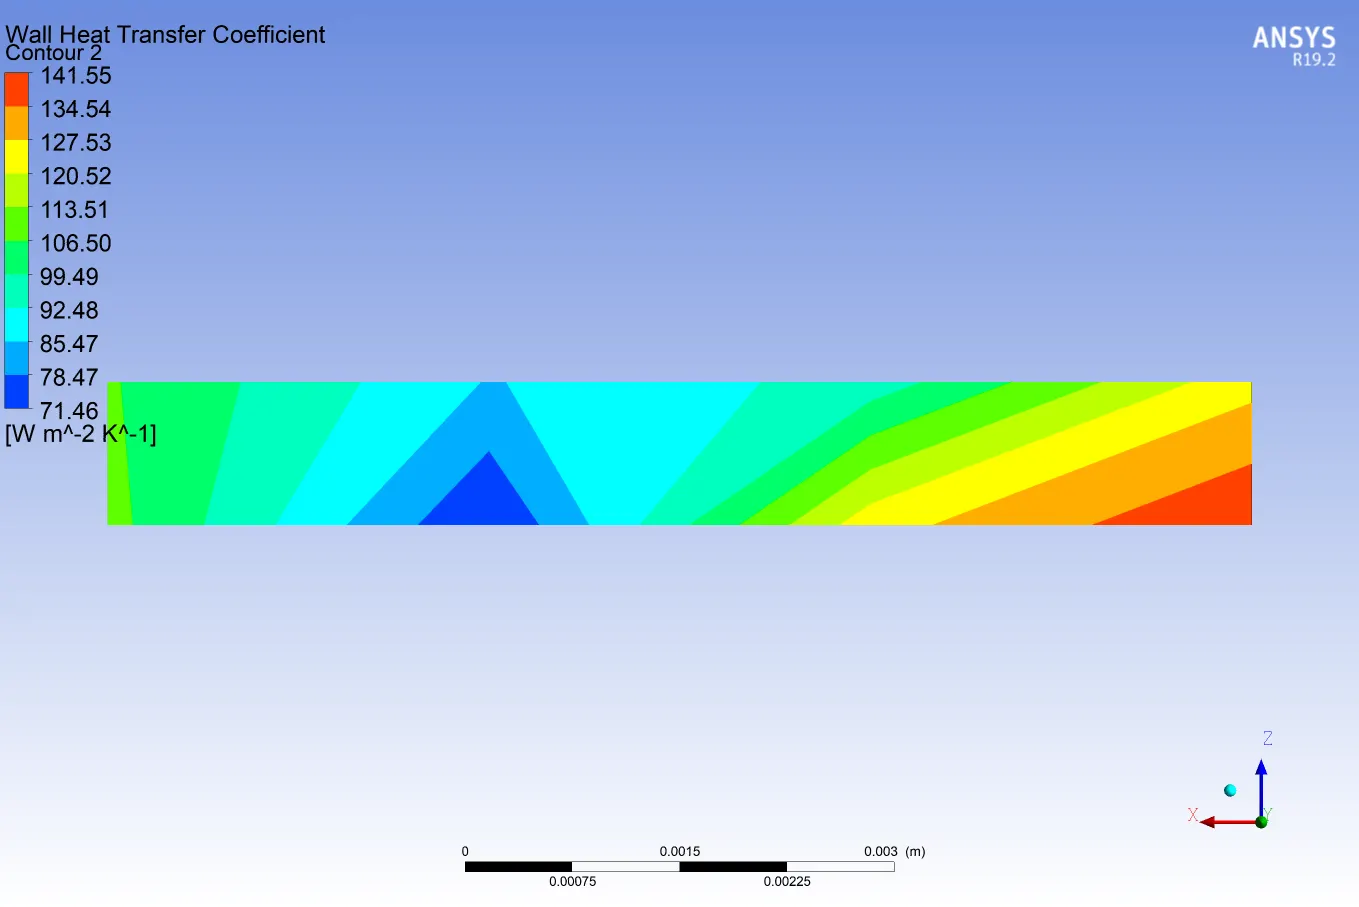 |
Wall HTC contur on Processsor | 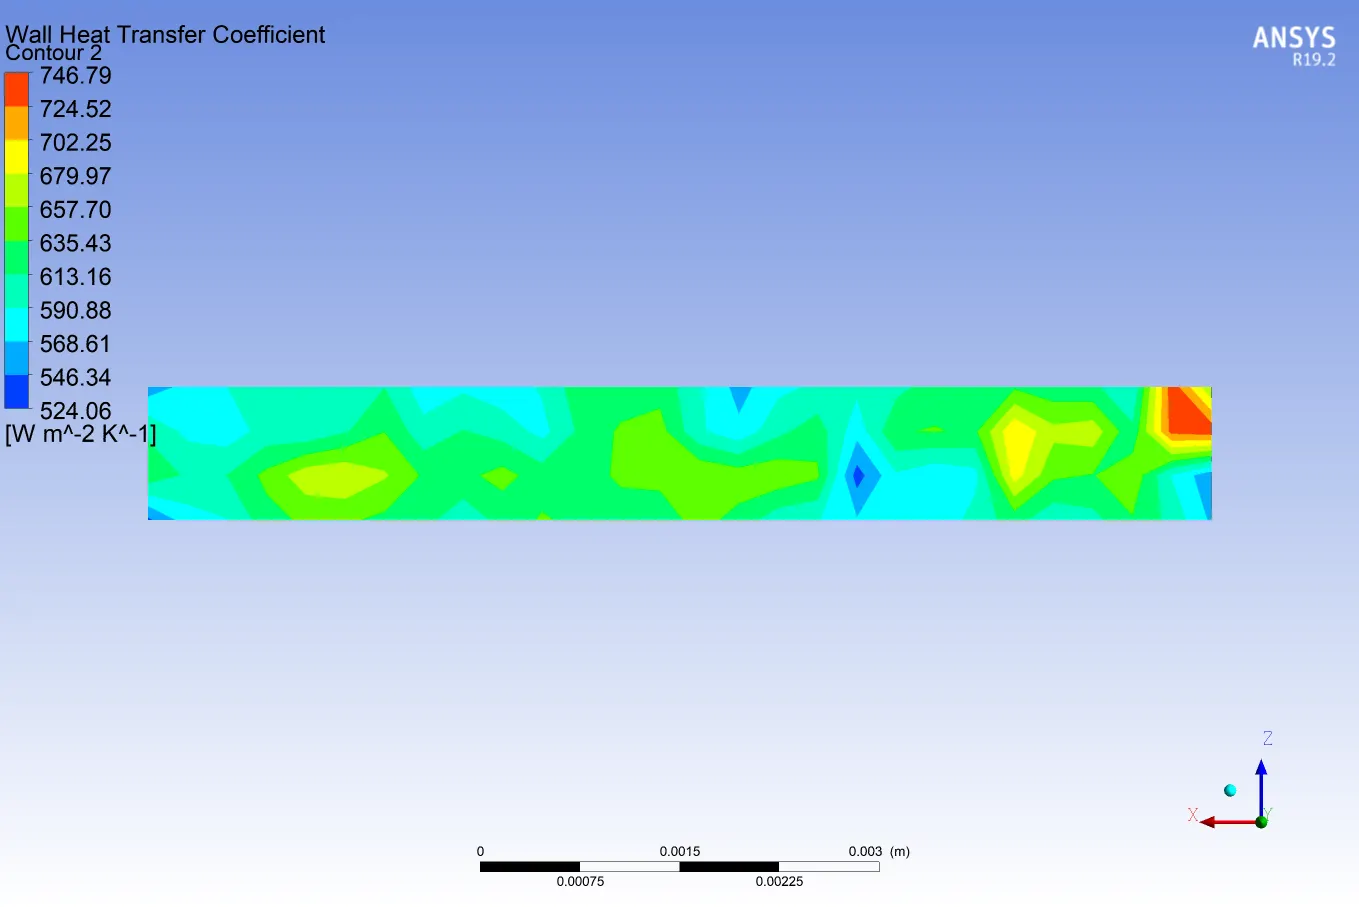 |
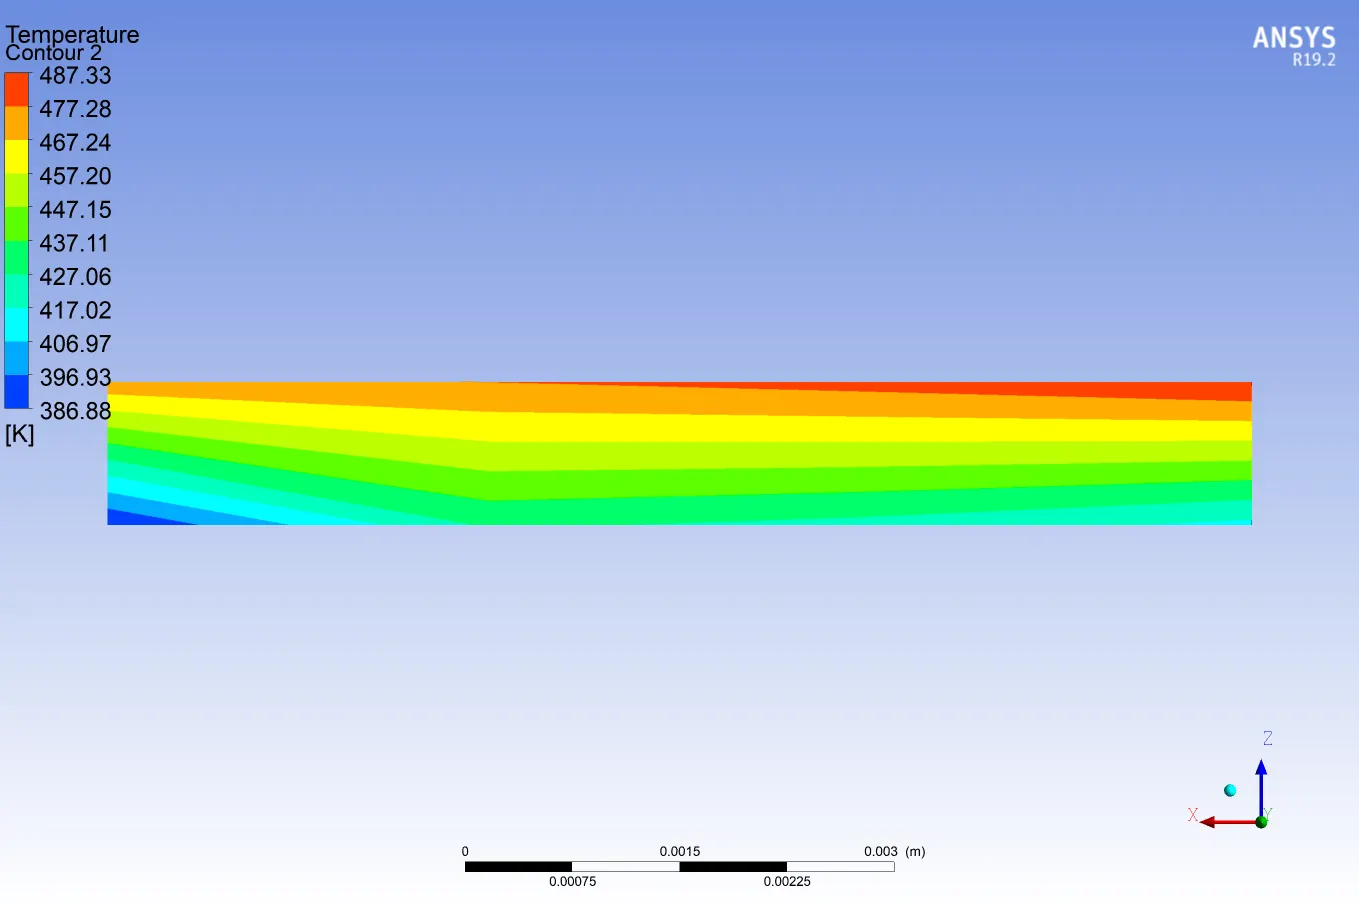 |
Temperature distribution on Processor | 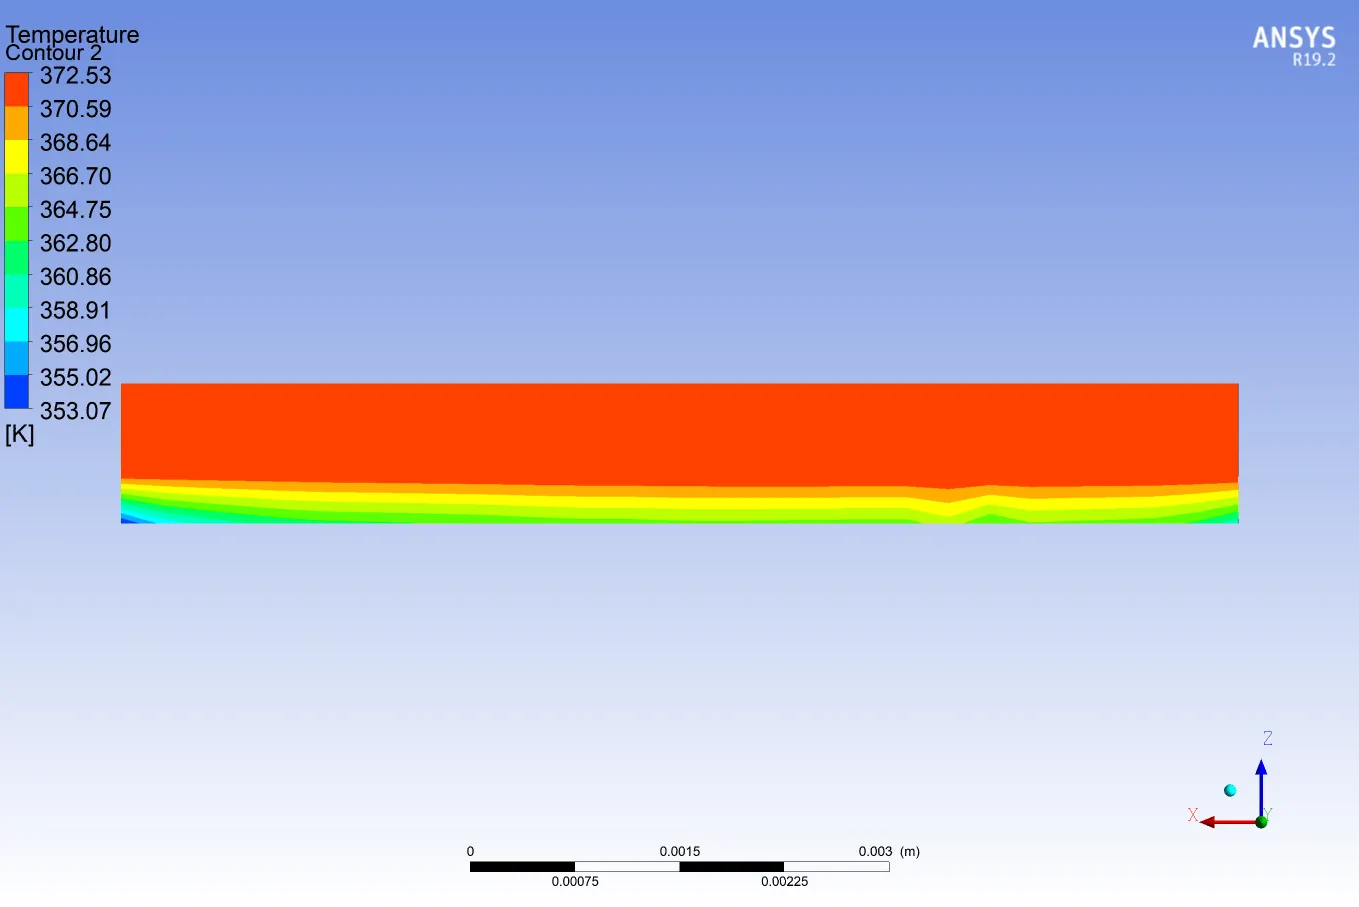 |
 |
Temperature Contour on Base Circuit Board | 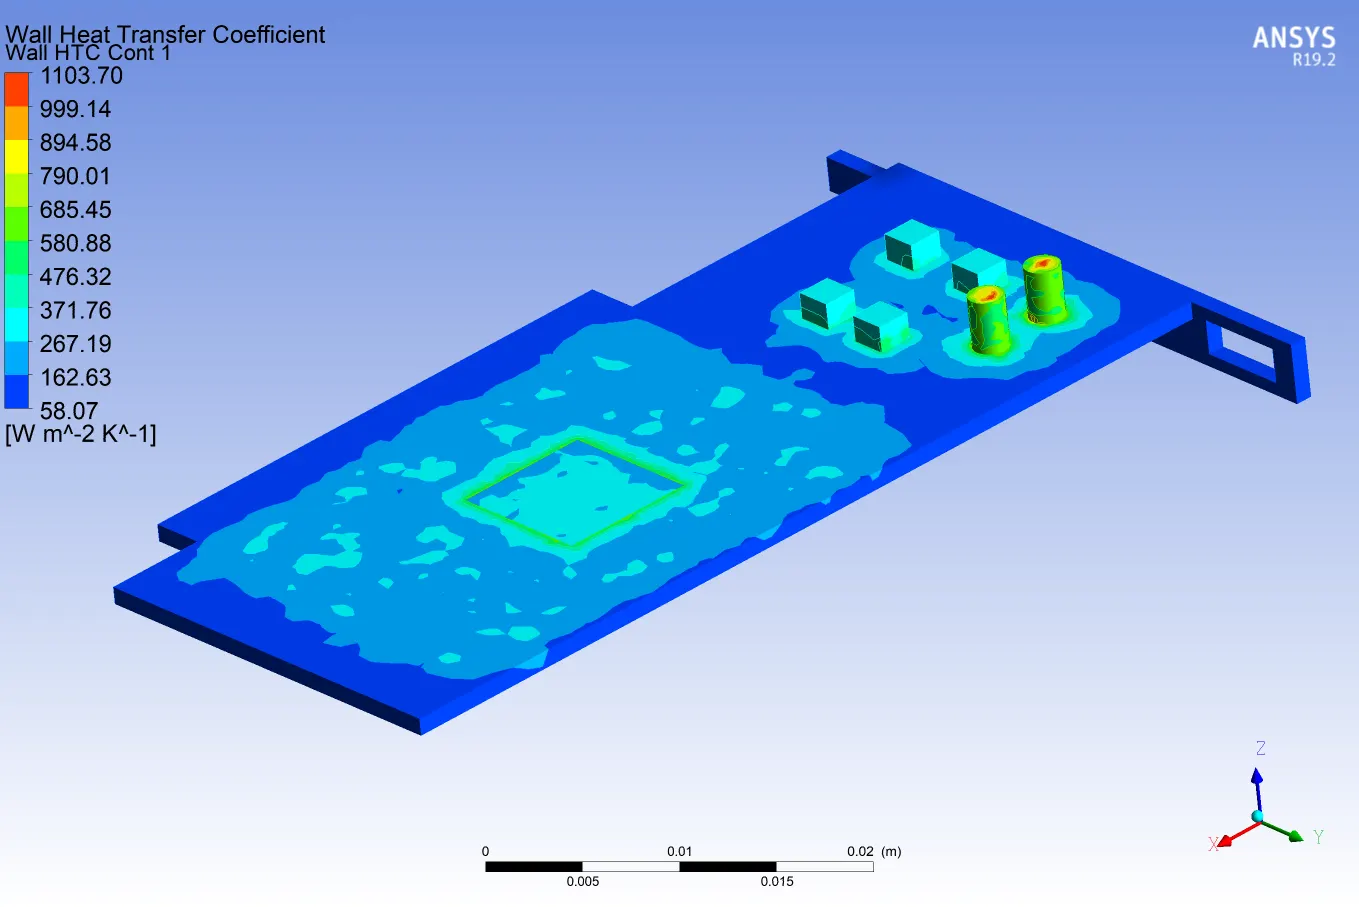 |
 |
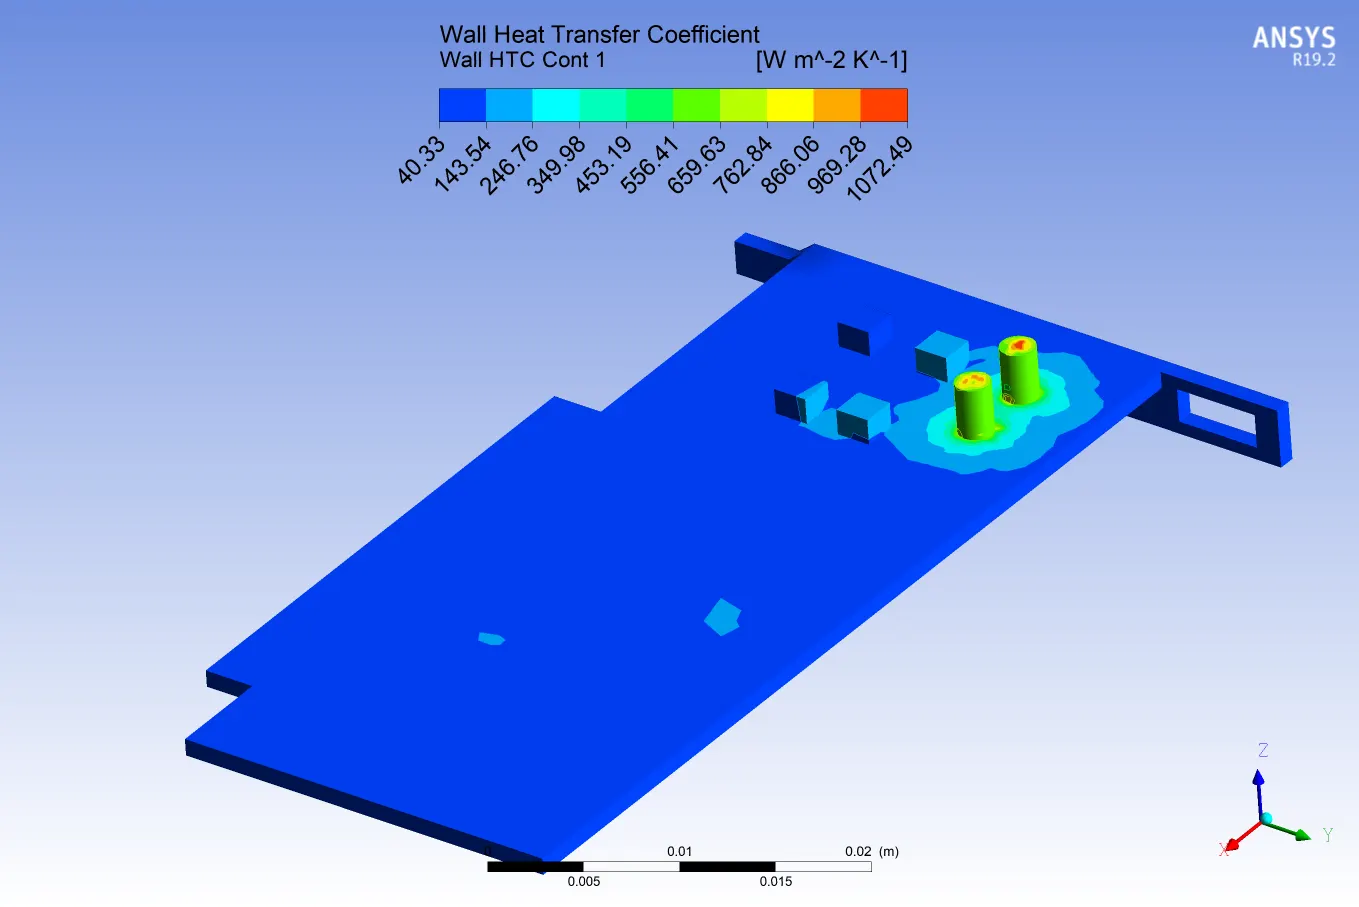
Wall HTC contour on Base Circuit Board |
 |
 |
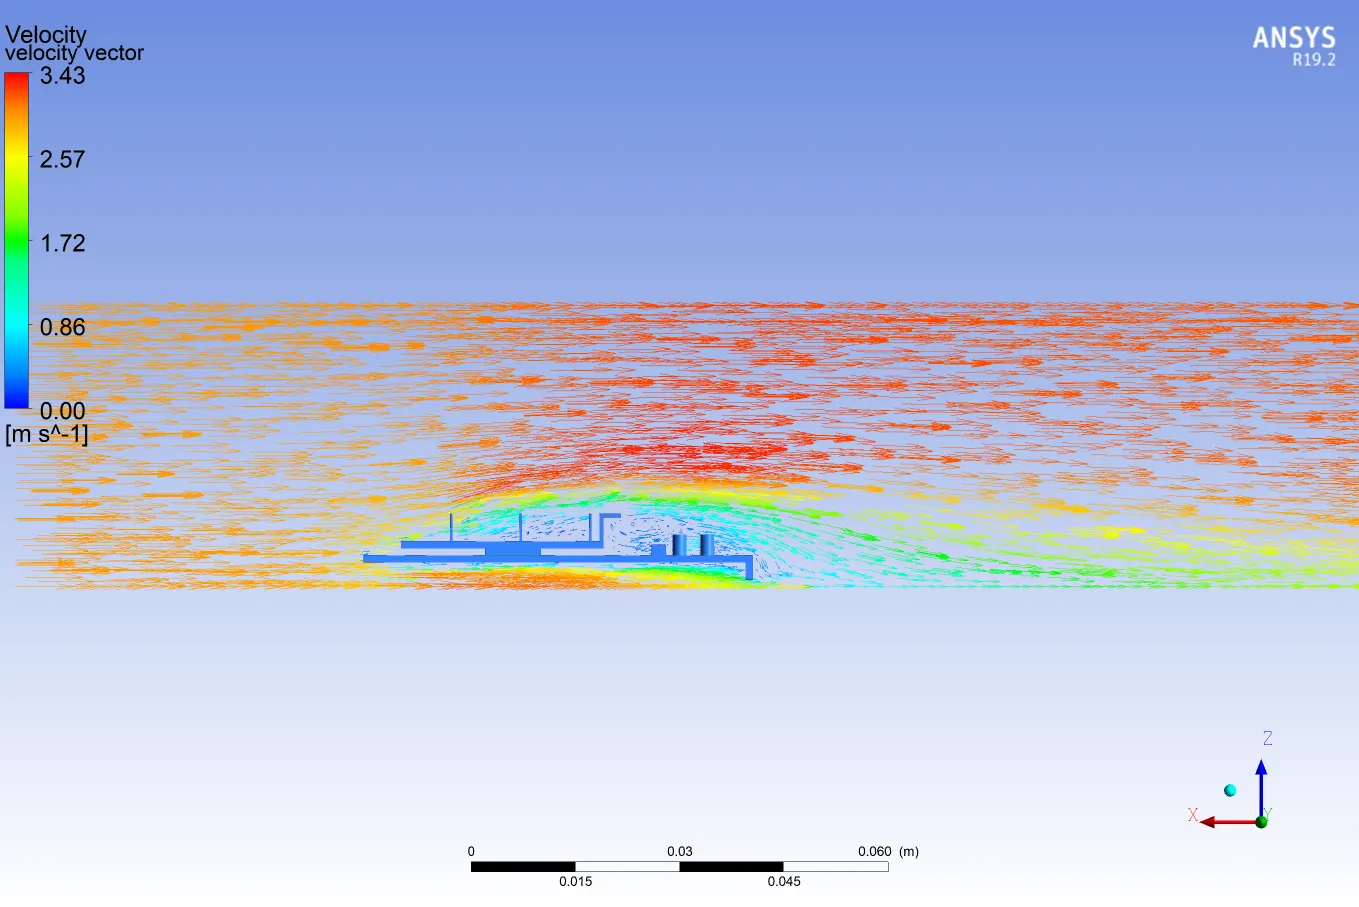
Velocity Contour on Cut plane | 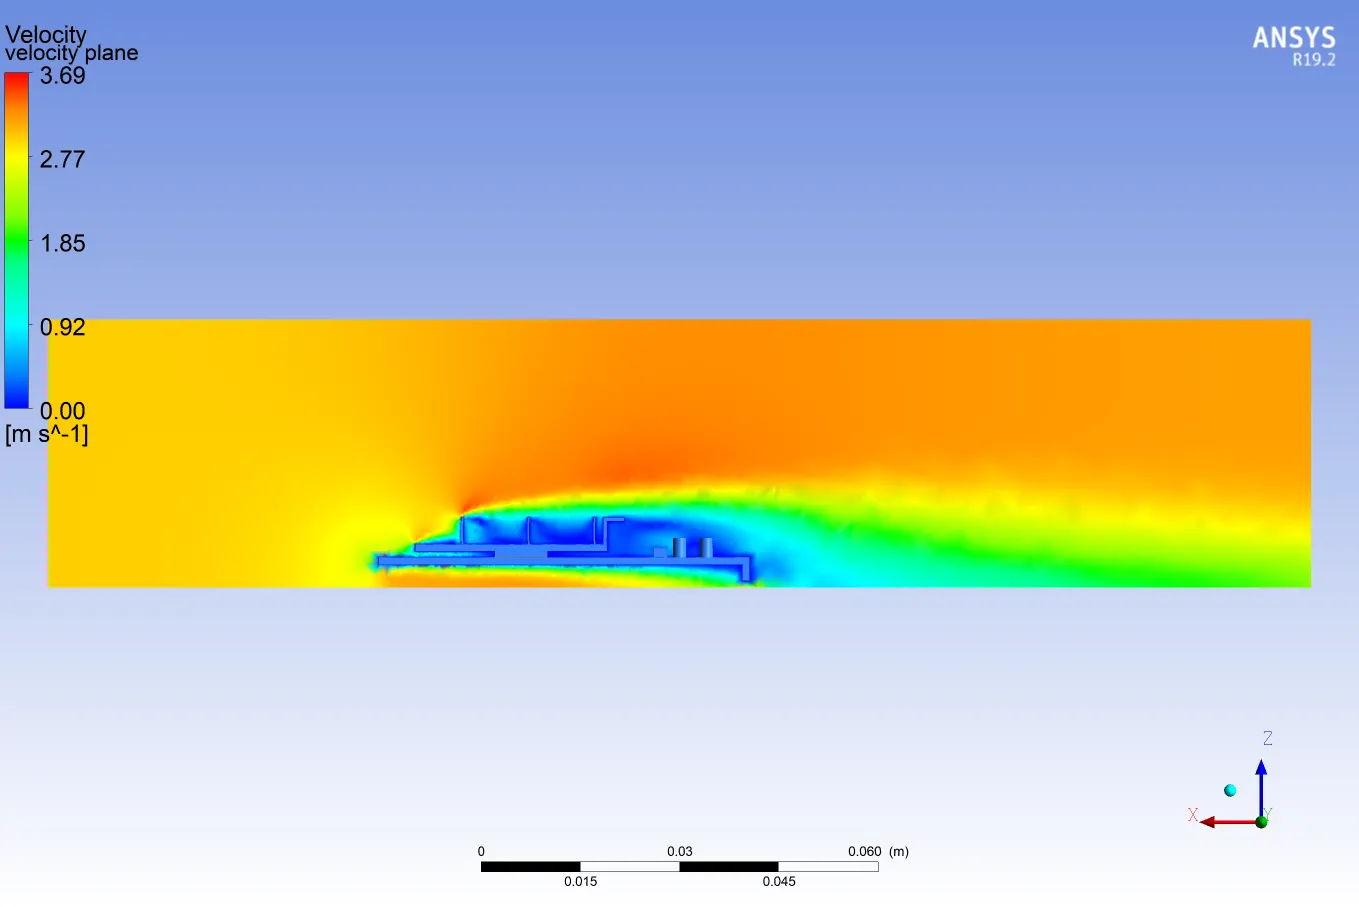 |
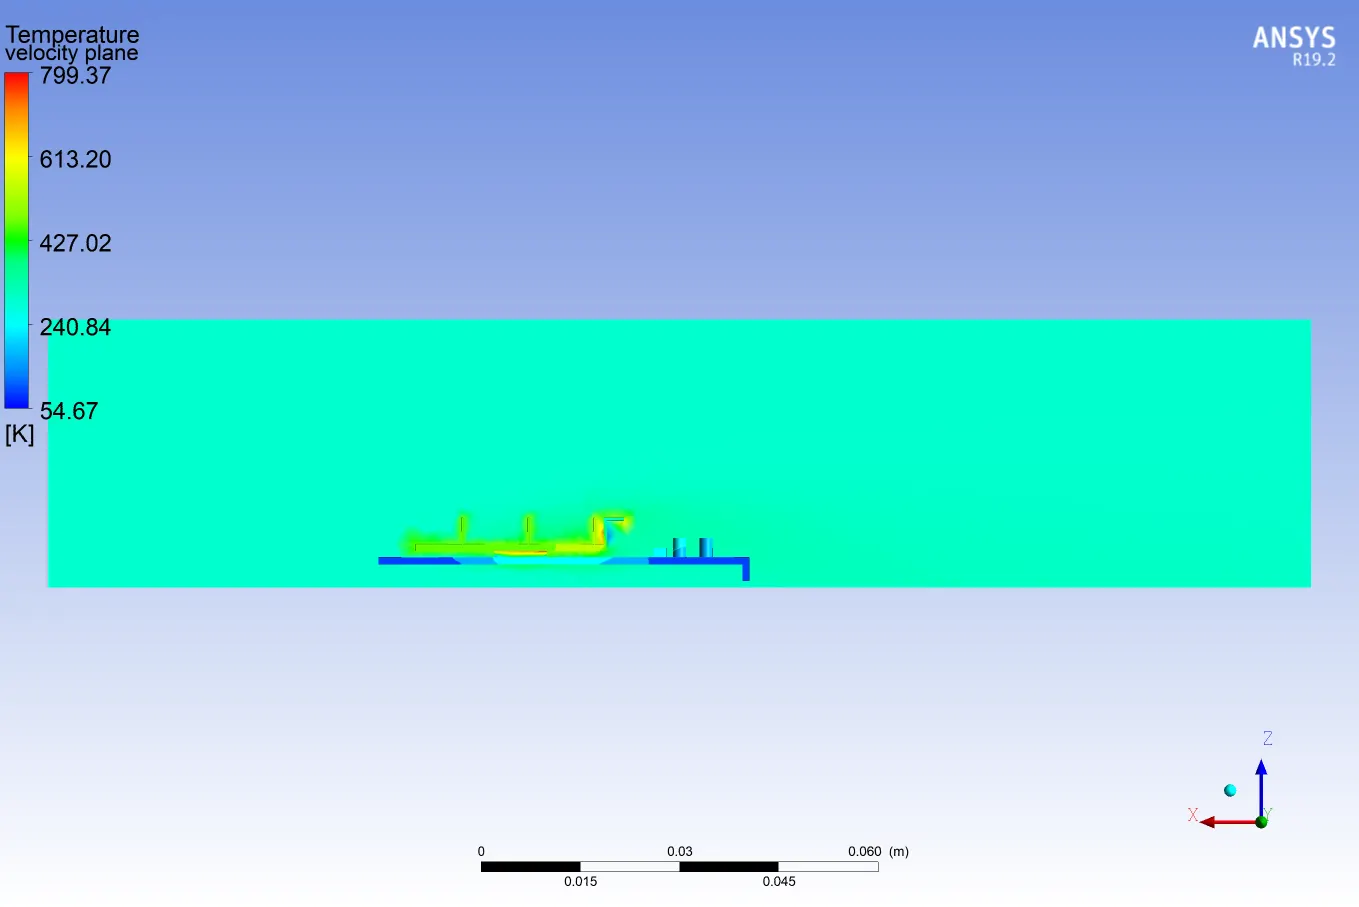 |
Temperature Contour on Cut plane | 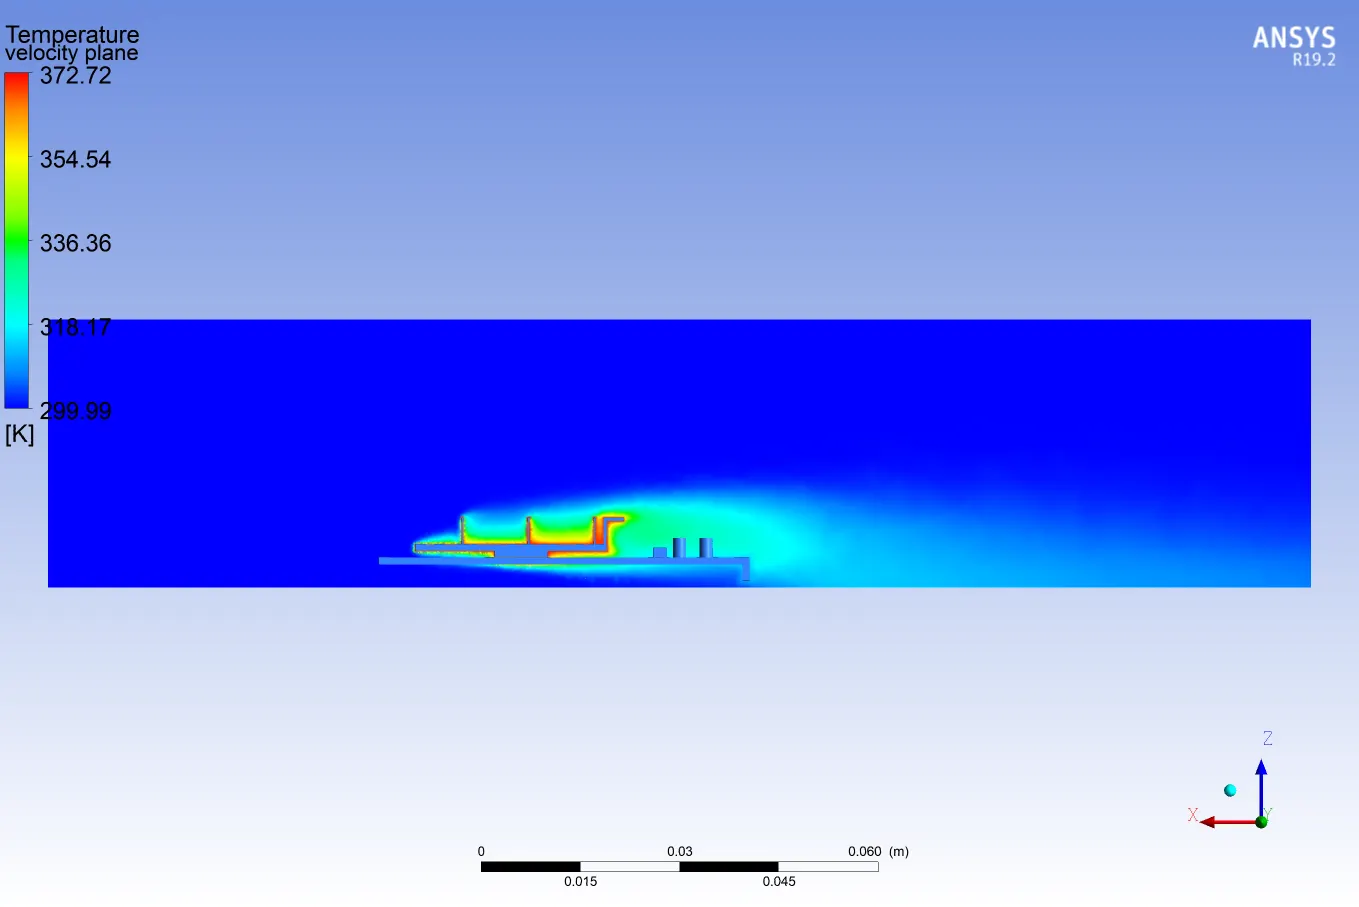 |
 |
Velocity Vectors | 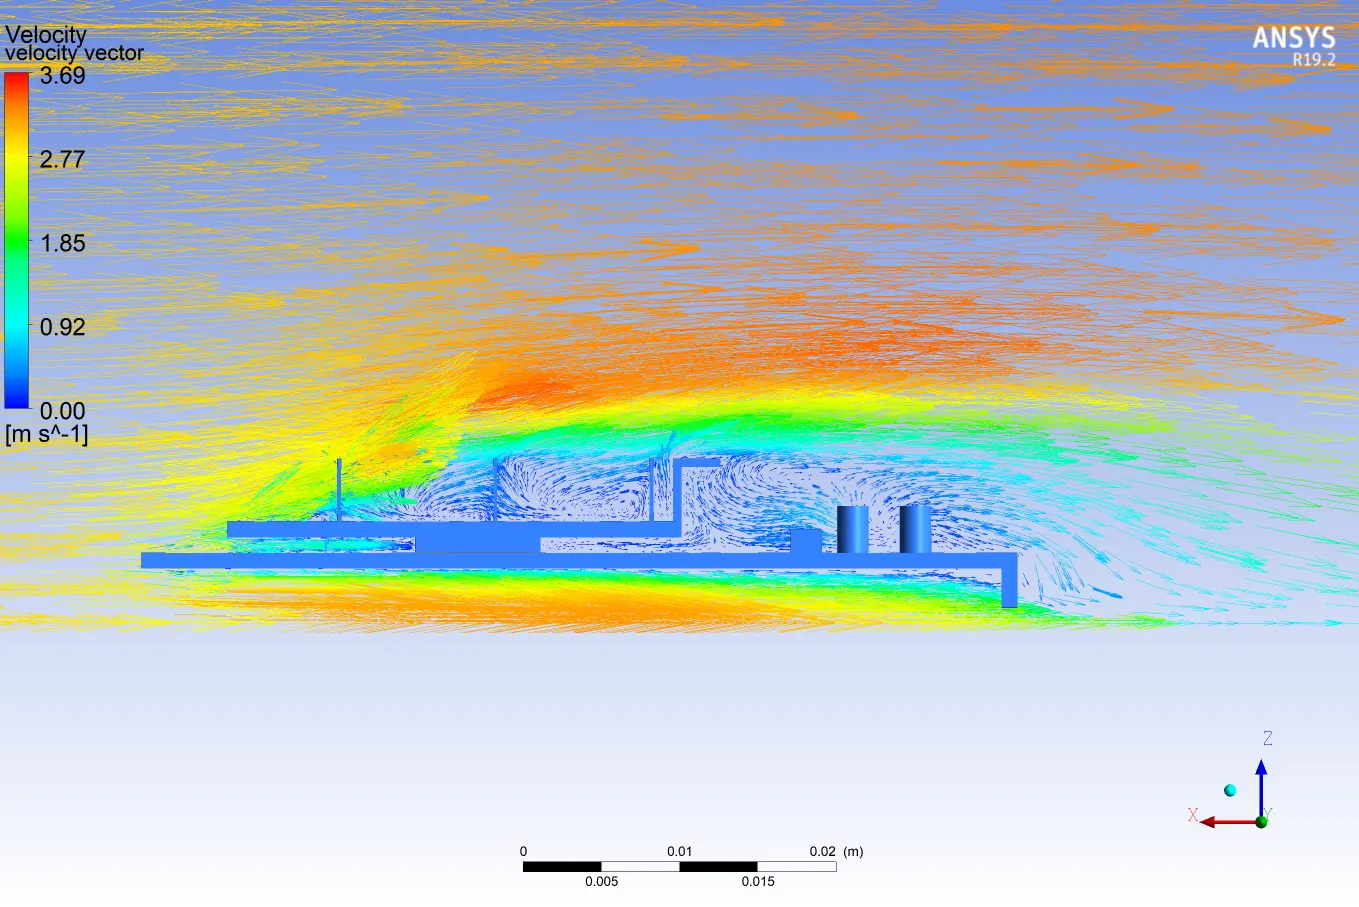 |
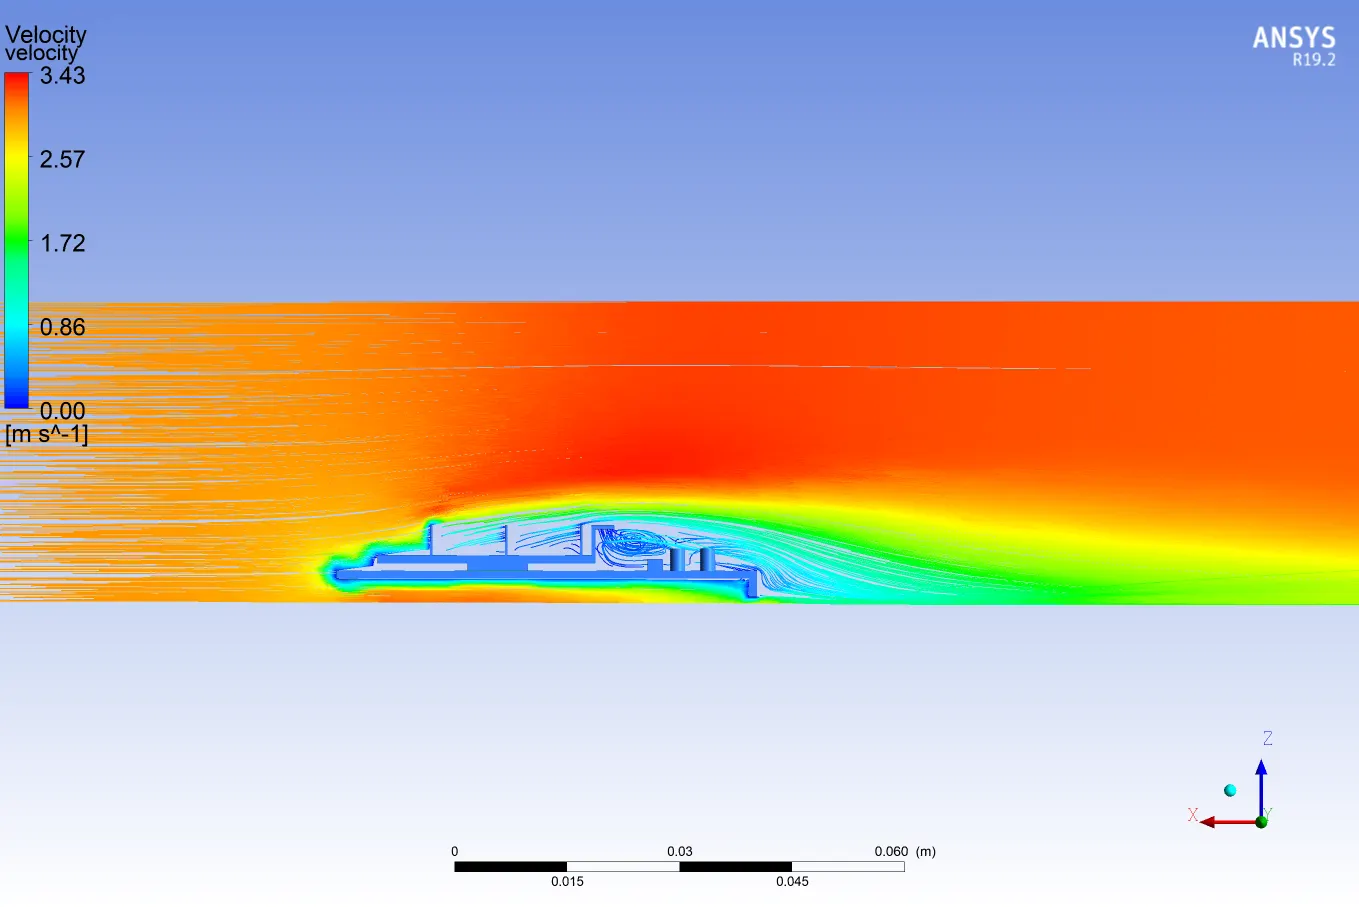 |
Velocity Streamlines | 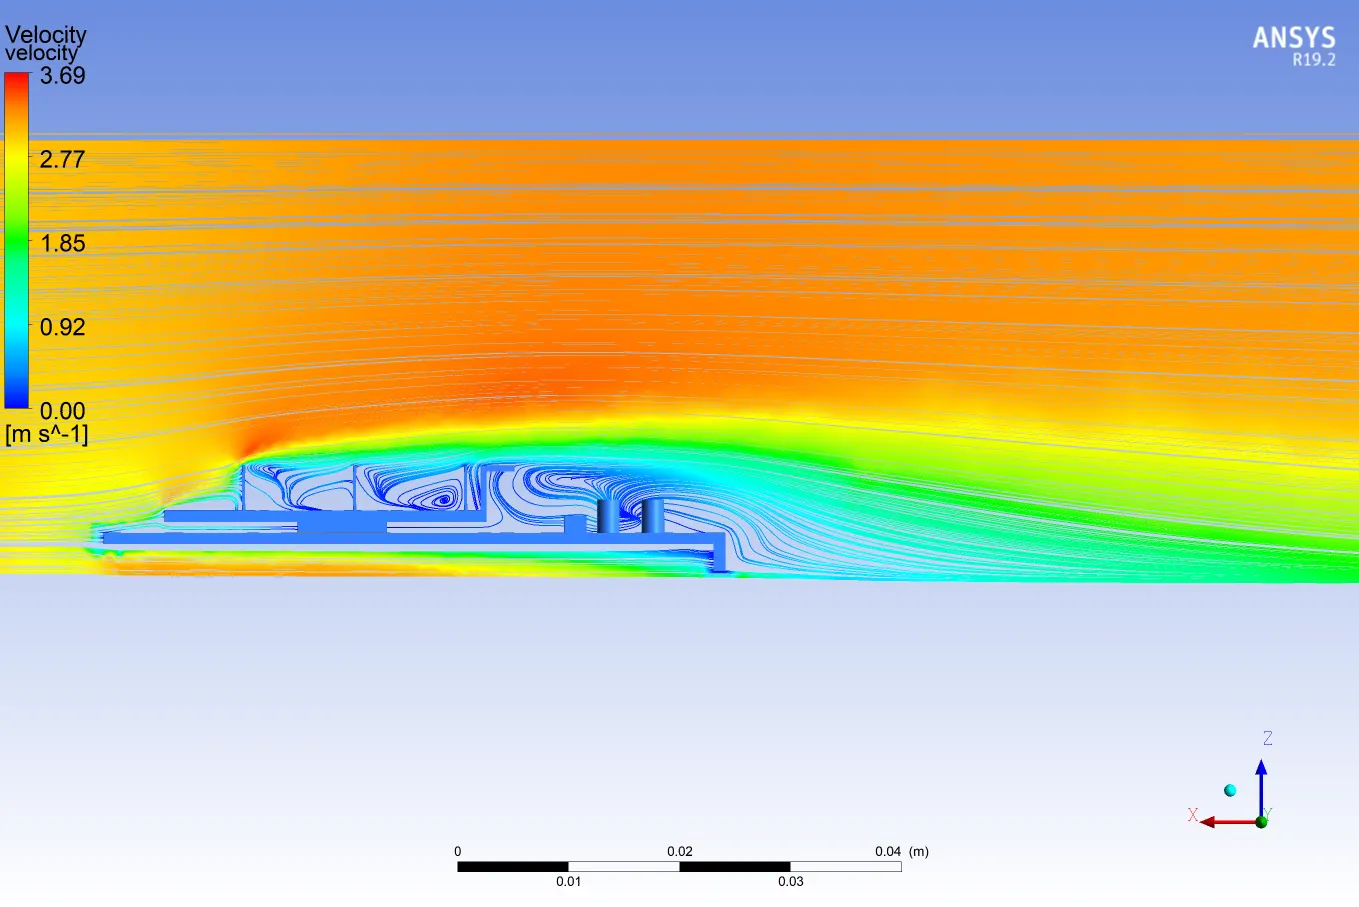 |
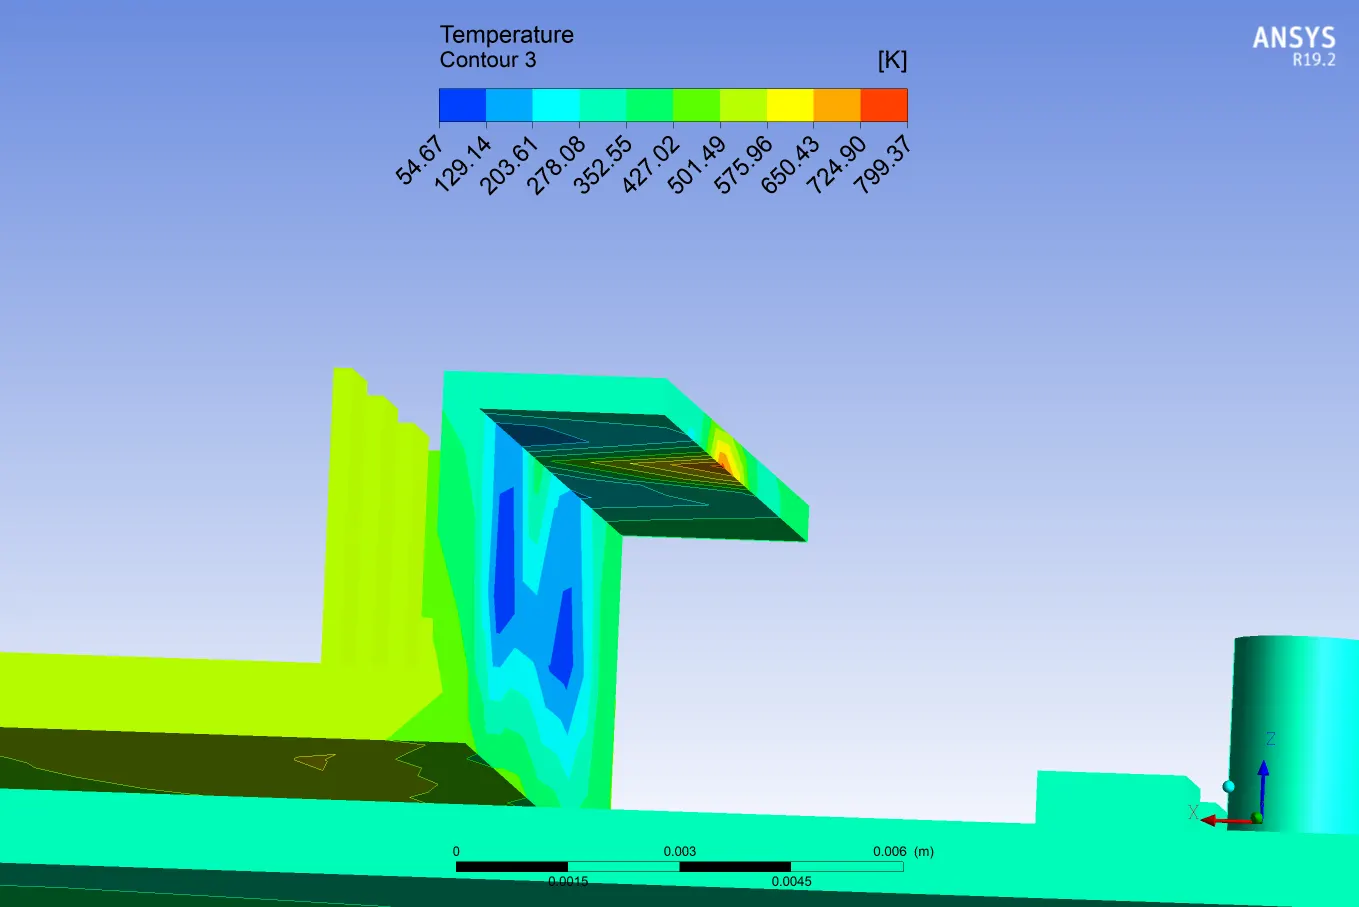 |
Temperature contour |
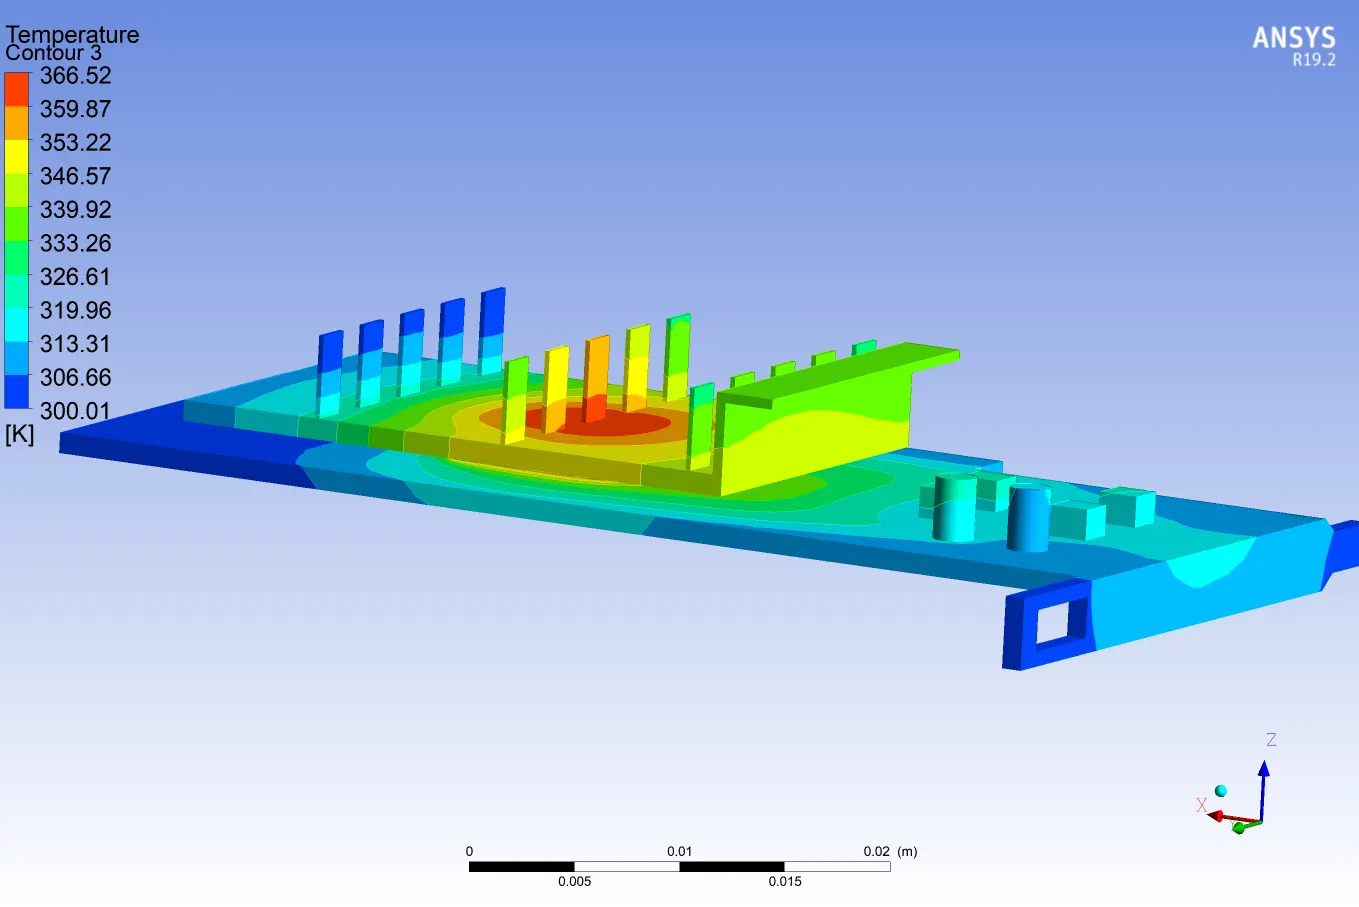 |
Temperature Contour Animation :
For Baseline Mesh: For Refined Mesh:
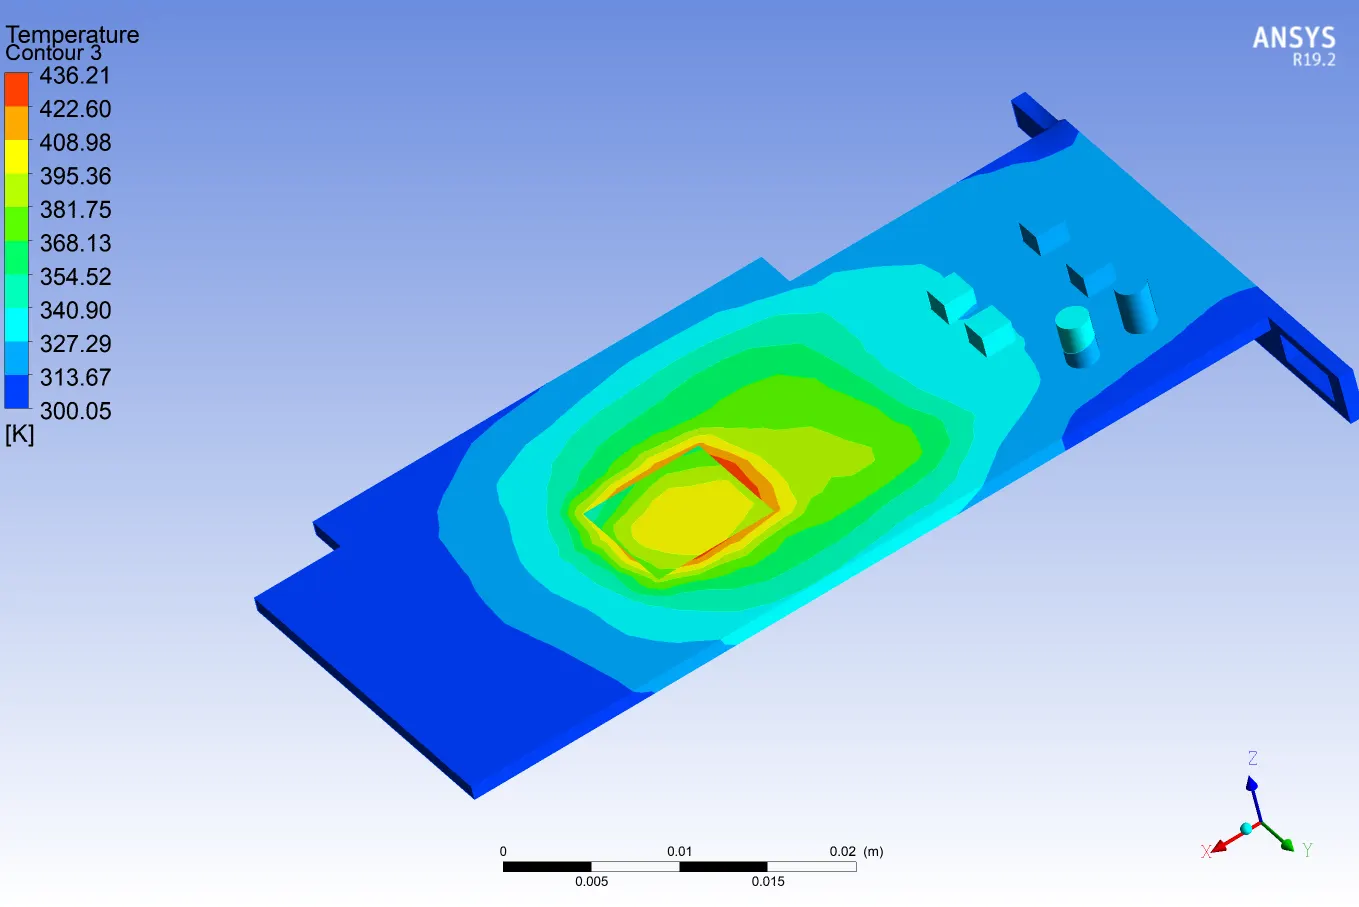
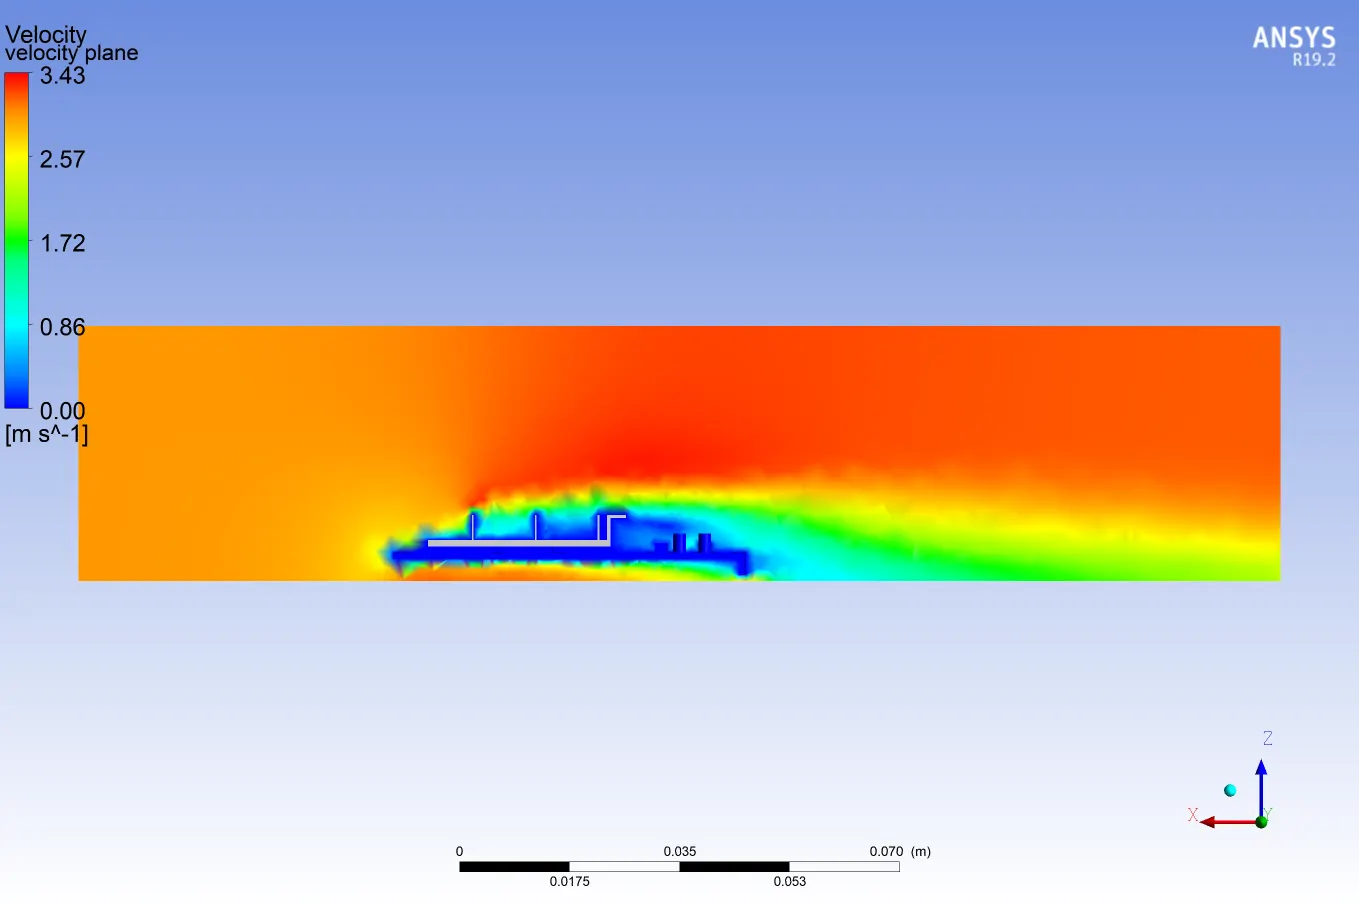
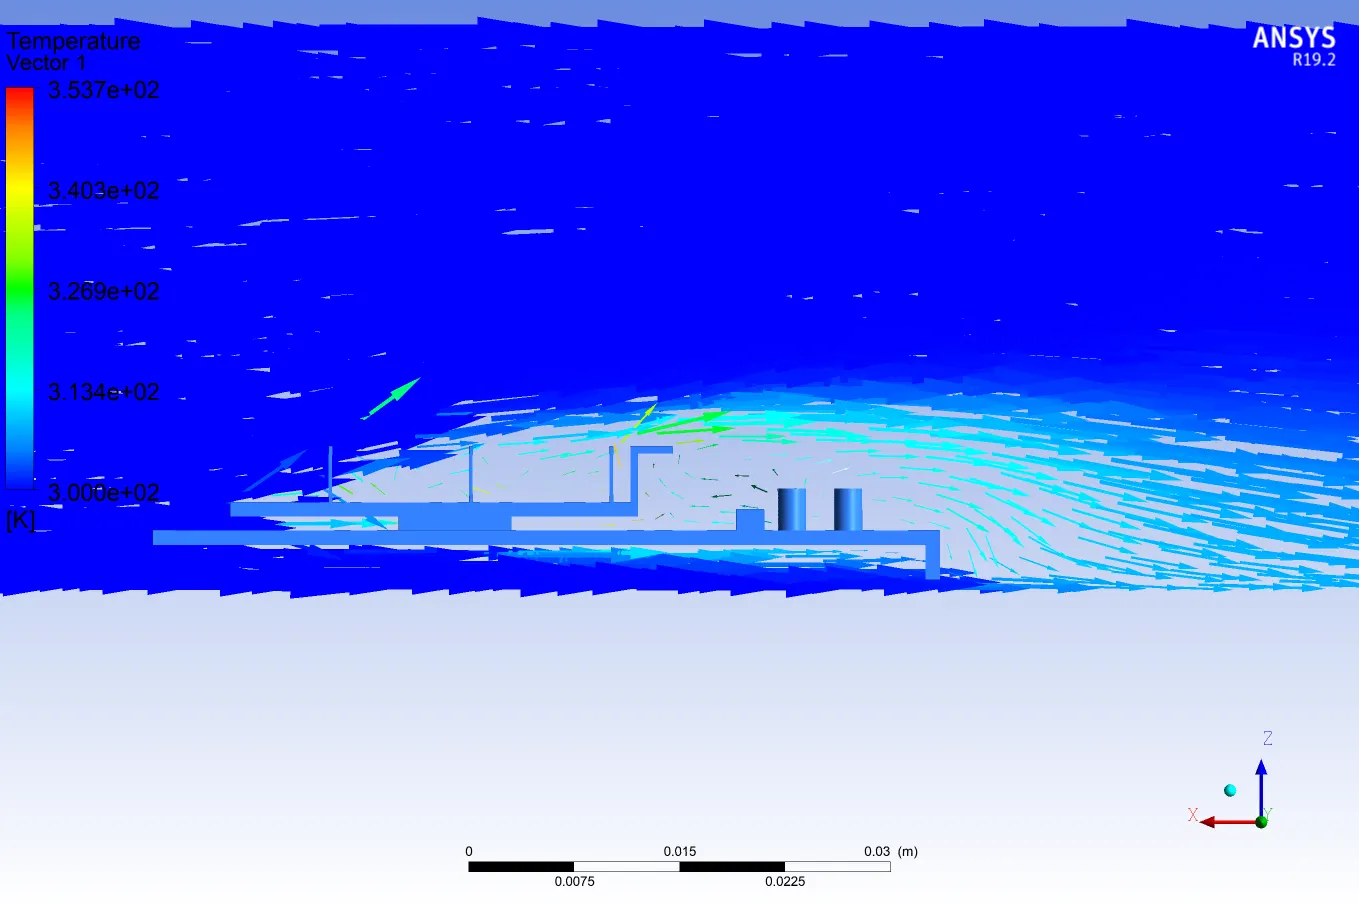
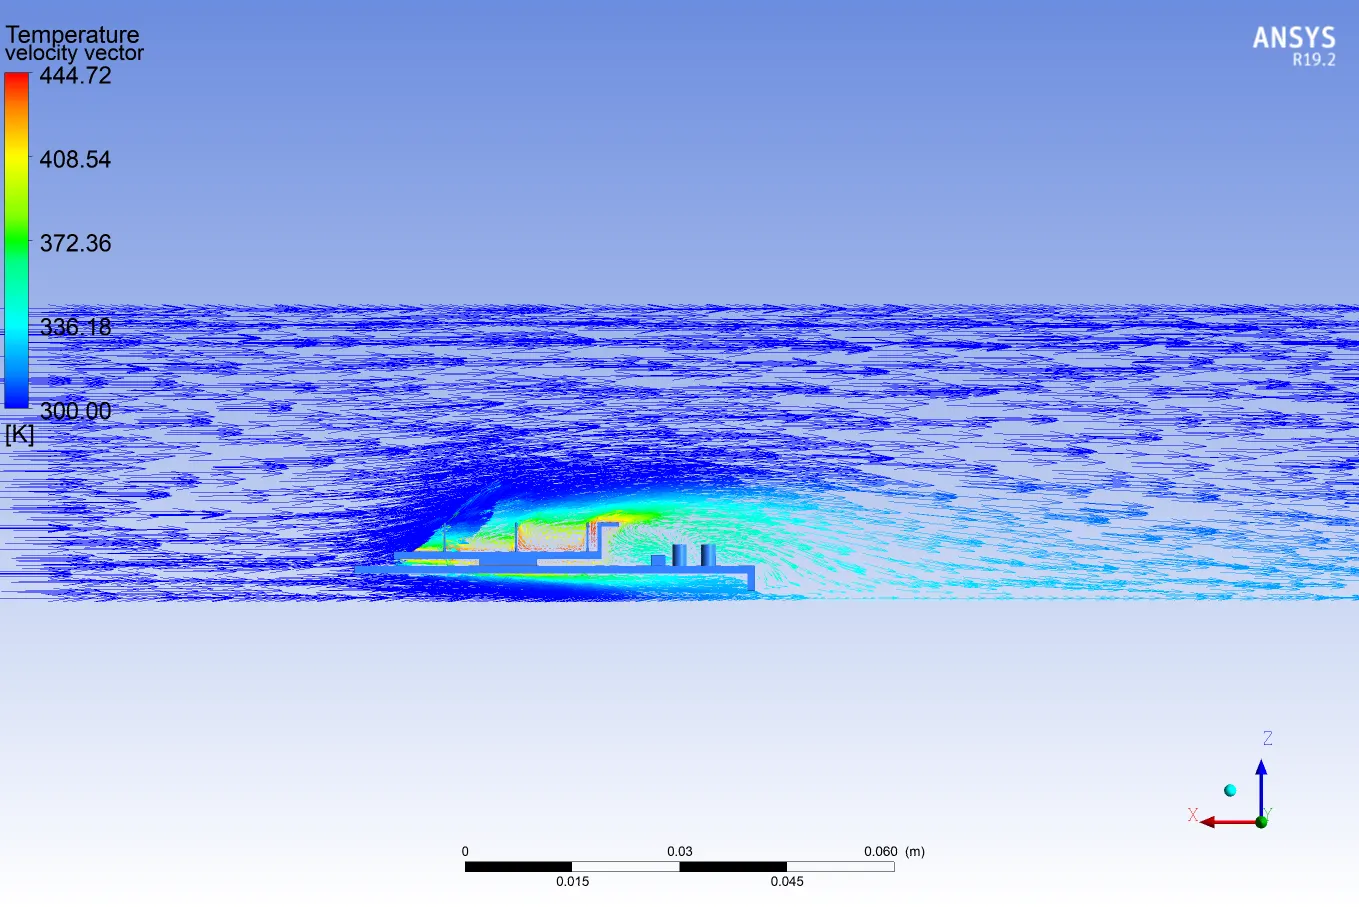
High-temperature zones can be seen in the contours which are shown above, this is because of the flow recirculation. Whenever flow recirculation takes place velocity tends to drop because of this convective heat transfer reduces.
Case 3:
Here the mesh is not changed and Simulation is run for two different velocities. The setup will remain the same.
1m/s 5m/s
|
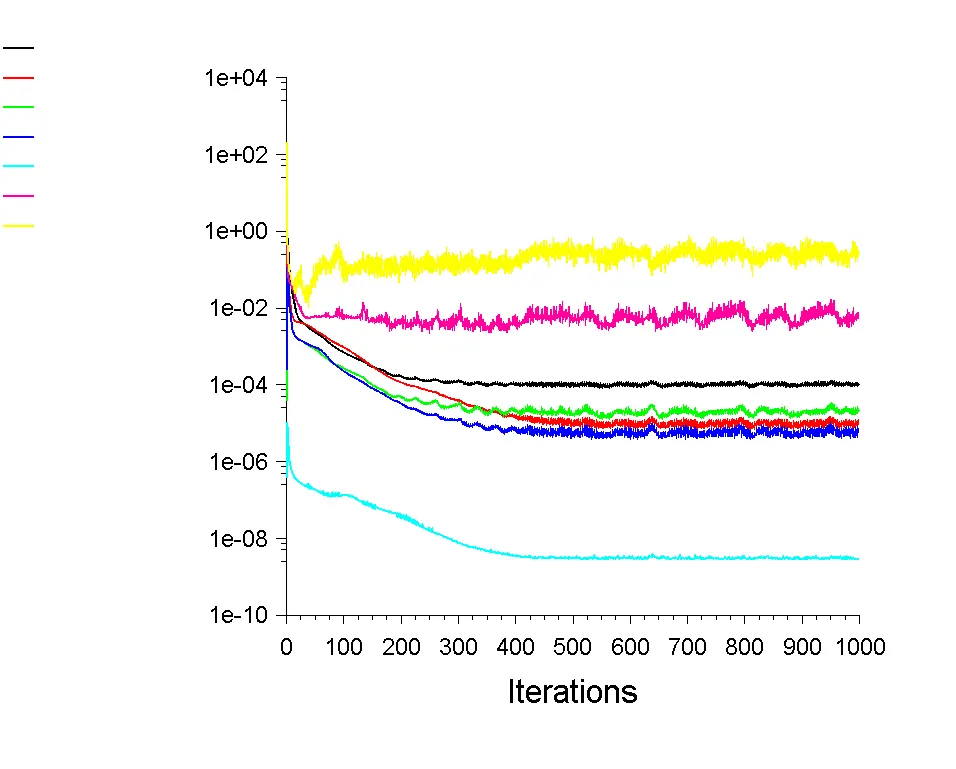
The solution has converged at around 500 iterations. |
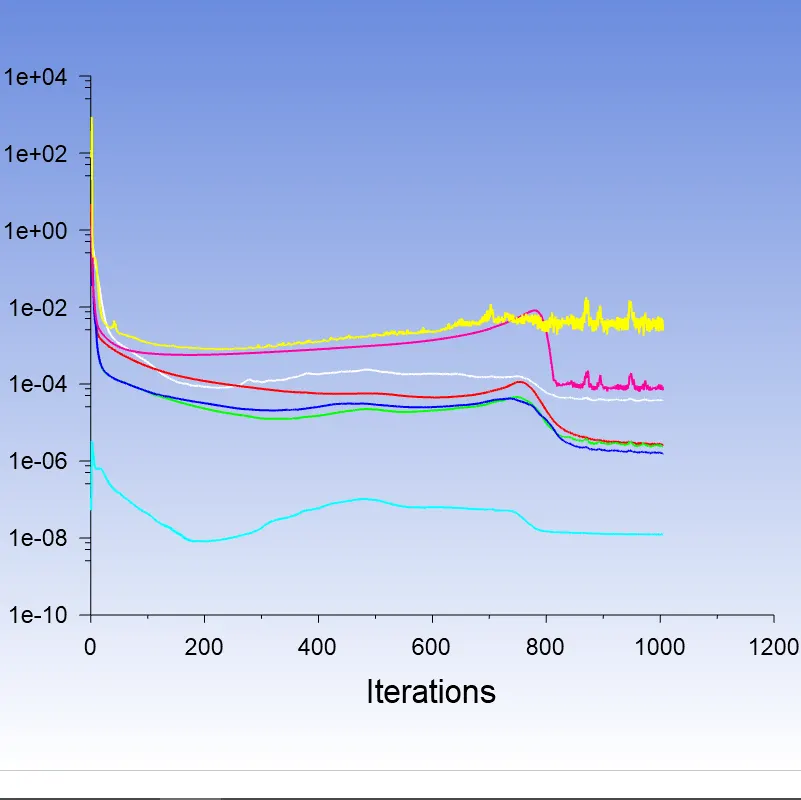
Residual plot |
The solution has converged at around 850 iterations. |
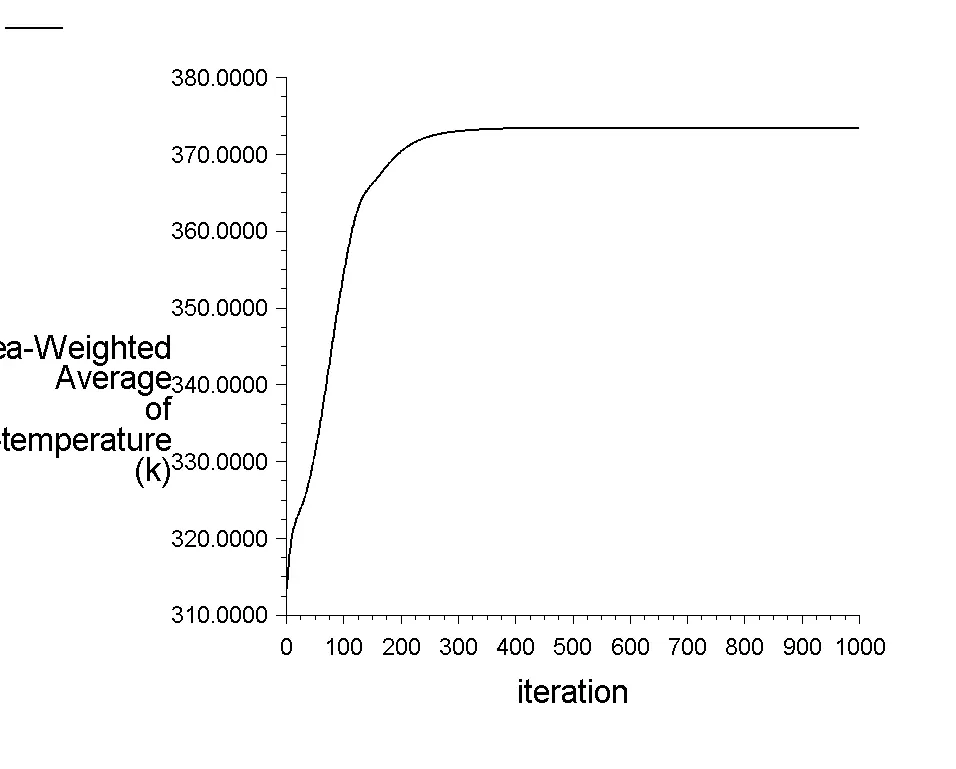 |
Temperature plot | 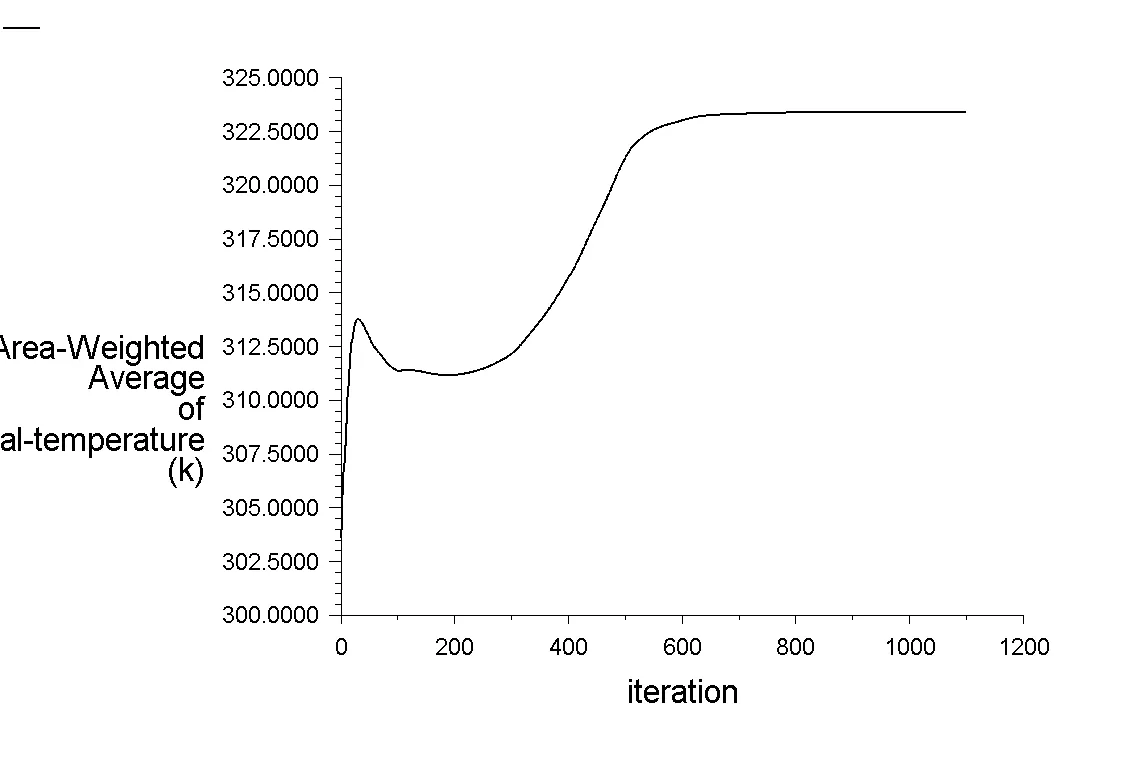 |
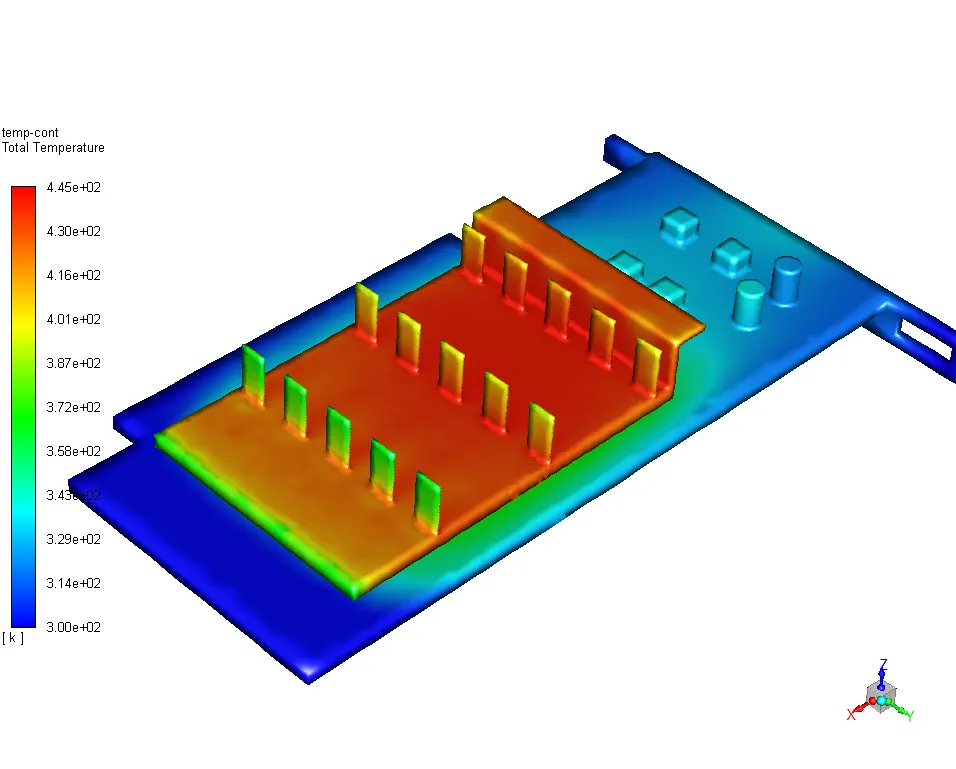 |
Temperature Distribution on GPU | 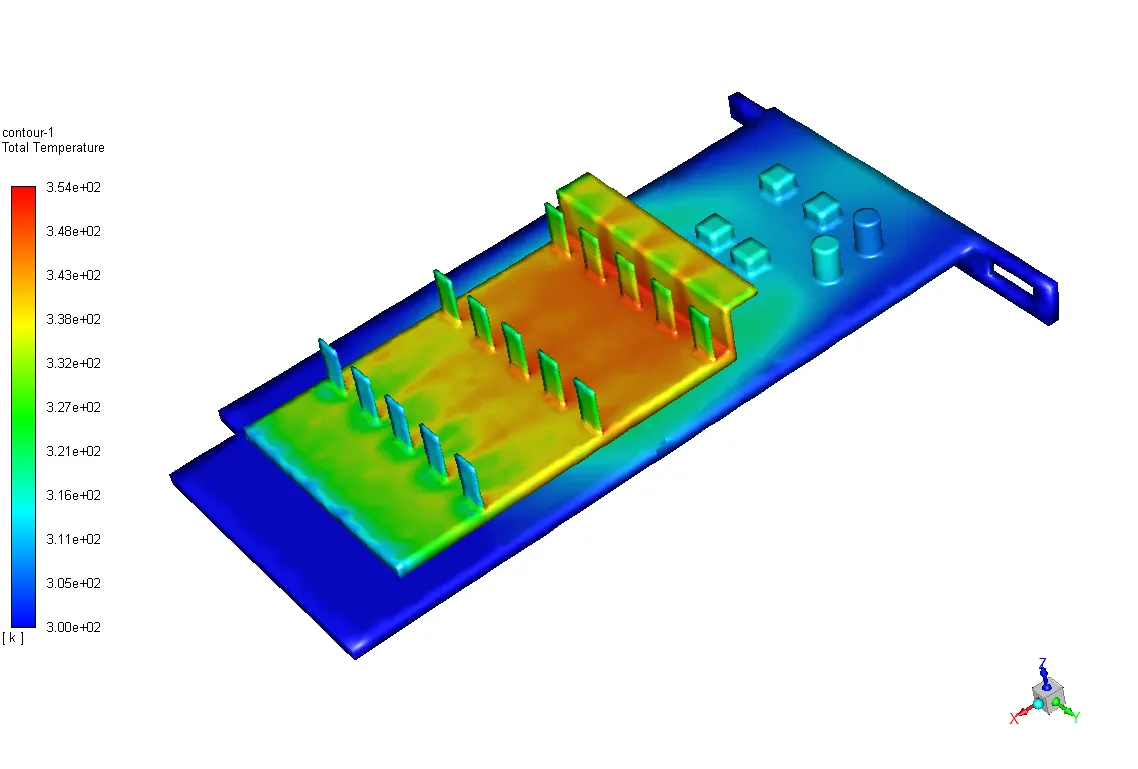 |
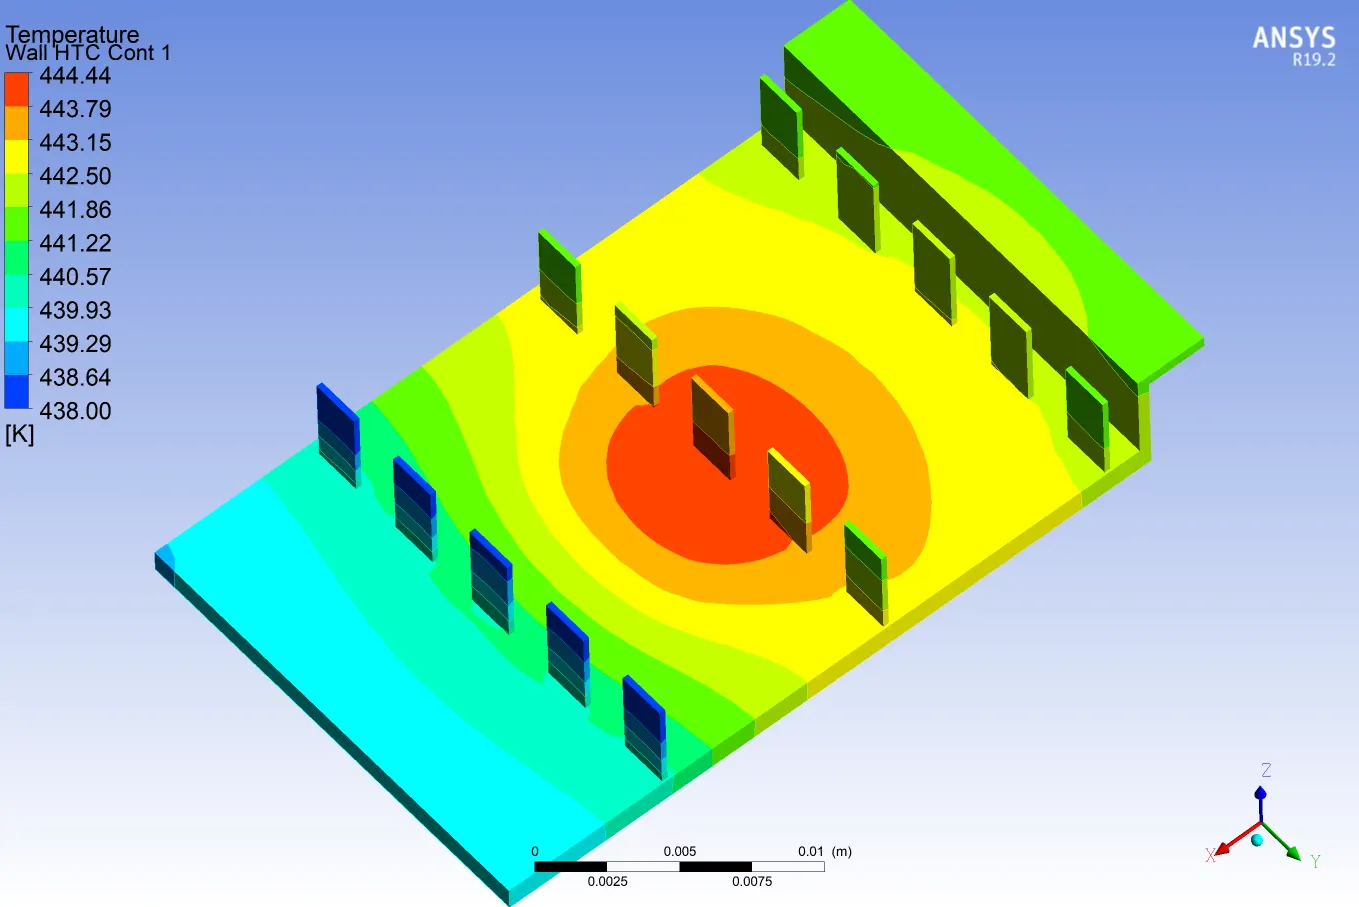 |
Temperature distribution on Fins | 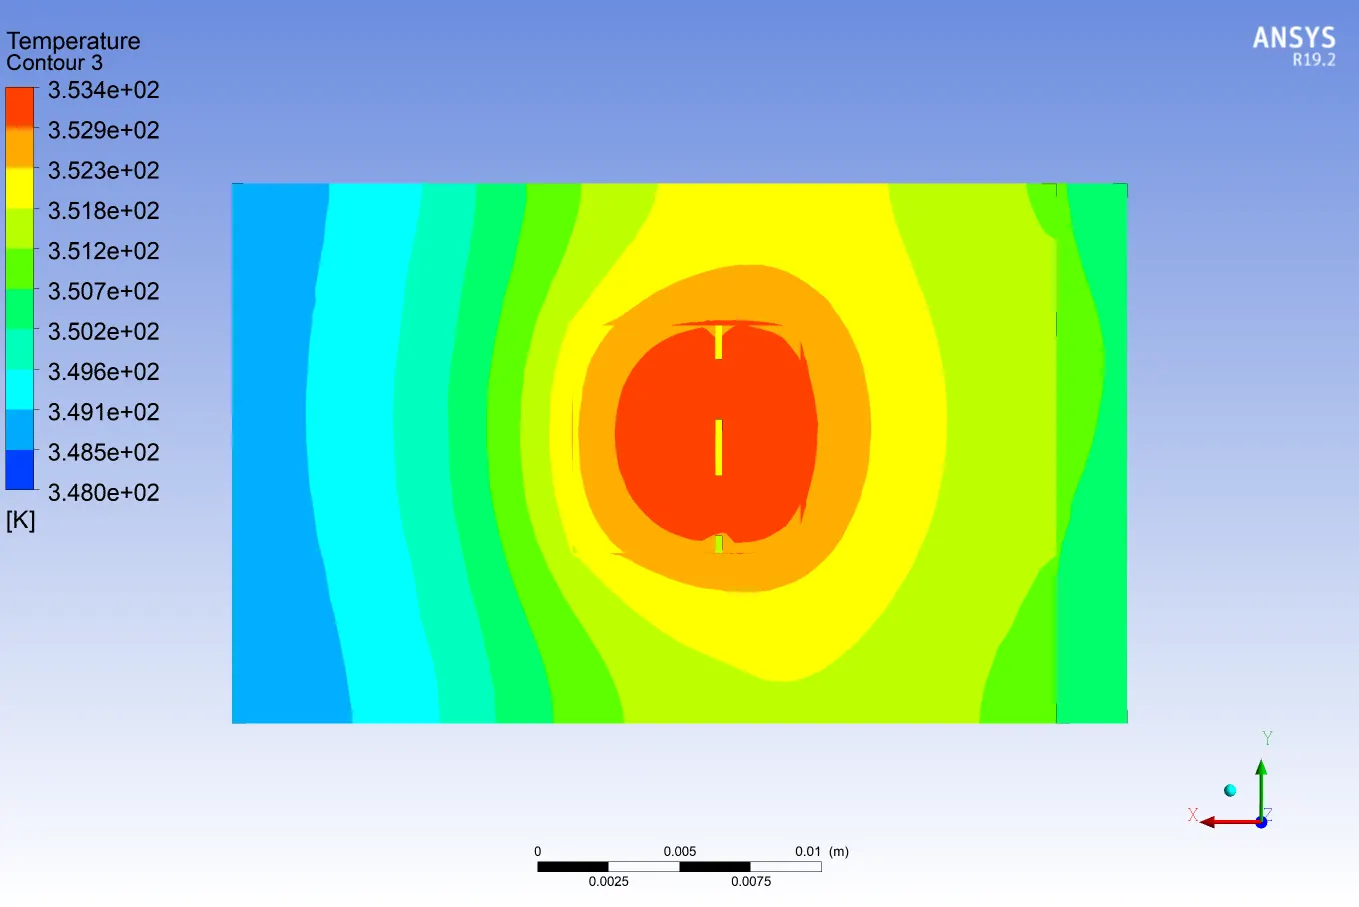 |
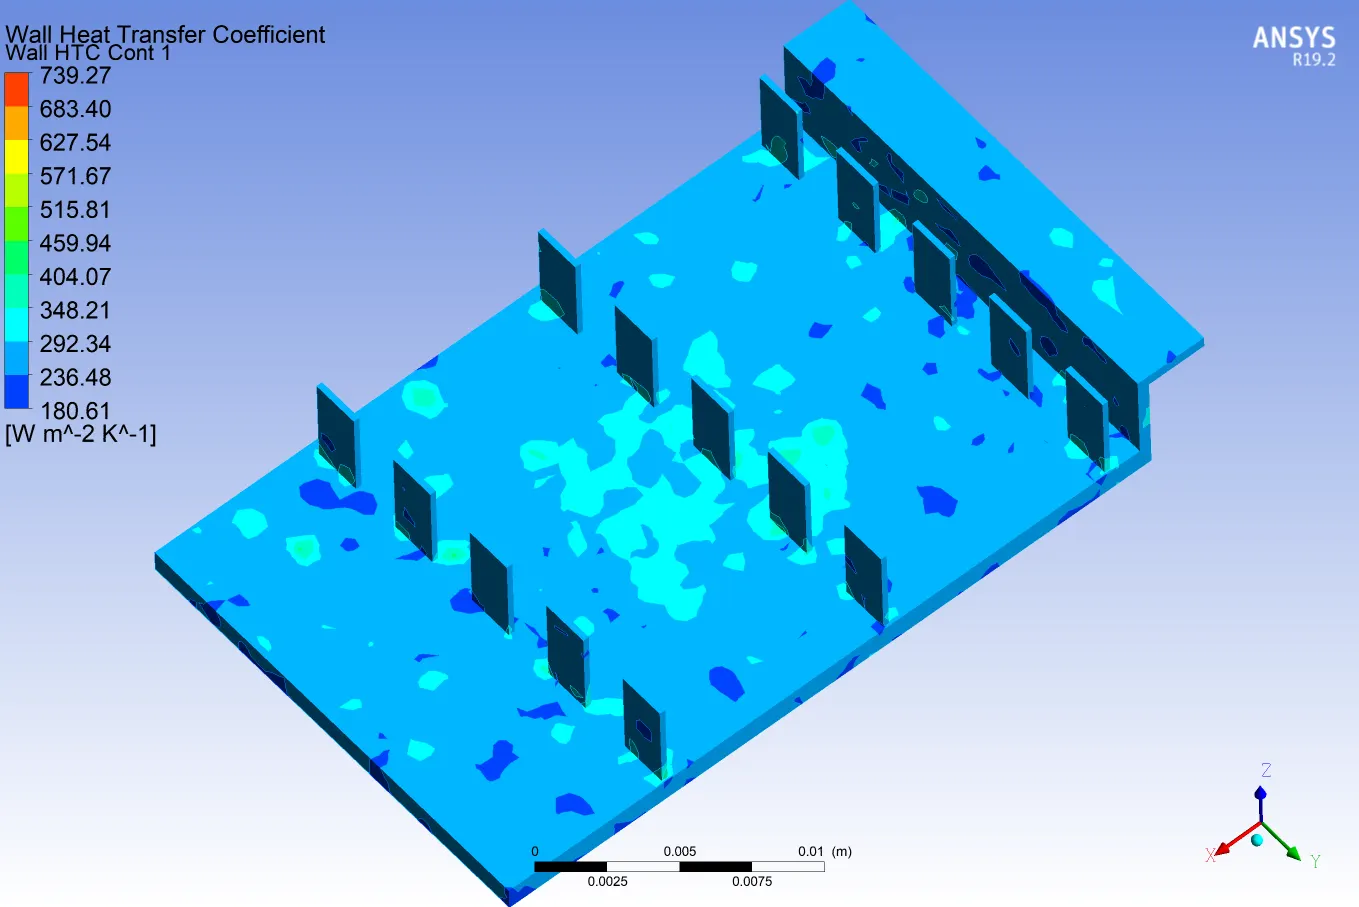 |
Wall HTC contour on Fins | 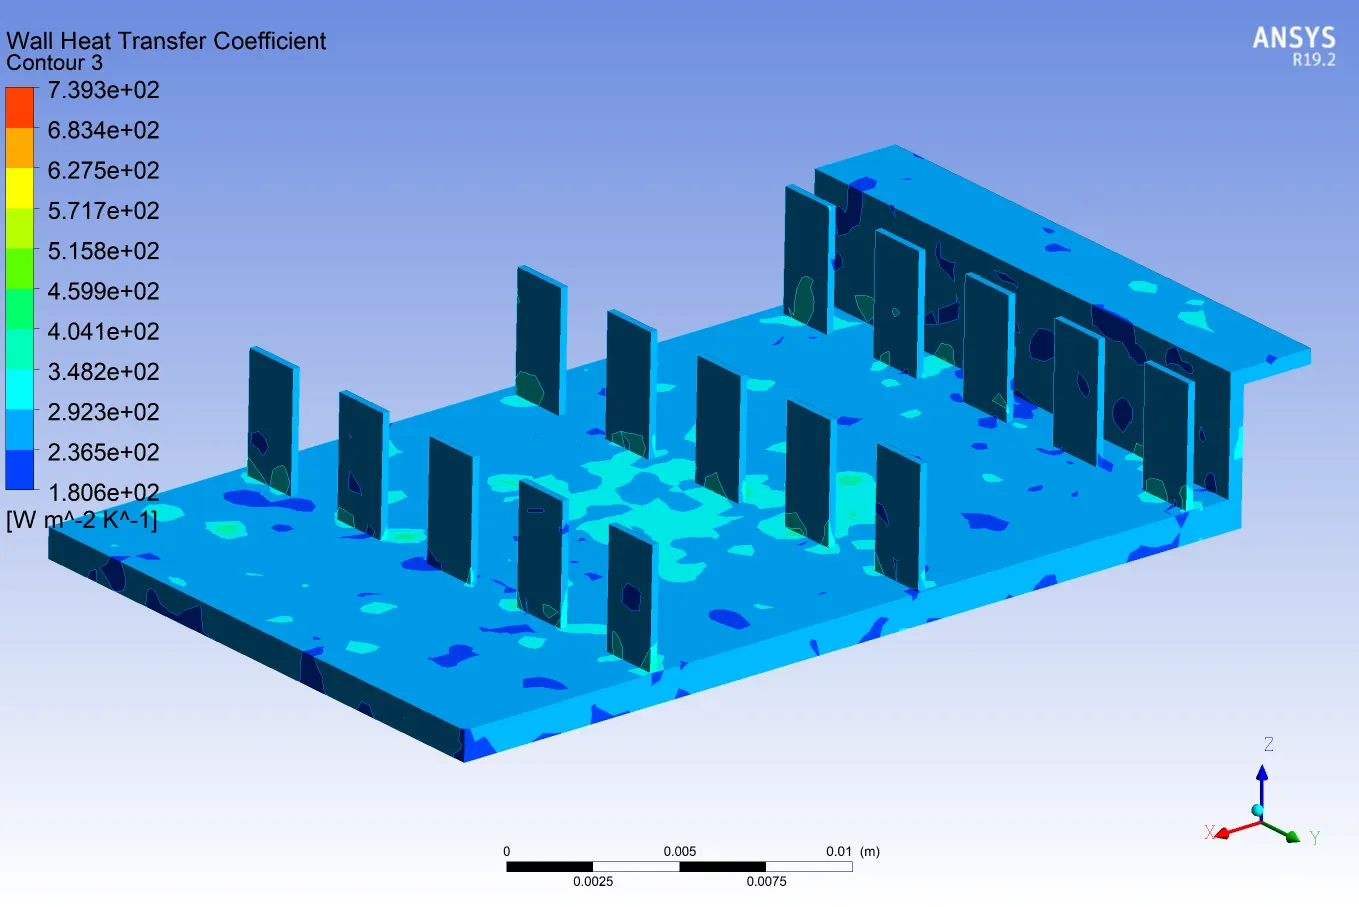 |
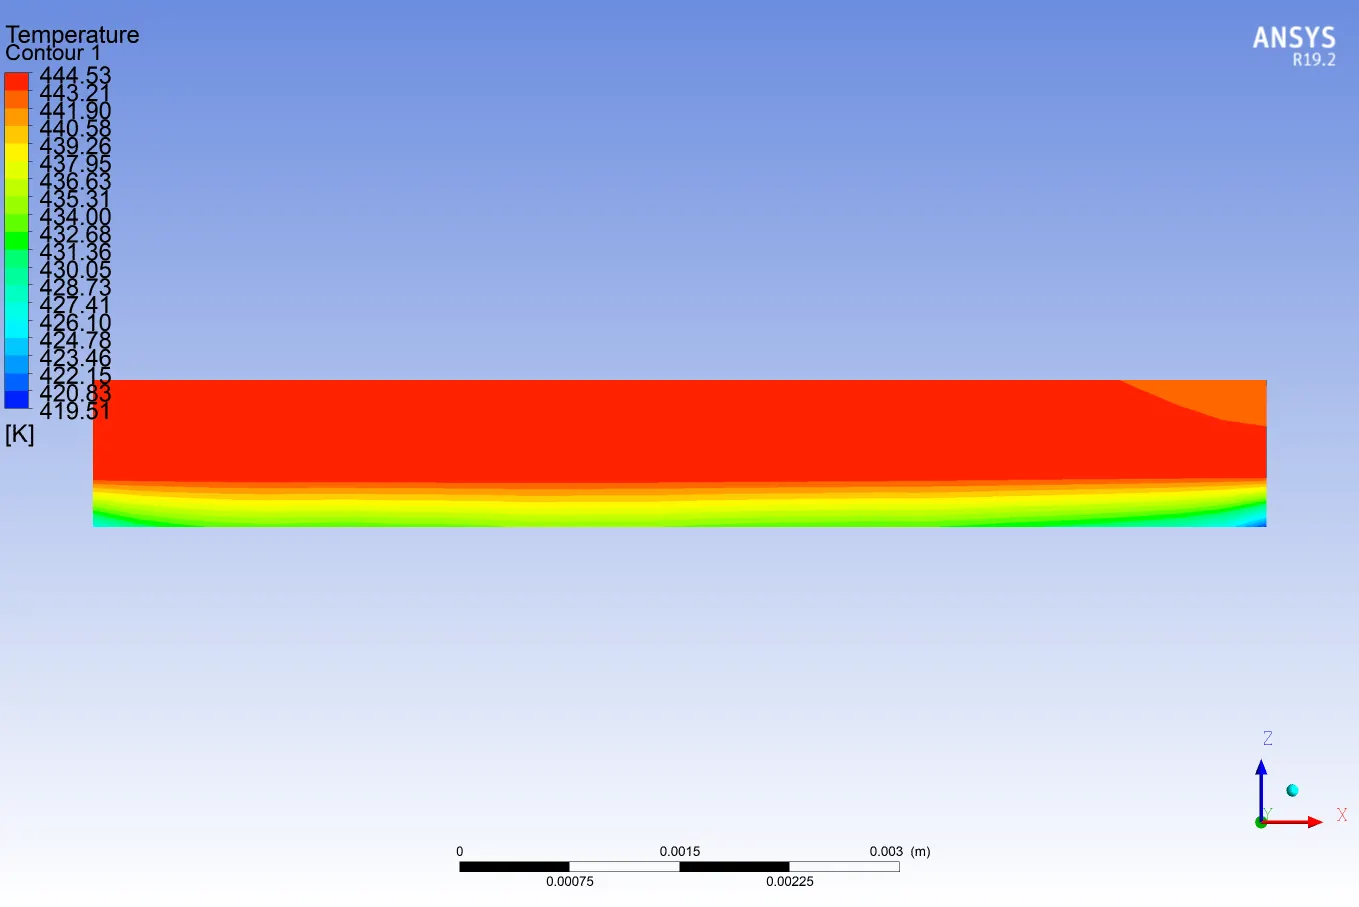 |
Temperature distribution on Processor | 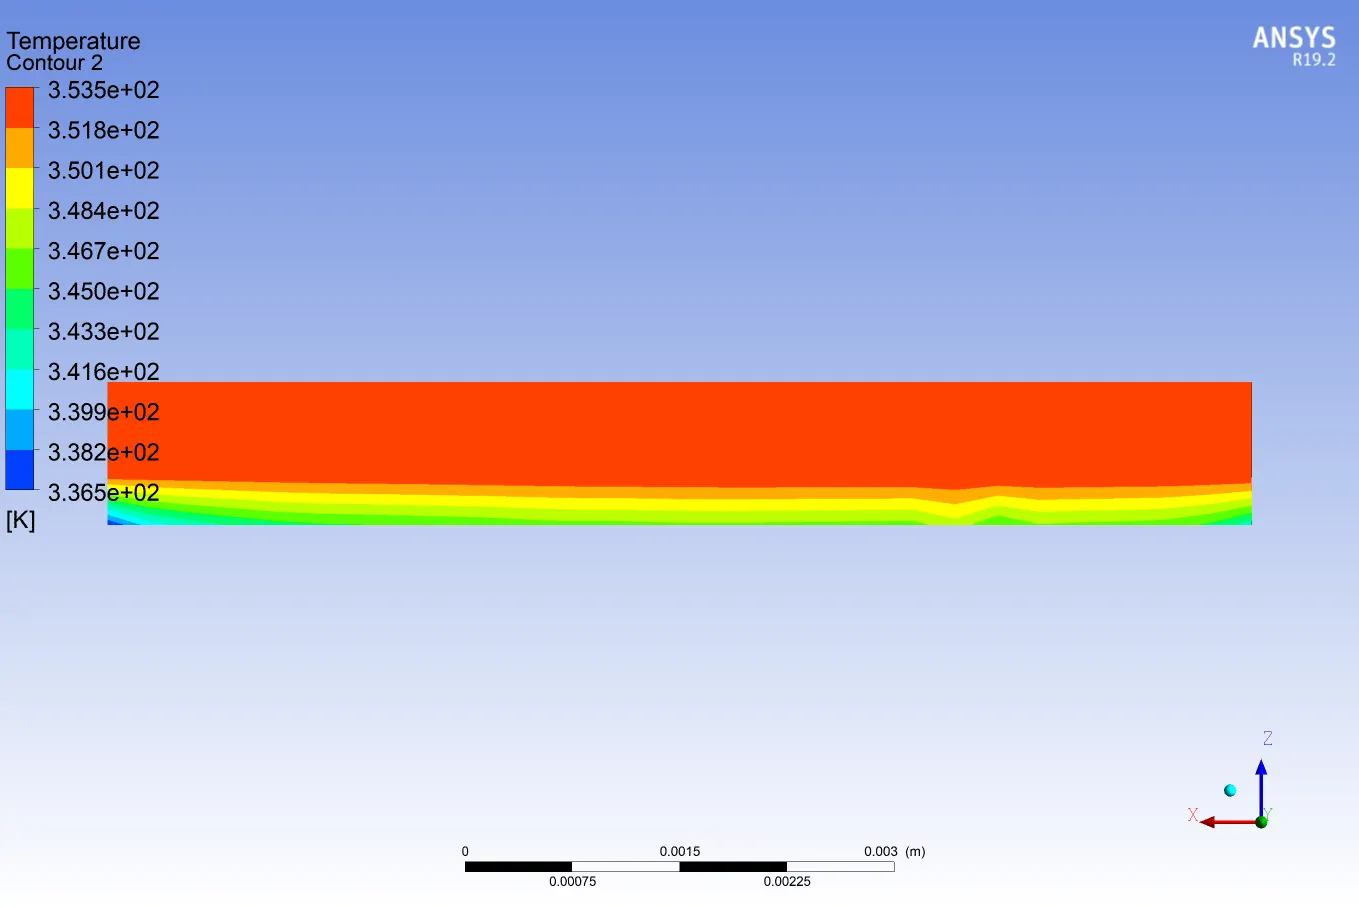 |
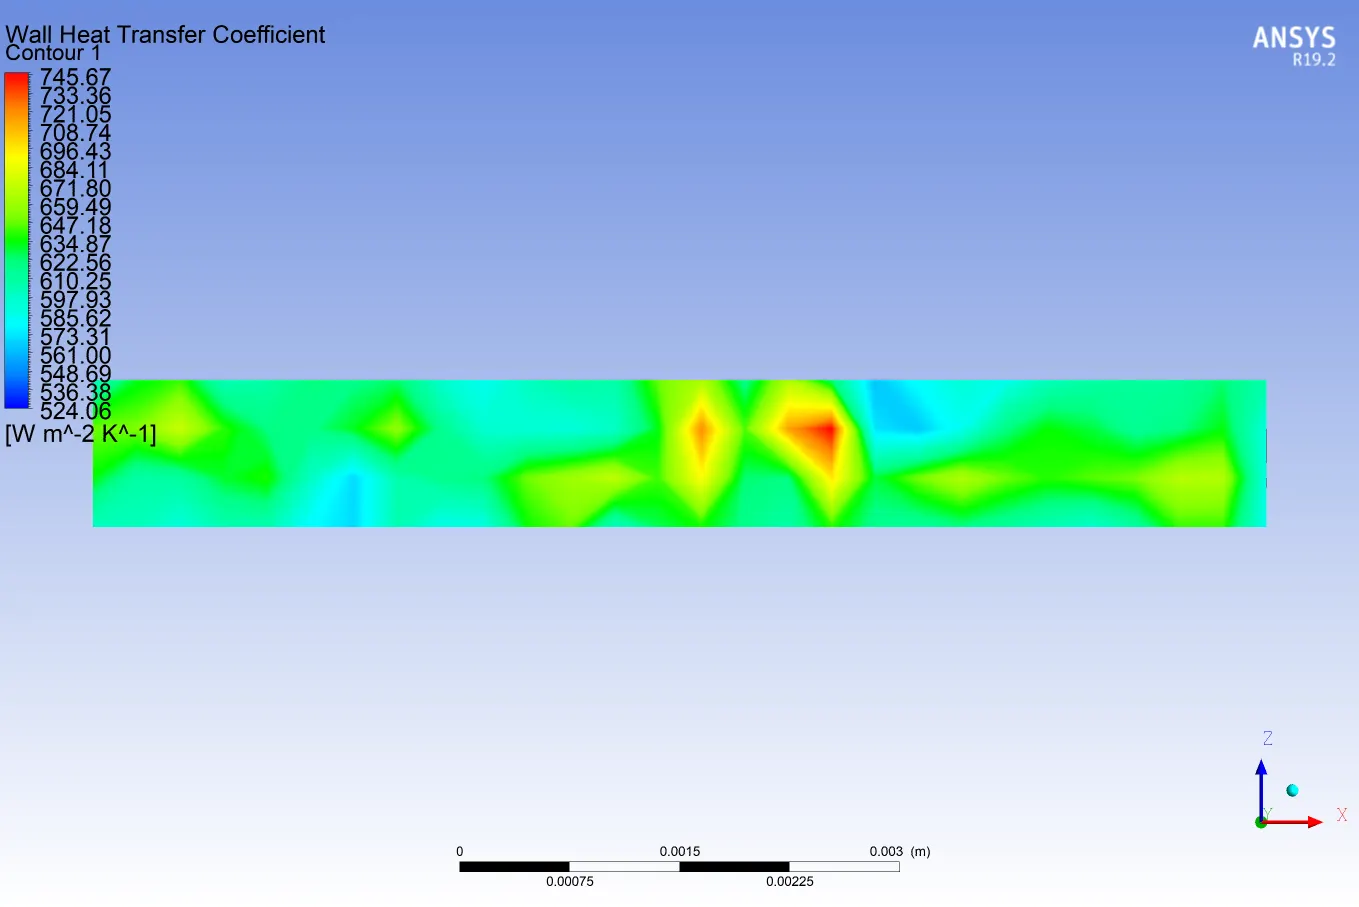 |
Wall HTC contour on Processor | 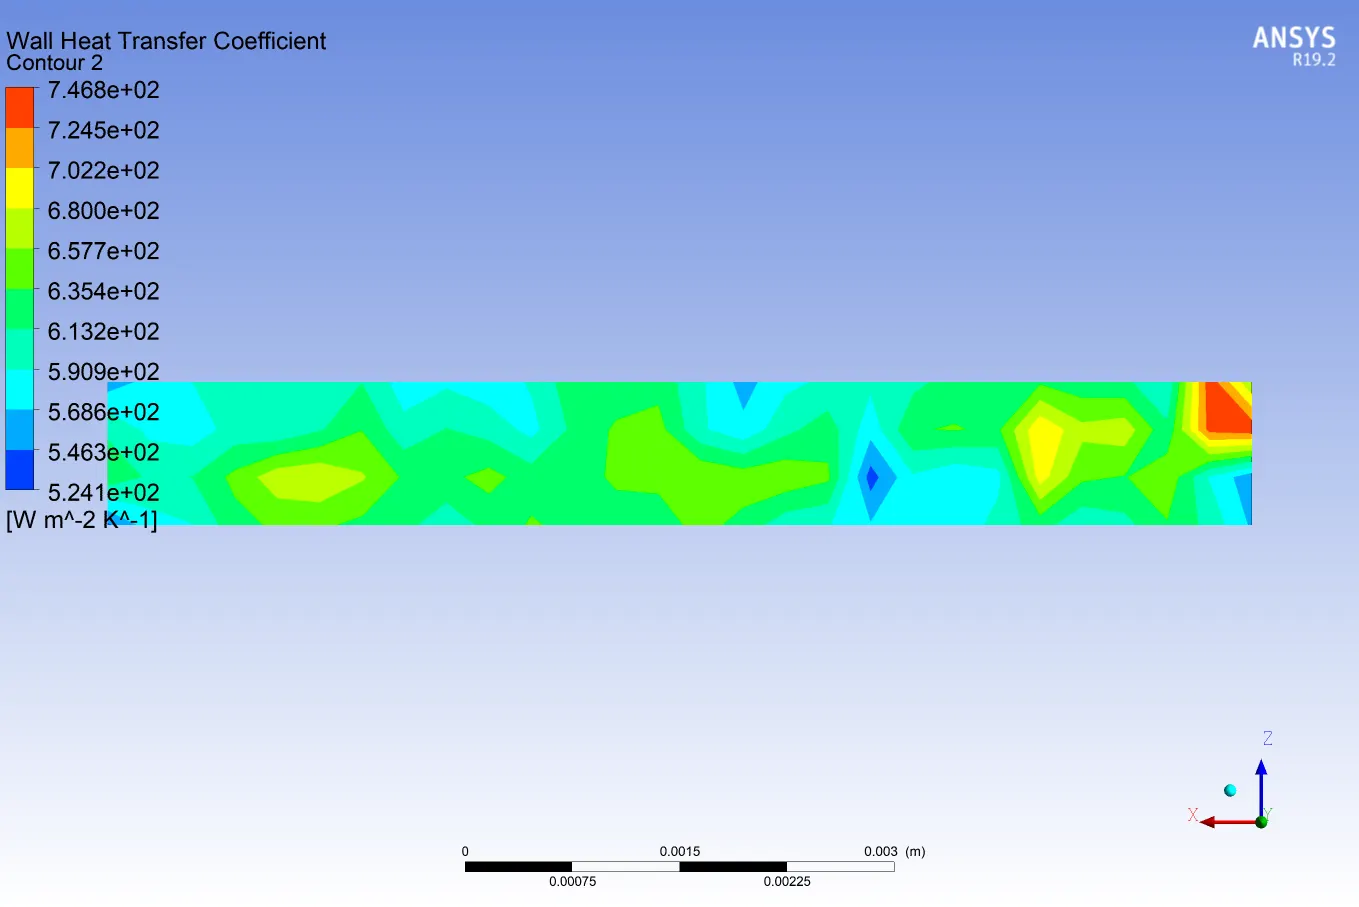 |
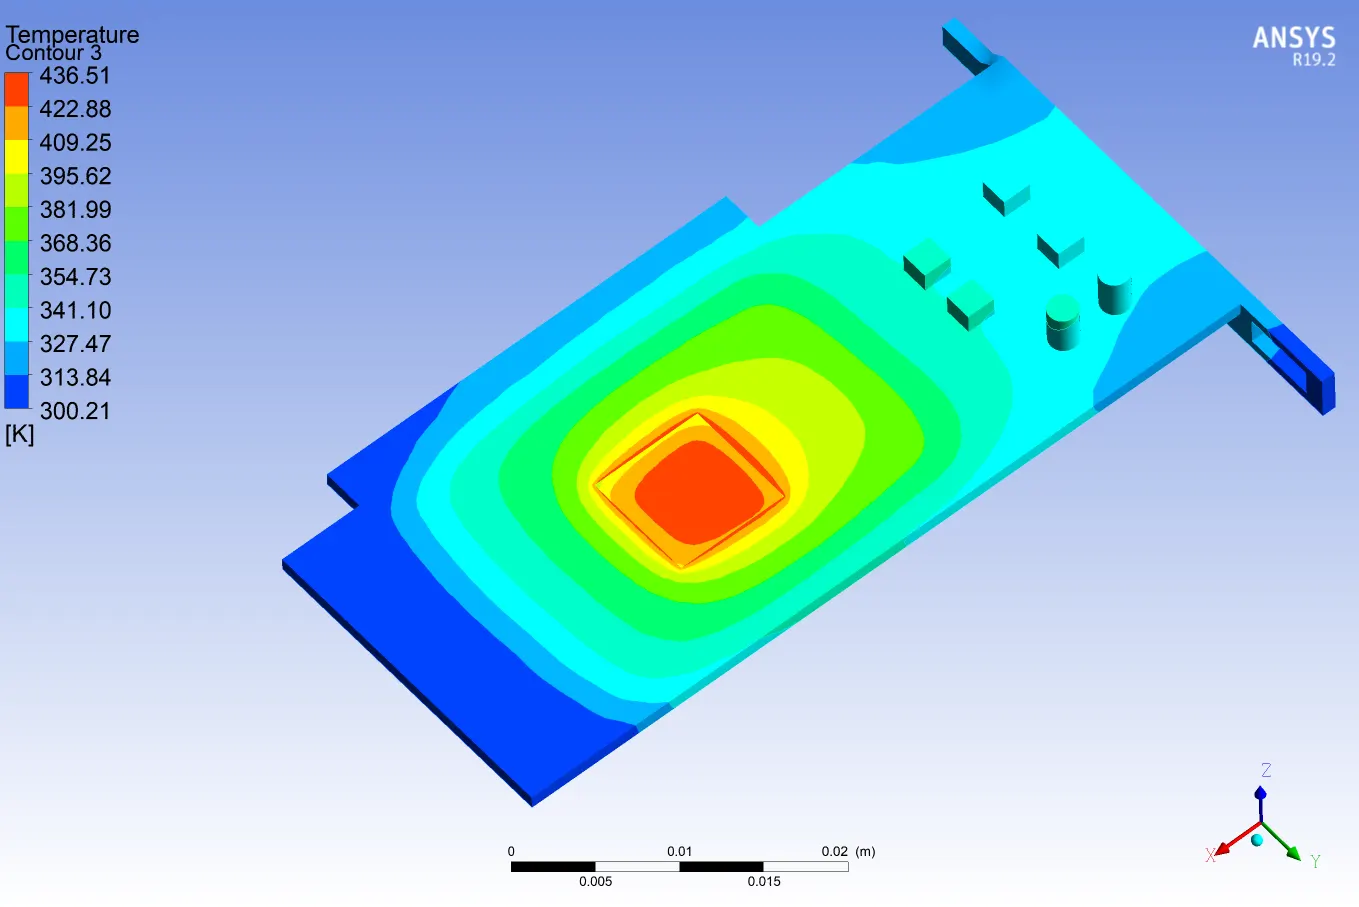 |
Temperature distribution on Base Circuit Board |
|
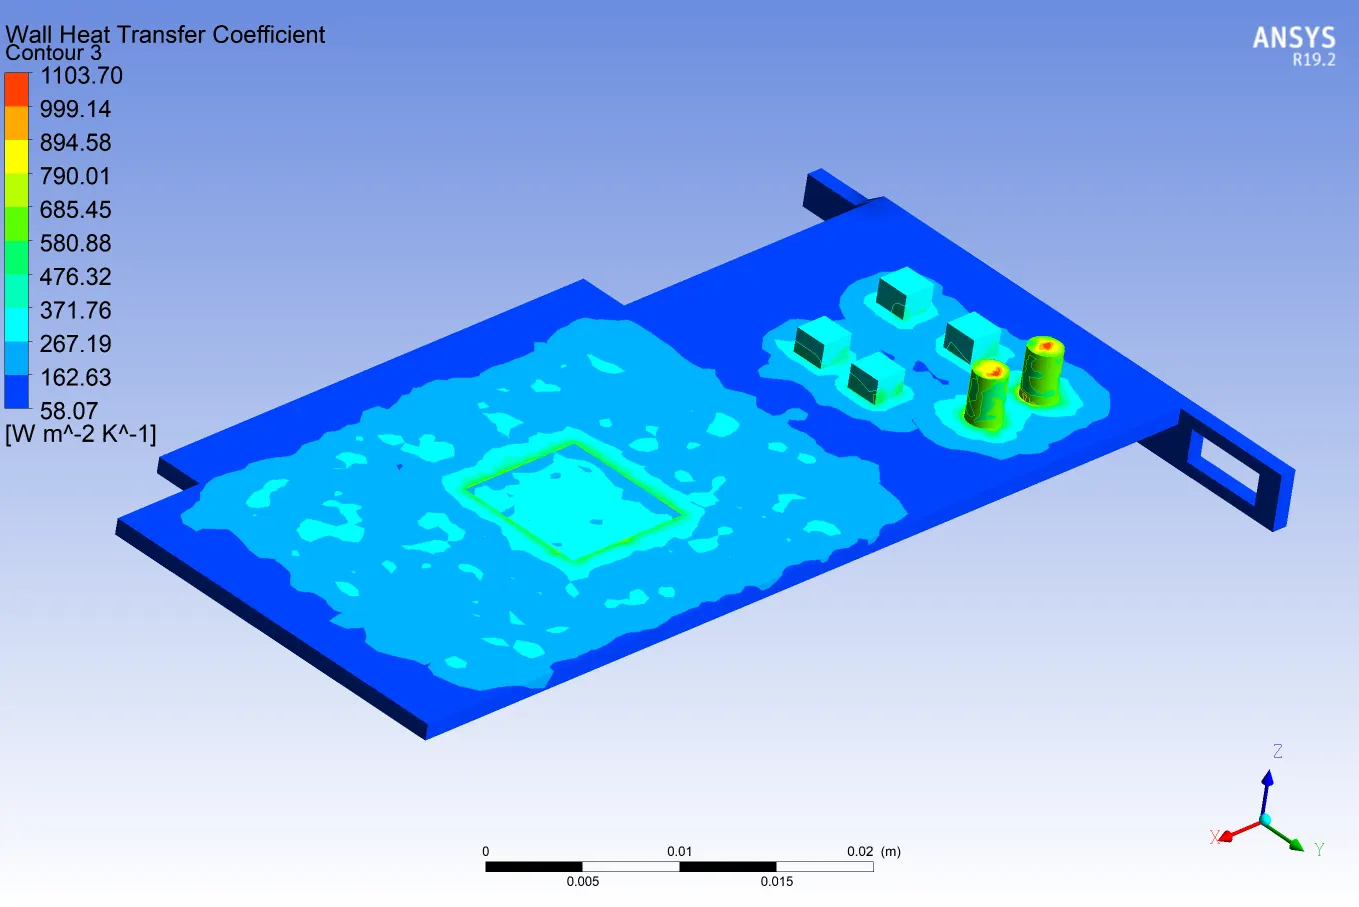 |
Wall HTC contour on Base Circuit Board |
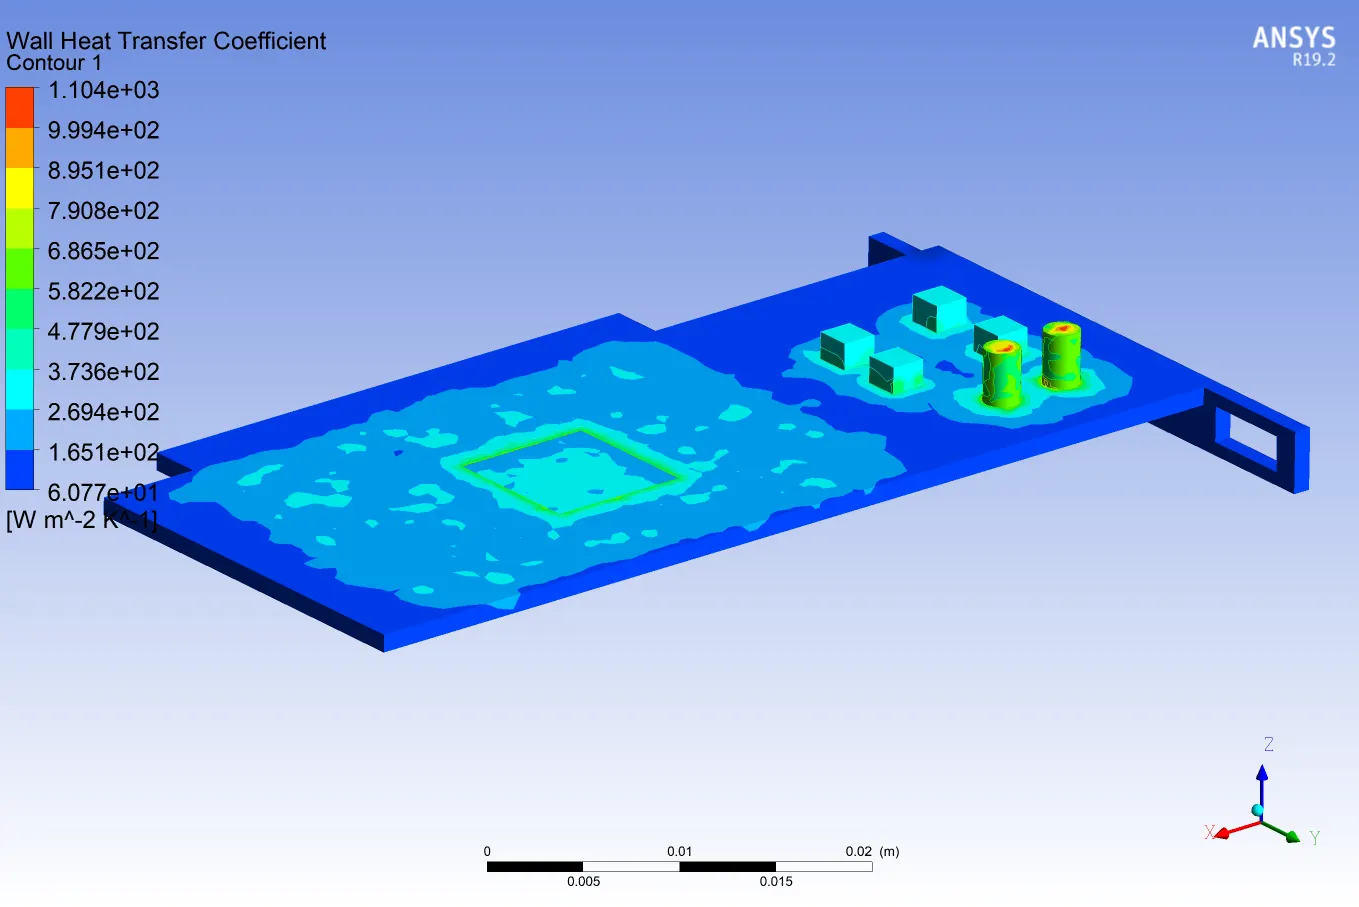 |
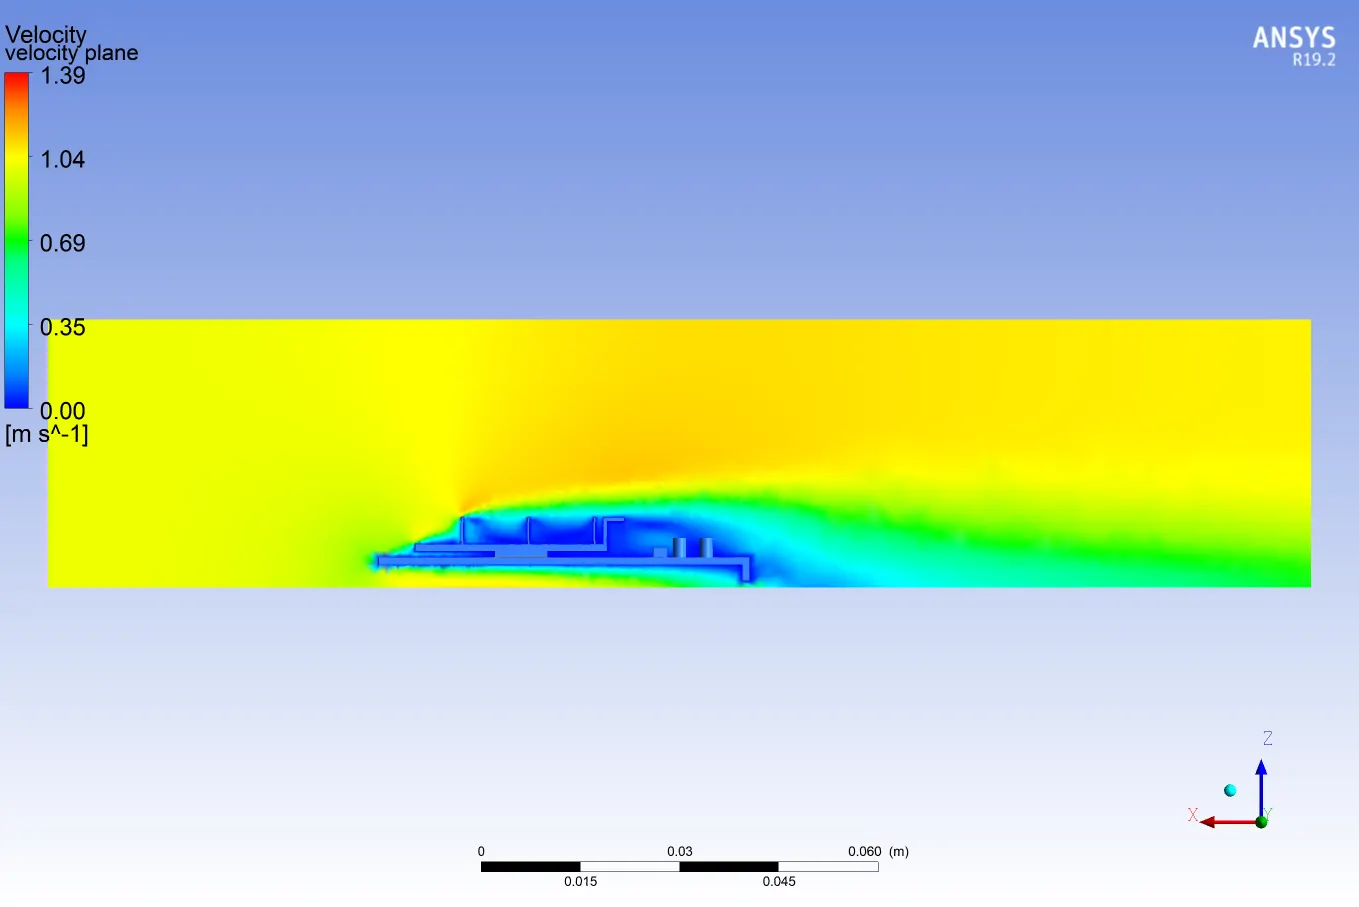 |
Velocity contour on cut plane | 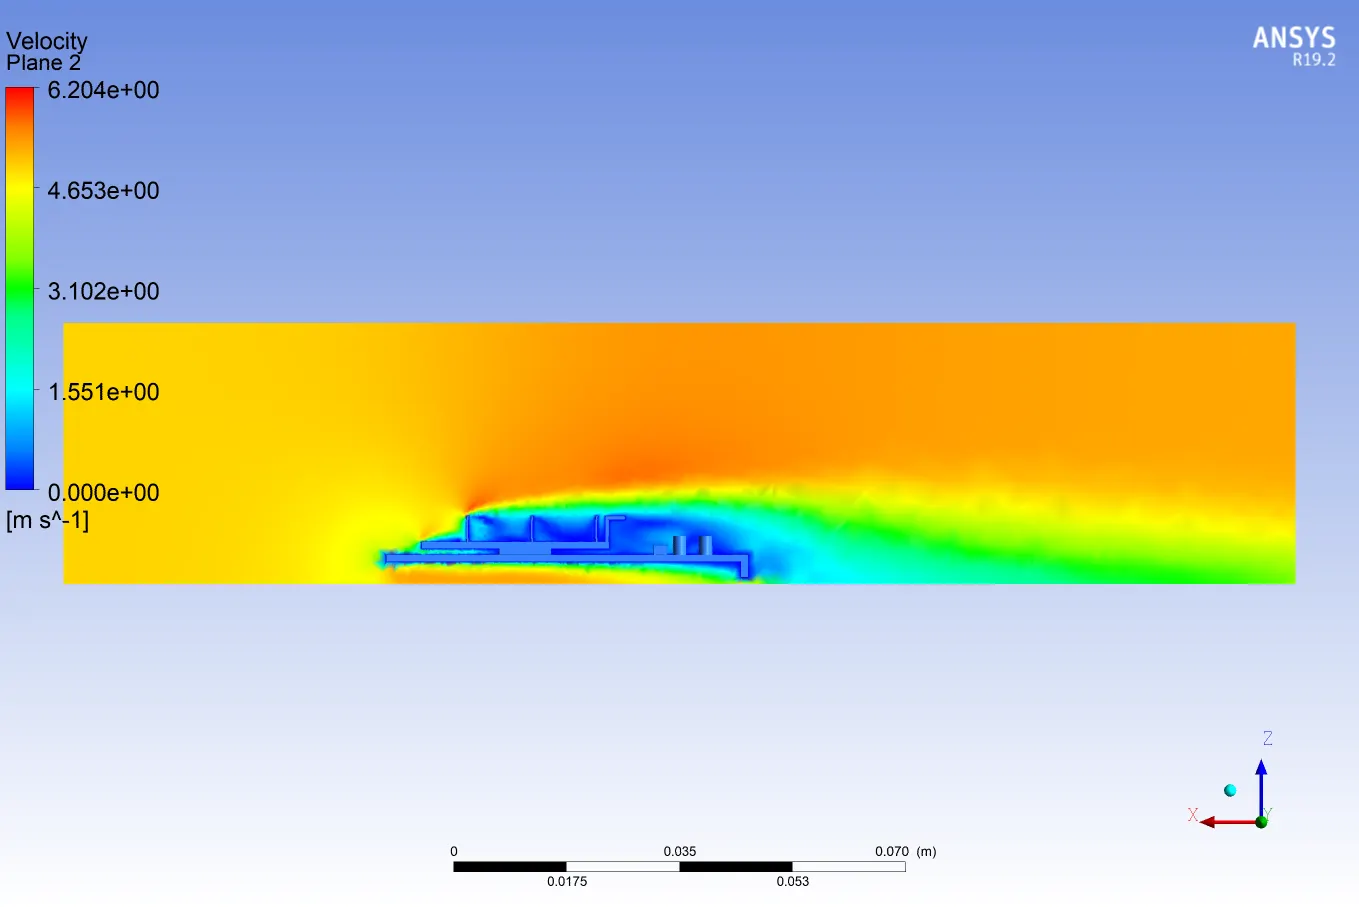 |
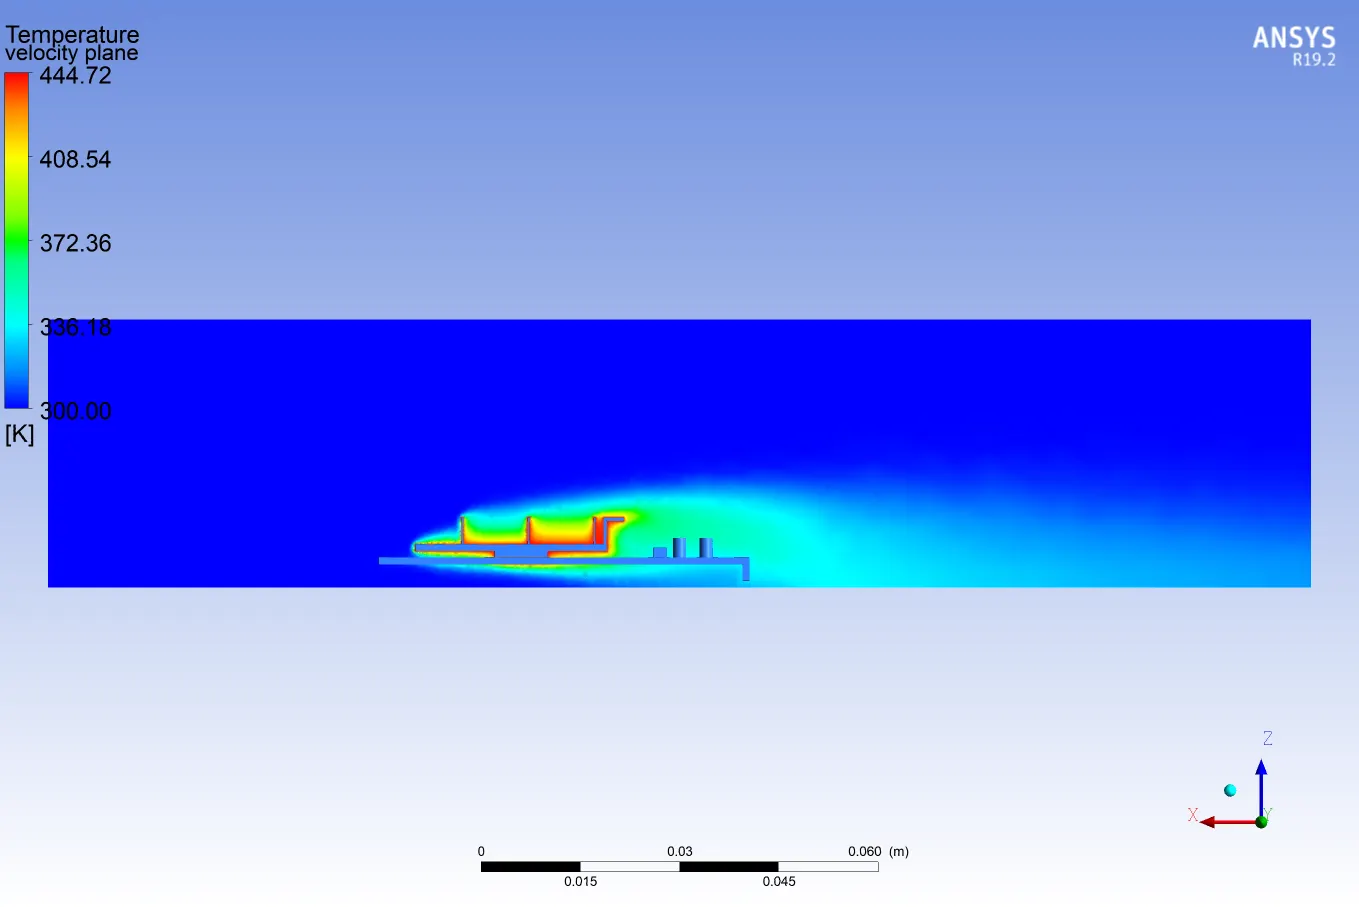 |
Temperature Contour on Cut plane | 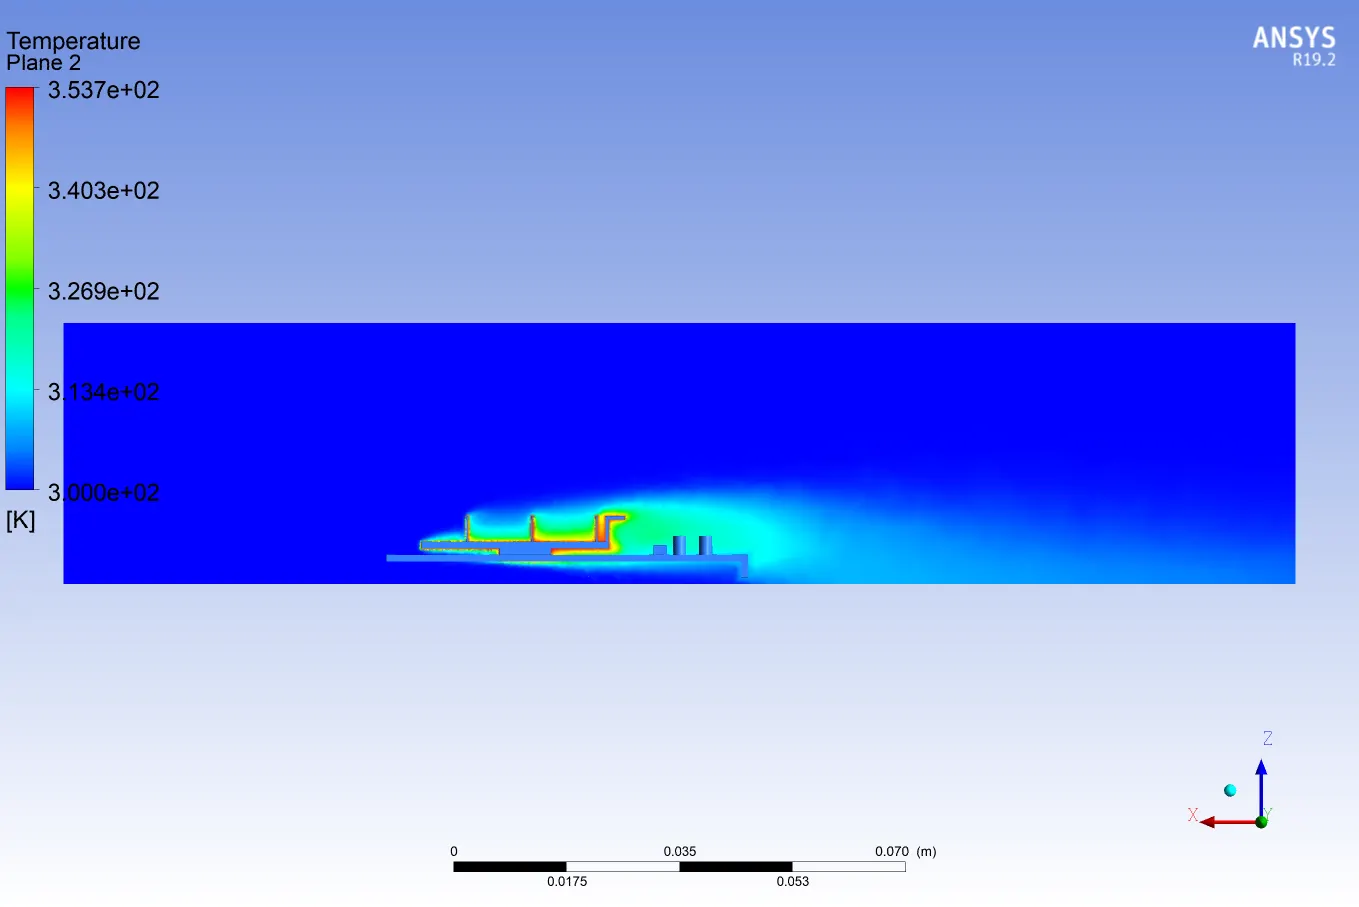 |
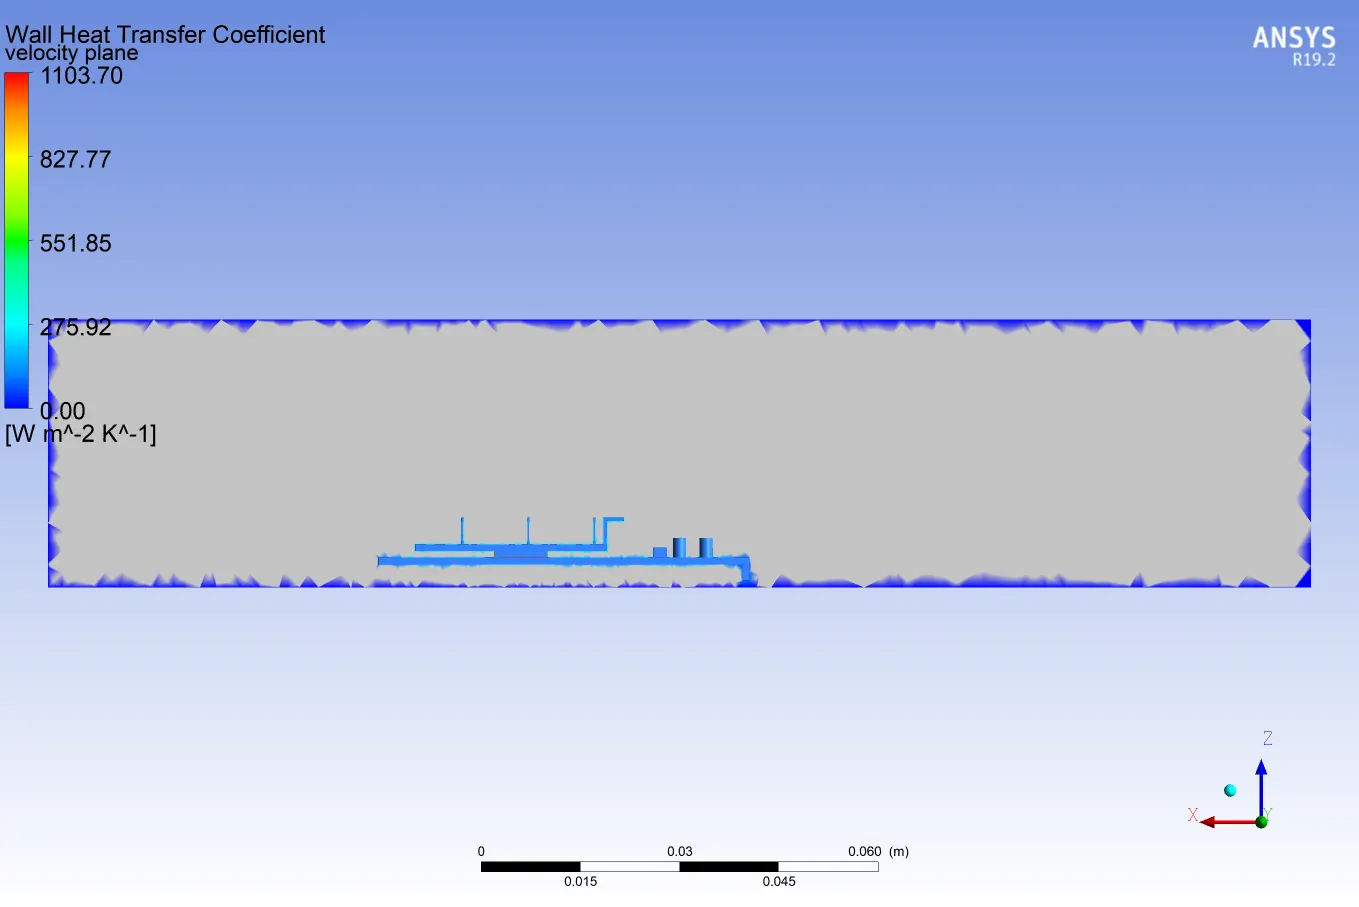 |
Wall HTC contour plot on Cut plane | 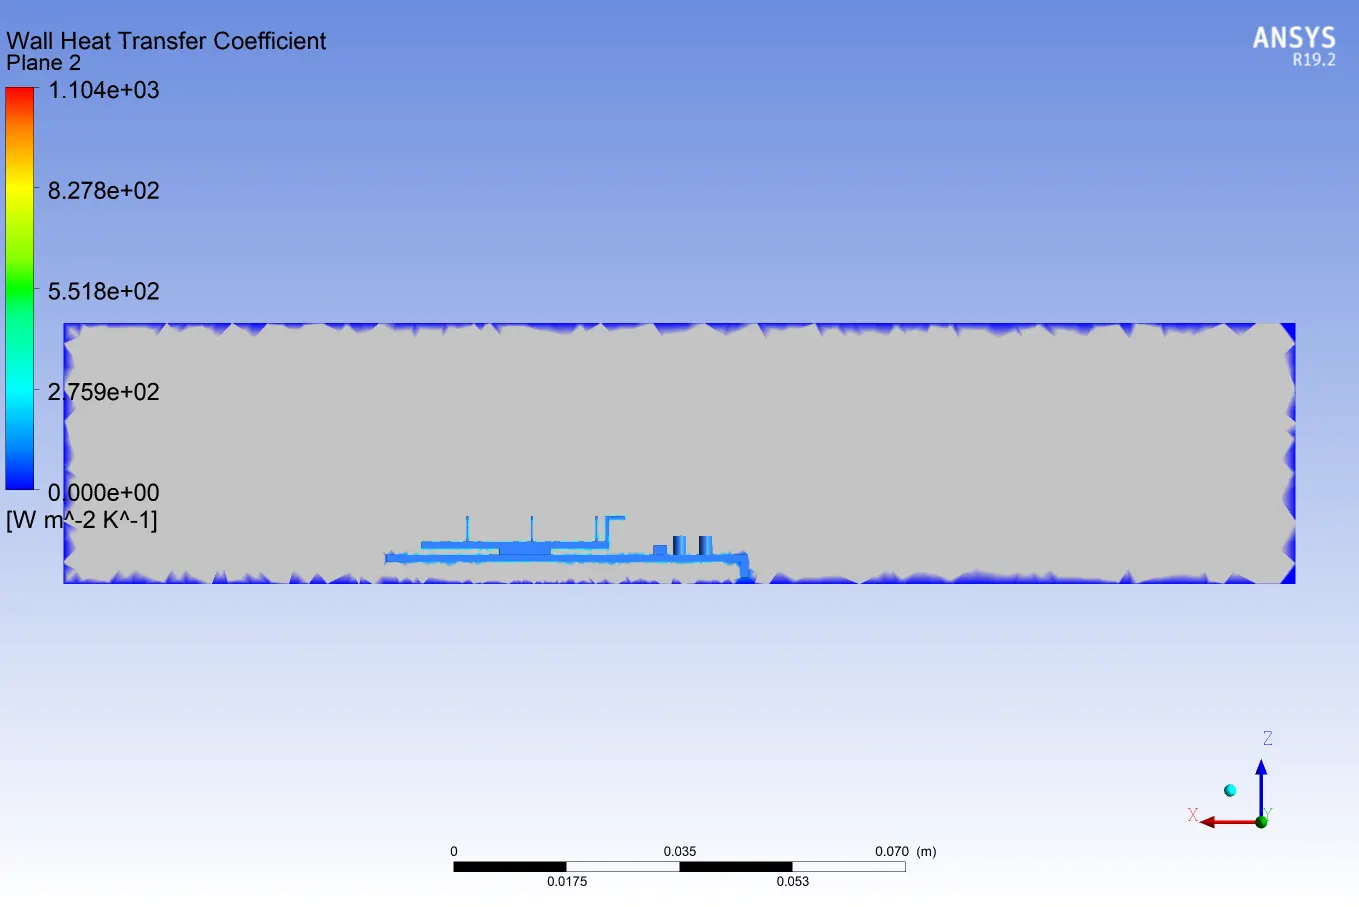 |
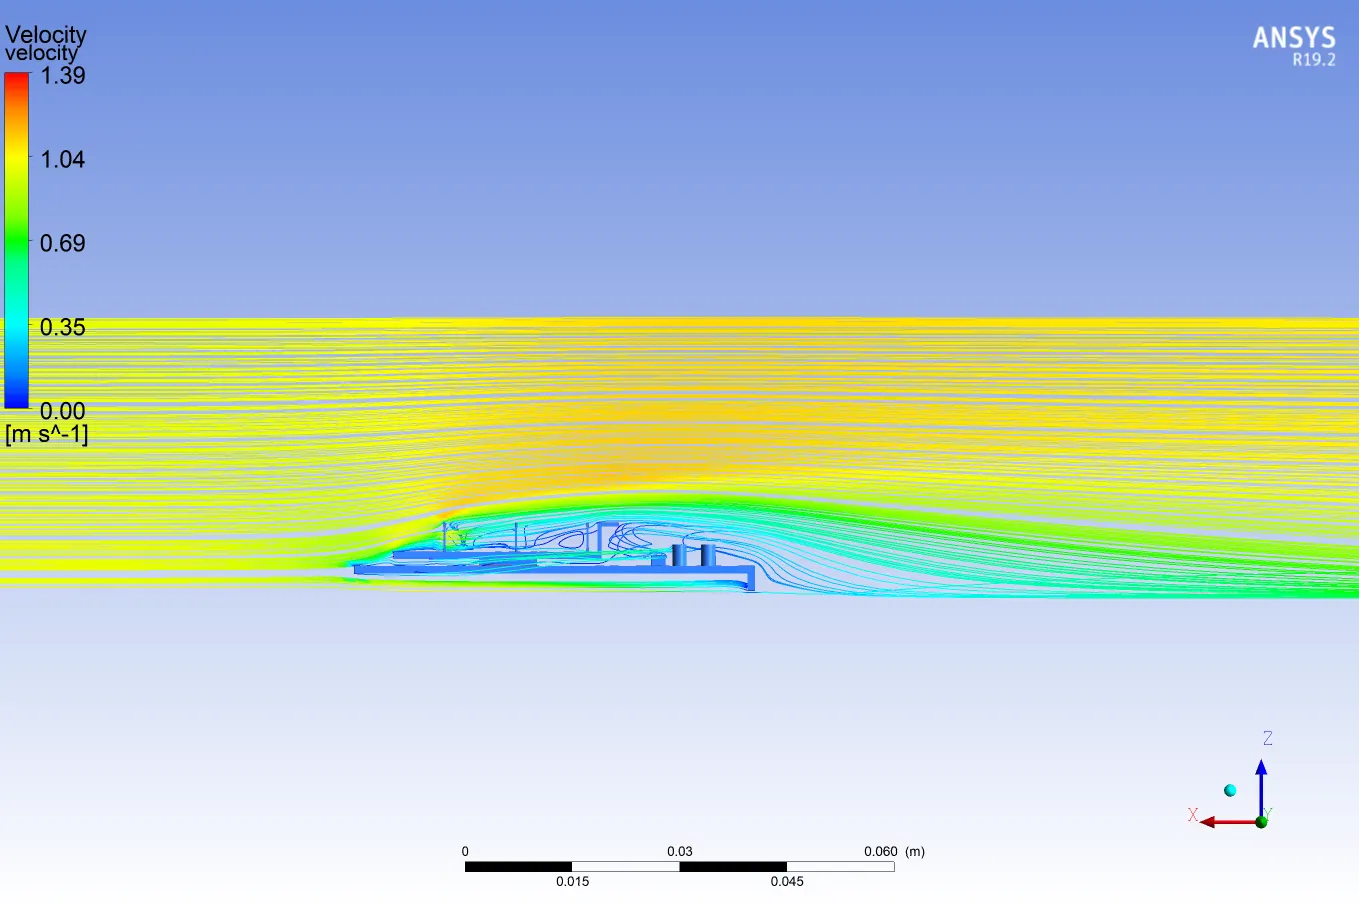 |
Velocity Streamlines | 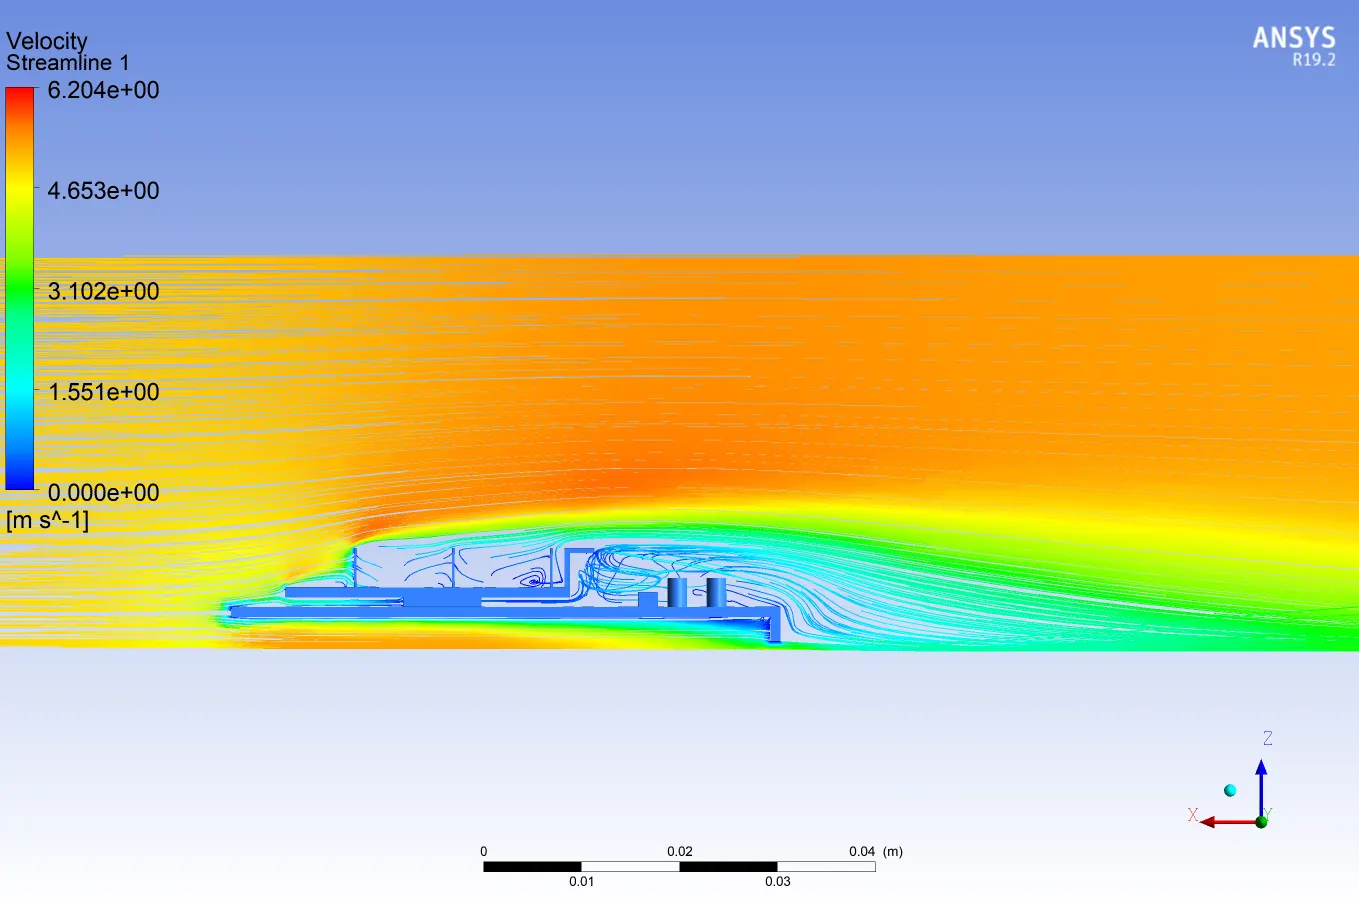 |
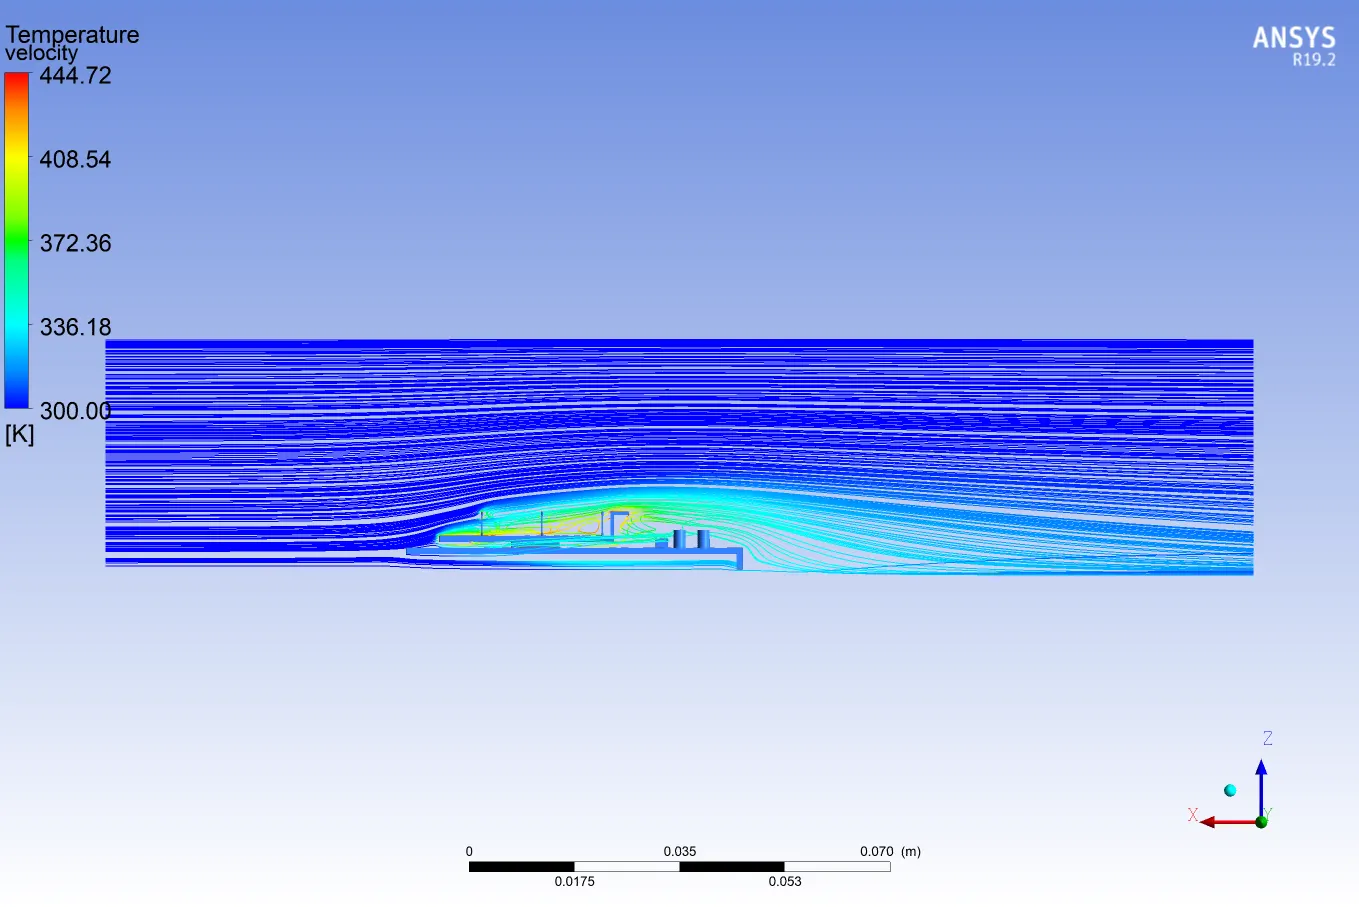 |
Temperatur Streamlines | 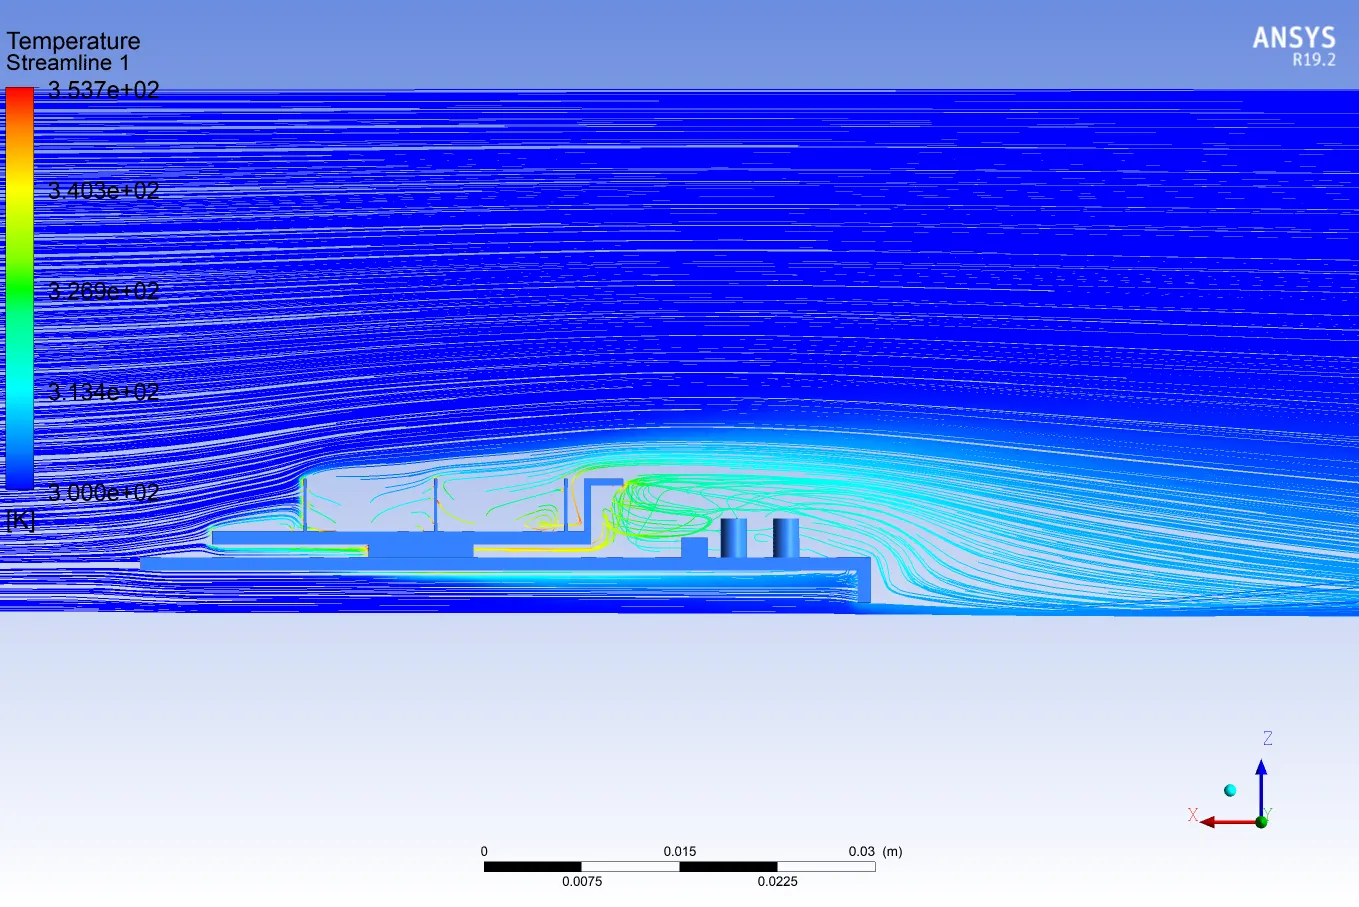 |
|
Velocity Vectors | 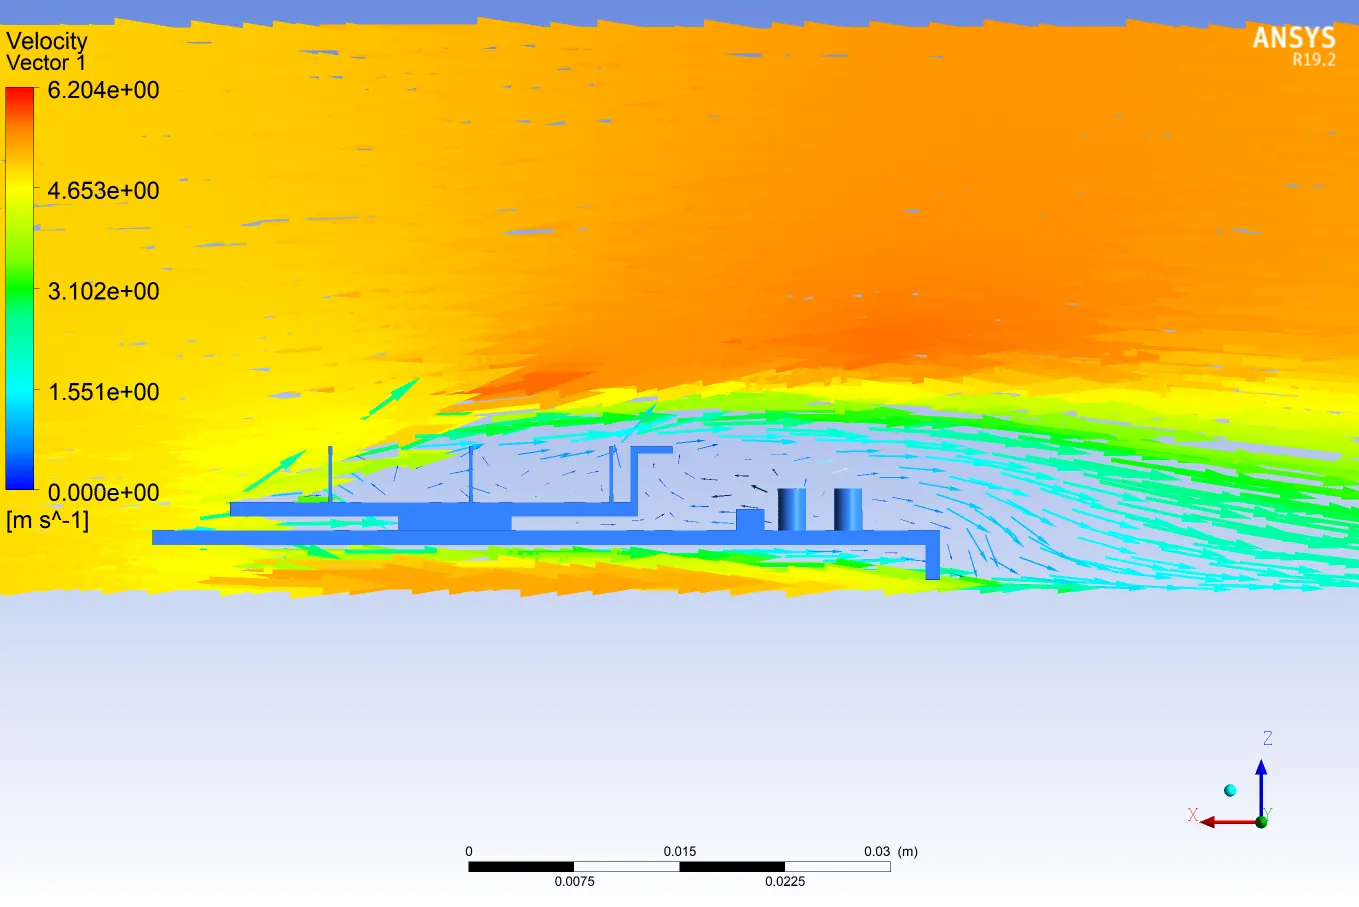 |
|
|
Temperature Vectors |
 |
Temperature Contour Animation :
1m/s 5m/s
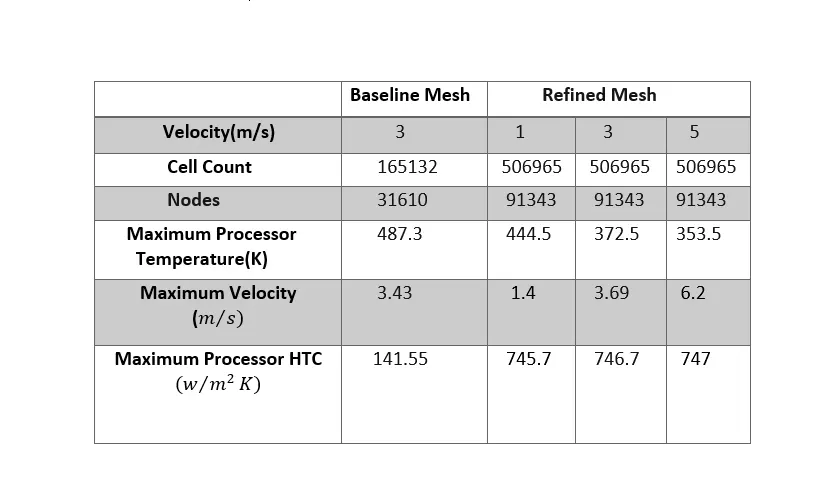
Result Table:
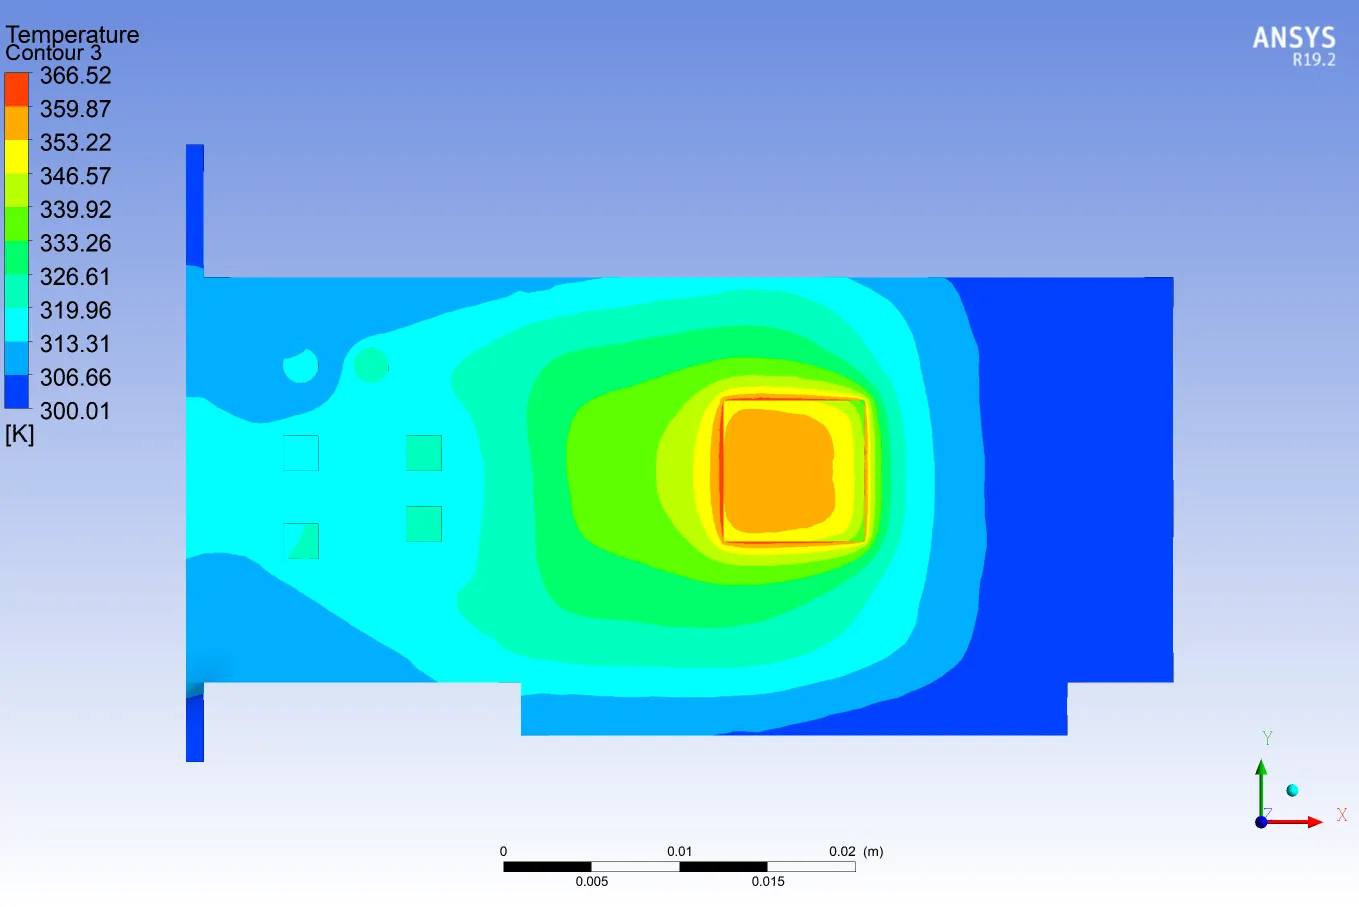
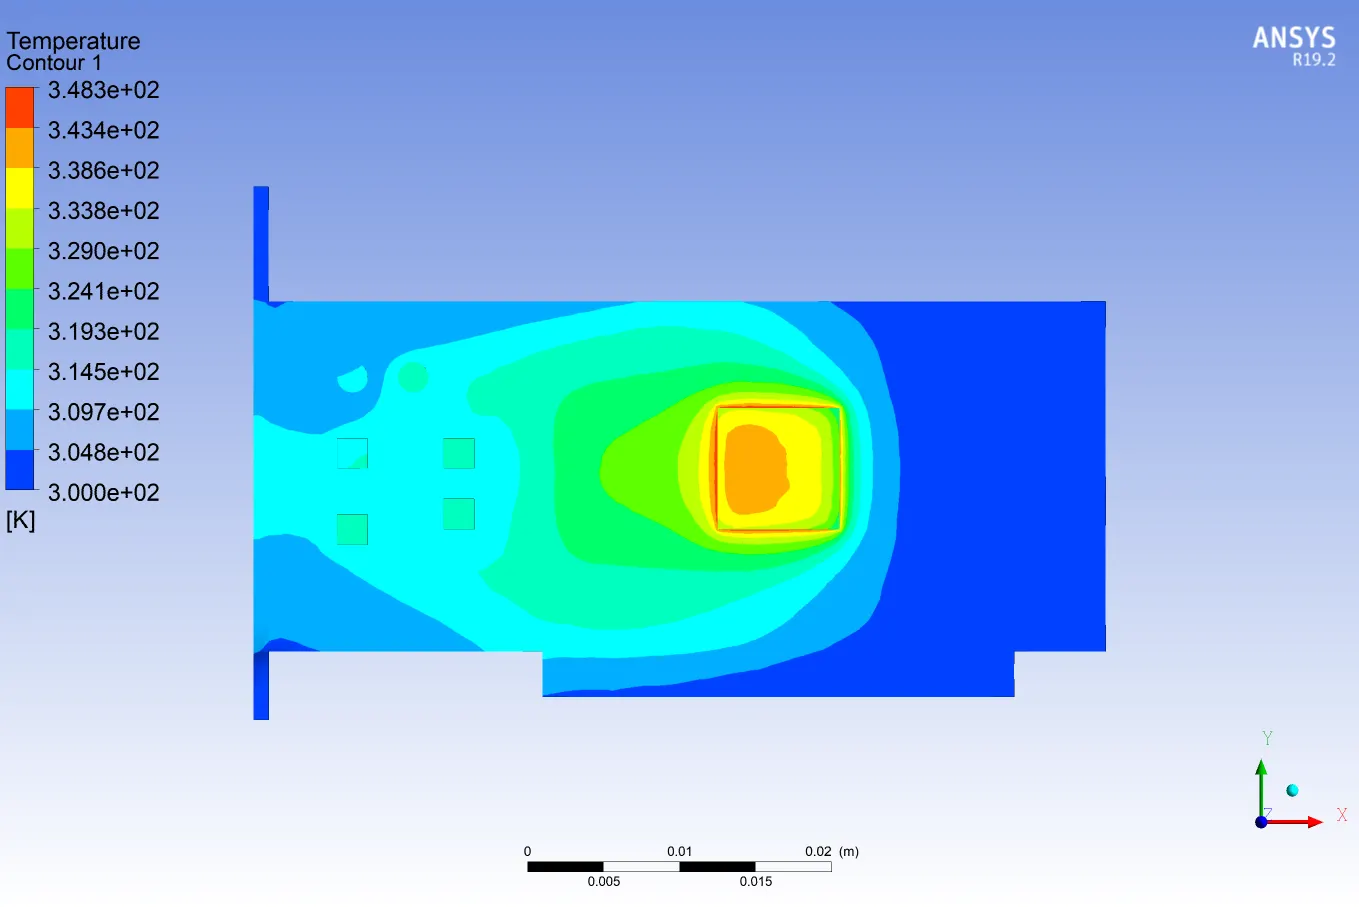
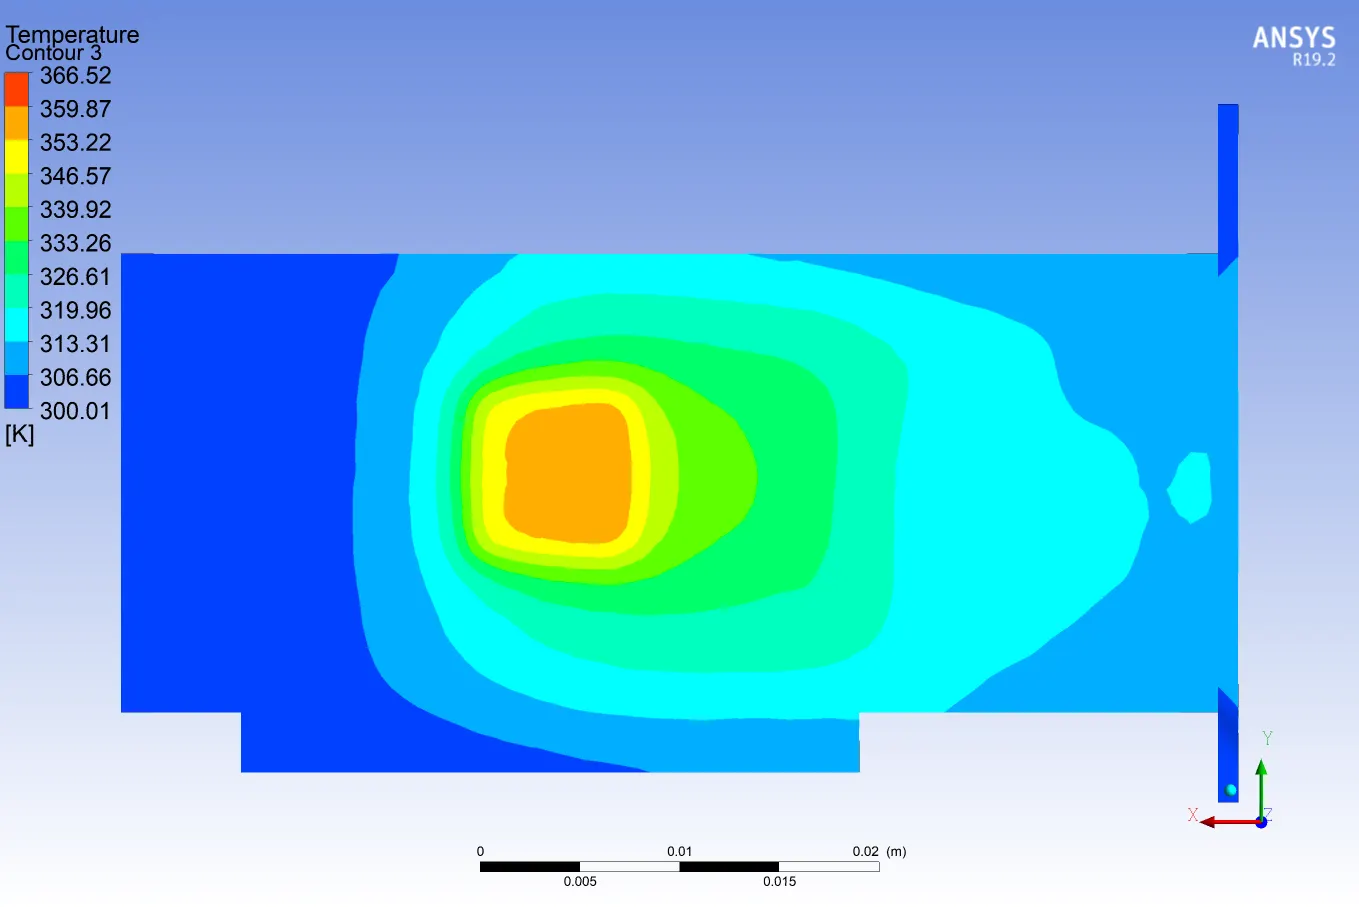
Here as we know that the processor is the source of heat, the temperature distribution is non-uniform in the fin because the processor is at the middle of the fin which is a heat source.
By observing the contour plots shown below we can say that the potential hotspot is the area above and below the processor.
Top View Bottom View
The air removes the excess heat from the fin and rakes it outside.
Conclusion :
Conjugate Heat Transfer Simulation on a graphics card was run successfully and from the results obtained we clearly can say that increasing the coolant(air) velocity will help in decreasing the temperature of the processor, this is because the heat dissipated from the processor increases with coolant velocity.
The fins help the processor to be maintained at a safe temperature by increasing the available surface area for the heat transfer.
Flow recirculation was seen at the end of Fin, Whenever flow recirculation takes place velocity tends to drop because of this convective heat transfer reduces and high-temperature zones can be observed. So we come to the conclusion that it's not a good idea to place the critical components in this recirculation zones. If its placed in this zone the there is chances of thermal damage.