Project-1: Powertrain for aircraft in runways
PART A
OBJECTIVE 1: Search and list out the total weight of various types of aircrafts.
ANS: total weight of various types of aircrafts:-
| Type | MTOW [kg] | MLW [tonnes] | TOR [m] | LR [m] | ICAO category | FAA category |
|---|---|---|---|---|---|---|
| Antonov An-225 | 640,000 | 591.7 | 3500 | Heavy | Super | |
| Scaled Composites Model 351 Stratolaunch | 589,670 | 3660 | Heavy | Super | ||
| Airbus A380-800[1][2][3] | 575,000 | 394 | 3100 | 1930 | Heavy | Super |
| Boeing 747-8F | 447,700 | 346.091 | 3100 | 1800 | Heavy | Heavy |
| Boeing 747-8 | 443,613 | 306.175 | 3100 | Heavy | Heavy | |
| Boeing 747-400ER | 412,770 | 295.742 | 3090 | Heavy | Heavy | |
| Antonov An-124-100M | 405,060 | 330 | 2520 | 900 | Heavy | Heavy |
| Boeing 747-400 | 396,900 | 295.742 | 3018 | 2179 | Heavy | Heavy |
| Lockheed C-5 Galaxy[4][5][6] | 381,000 | 288.417 | 2530 | 1494 | Heavy | Heavy |
| Boeing 747-200[7] | 377,840 | 285.700 | 3338 | 2109 | Heavy | Heavy |
| Boeing 747-300[7] | 377,840 | 260.320 | 3222 | 1905 | Heavy | Heavy |
| Airbus A340-500[8] | 371,950 | 240 | 3050 | 2010 | Heavy | Heavy |
| Airbus A340-600[8] | 367,400 | 256 | 3100 | 2100 | Heavy | Heavy |
| Boeing 777F | 347,800 | 260.816 | 2830 | Heavy | Heavy | |
| Boeing 777-300ER | 351,800 | 251.29 | 3100 | Heavy | Heavy | |
| Boeing 777-200LR | 347,450 | 223.168 | 3000 | Heavy | Heavy | |
| Boeing 747-100[7] | 340,200 | 265.300 | Heavy | Heavy | ||
| Airbus A350-1000 | 308,000 | 233.5 | Heavy | Heavy | ||
| Boeing 777-300 | 299,370 | 237.683 | 3380 | Heavy | Heavy | |
| Boeing 777-200ER | 297,550 | 213.00 | 3380 | 1550 | Heavy | Heavy |
| Airbus A340-300[8][9] | 276,700 | 190 | 3000 | 1926 | Heavy | Heavy |
| McDonnell Douglas MD-11 | 273,300 | 185 | 2990 | 1890 | Heavy | Heavy |
| Airbus A350-900 | 270,000 | 175 | 2670 | 1860 | Heavy | Heavy |
| Ilyushin Il-96M | 270,000 | 195.04 | 3115 | 2118 | Heavy | Heavy |
| McDonnell Douglas DC-10 | 256,280 | 183 | 2990 | 1890 | Heavy | Heavy |
| Boeing 787-9[10] | 254,000 | 192.777 | 2900 | Heavy | Heavy | |
| Boeing 787-10[10] | 254,000 | 201.849 | Heavy | Heavy | ||
| Airbus A340-200[8][11] | 253,500 | 181 | 2990 | Heavy | Heavy | |
| Airbus A330-900 | 251,000 | 191 | 3100 | Heavy | Heavy | |
| Ilyushin IL-96-300 | 250,000 | 175 | 2600 | 1980 | Heavy | Heavy |
| Airbus A330-300[12][13] | 242,000 | 185 | 2500 | 1750 | Heavy | Heavy |
| Airbus A330-200[12][13] | 242,000 | 180 | 2220 | 1750 | Heavy | Heavy |
| Lockheed L-1011-500 | 231,300 | 166.92 | 2636 | Heavy | Heavy | |
| Boeing 787-8[10] | 228,000 | 172.365 | 3300 | 1695 | Heavy | Heavy |
| Lockheed L-1011-200 | 211,400 | Heavy | Heavy | |||
| Ilyushin IL-86 | 208,000 | 175 | Heavy | Heavy | ||
| Boeing 767-400ER | 204,000 | 158.758 | 3414 | Heavy | Heavy | |
| Airbus A300-600R[14] | 192,000 | 140 | 2385 | 1555 | Heavy | Heavy |
| Boeing 767-300ER | 187,000 | 136.08 | 2713 | 1676 | Heavy | Heavy |
| Concorde | 185,000 | 111.1 | 3440 | 2220 | Heavy | Heavy |
| Airbus A300-600[14] | 163,000 | 138 | 2324 | 1536 | Heavy | Heavy |
| Boeing 767-300 | 159,000 | 136.078 | 2713 | 1676 | Heavy | Heavy |
| Airbus A310-300[14] | 157,000 | 124 | 2290 | 1490 | Heavy | Heavy |
| Vickers VC10 | 152,000 | 151.9 | Heavy | Heavy | ||
| Boeing 707-320B[15] | 151,000 | 97.5 | Heavy | Heavy | ||
| Boeing 707-320C[15] | 151,000 | 112.1 | Heavy | Heavy | ||
| Douglas DC-8-61 | 147,000 | Heavy | Heavy | |||
| Airbus A310-200[14] | 142,000 | 123 | 1860 | 1480 | Heavy | Heavy |
| Airbus A400M | 141,000 | 122 | 980 | 770 | Heavy | Heavy |
| Douglas DC-8-32 | 140,000 | Heavy | Heavy | |||
| Douglas DC-8-51 | 125,000 | Medium | Large | |||
| Boeing 757-300 | 124,000 | 101.6 | 2550 | 1750 | Medium | Large |
| Boeing 707-120B[15] | 117,000 | 86.3 | Medium | Large | ||
| Boeing 757-200 | 116,000 | 89.9 | 2347 | 1555 | Medium | Large |
| Boeing 720B[16] | 106,000 | 79.5 | Medium | Large | ||
| Boeing 720[16] | 104,000 | 79.5 | Medium | Large | ||
| Tupolev Tu-154M | 104,000 | 80 | Medium | Large | ||
| Tupolev Tu-204SM | 104,000 | 87.5 | 2250 | Medium | Large | |
| Convair 880 | 87,500 | Medium | Large | |||
| Boeing 737-900 | 85,000 | 66.36 | 2500 | 1704 | Medium | Large |
| Boeing 737-900ER | 85,000 | 71.35 | 2804 | 1829 | Medium | Large |
| Boeing 727-200 Advanced[17] | 84,000 | 70.1 | Medium | Large | ||
| Airbus A321-100[18] | 83,000 | 77.8 | 2200 | 1540 | Medium | Large |
| Boeing 737-800 | 79,000 | 65.32 | 2308 | 1634 | Medium | Large |
| Boeing 727-200[17] | 78,000 | 68.1 | Medium | Large | ||
| McDonnell-Douglas MD-83 | 73,000 | 63.28 | Medium | Large | ||
| Boeing 727-100[17] | 72,500 | 62.4 | Medium | Large | ||
| Boeing 727-100C[17] | 72,500 | 62.4 | Medium | Large | ||
| McDonnell-Douglas MD-90-30 | 71,000 | 64.41 | 2165 | 1520 | Medium | Large |
| de Havilland Comet 4 | 70,700 | Medium | Large | |||
| Boeing 737-700 | 70,000 | 58.06 | 1921 | 1415 | Medium | Large |
| Airbus A320-100[18] | 68,000 | 66 | 1955 | 1490 | Medium | Large |
| Boeing 737-400 | 68,000 | 54.9 | 2540 | 1540 | Medium | Large |
| de Havilland Comet 3 | 68,000 | Medium | Large | |||
| Boeing 377 | 67,000 | Medium | Large | |||
| Boeing 737-600 | 66,000 | 54.66 | 1796 | 1340 | Medium | Large |
| Airbus A220-300 | 65,000 | 57.61 | 1890 | 1494 | Medium | Large |
| Hawker Siddeley Trident 2E | 65,000 | Medium | Large | |||
| Airbus A319[18] | 64,000 | 62.5 | 1850 | 1470 | Medium | Large |
| Boeing 737-300 | 63,000 | 51.7 | 1939 | 1396 | Medium | Large |
| Boeing 737-500 | 60,000 | 49.9 | 1832 | 1360 | Medium | Large |
| Airbus A220-100 | 59,000 | 50.80 | 1463 | 1356 | Medium | Large |
| Airbus A318[18] | 59,000 | 57.5 | 1375 | 1340 | Medium | Large |
| Boeing 717-200HGW | 55,000 | 47.174 | 1950 | Medium | Large | |
| Douglas DC-7 | 55,000 | Medium | Large | |||
| de Havilland Comet 2 | 54,000 | Medium | Large | |||
| Boeing 717-200BGW | 50,000 | 46.265 | 1950 | Medium | Large | |
| de Havilland Comet 1 | 50,000 | Medium | Large | |||
| Douglas DC-6A | 48,600 | Medium | Large | |||
| Douglas DC-6B | 48,500 | Medium | Large | |||
| Embraer 190[19] | 48,000 | 43 | 2056 | 1323 | Medium | Large |
| Caravelle III | 46,000 | Medium | Large | |||
| Fokker 100 | 46,000 | 39.95 | 1621 | 1350 | Medium | Large |
| Douglas DC-6 | 44,000 | Medium | Large | |||
| Avro RJ-85 | 42,000 | 36.74 | Medium | Large | ||
| Handley Page Hermes | 39,000 | Medium | Large | |||
| Embraer 175[20] | 37,500 | 32.8 | 2244 | 1304 | Medium | Large |
| Bombardier CRJ900[21] | 36,500 | 33.345 | 1778 | 1596 | Medium | Large |
| Embraer 170[22] | 36,000 | 32.8 | 1644 | 1274 | Medium | Large |
| Bombardier CRJ700 | 33,000 | 30.39 | 1564 | 1478 | Medium | Large |
| Douglas DC-4 | 33,000 | Medium | Large | |||
| Vickers Viscount 800 |
OBJECTIVE 2: Is there any difference between ground speed and air speed?
ANS:
Airspeed vs. Ground Speed
- true airspeed is simply the speed at which an aircraft is moving relative to the air it is flying in. As such, it’s also the speed at which the air is flowing around the aircraft’s wings.
- Ground speed, on the other hand, is the aircraft’s speed relative to the ground. One thing that should be noted here is that it’s its horizontal rather than vertical speed – an aircraft climbing completely vertically would have a ground speed of zero.
- In other words, while airspeed is what determines whether there is enough airflow around an aircraft to make it fly, ground speed is what determines how fast an aircraft will get to its destination.
Wind’s Effect on Ground Speed
The relationship between airspeed and ground speed is fairly simple. Ground speed is simply the sum of airspeed and wind speed.
If the aircraft is flying in the same direction as the wind is blowing, the aircraft experiences tailwind, and its ground speed is higher than its airspeed. On the other hand, if the wind is blowing against the direction the aircraft is traveling in, the aircraft experiences headwind, and its ground speed is lower than its airspeed.
To give you an actual example, imagine an aircraft that cruises at an airspeed of 500 miles per hour that has to cover a ground distance of 2,000 miles.
If there is no wind at all, then both the aircraft’s airspeed and ground speed would be the same 500 miles per hour, and the aircraft would reach its destination in four hours.
If there was a 100 miles per hour headwind – wind blowing against the aircraft’s direction of travel – the aircraft would still be traveling at an airspeed of 500 miles per hour. However, its ground speed would be just 400 miles per hour (100 miles per hour slower than its airspeed). And as such, it would take the aircraft five hours to reach its destinations.
Finally, if there was a 100 miles per hour tailwind – wind blowing in the same direction as the aircraft’s travel – the aircraft would still be traveling at an airspeed of 500 miles per hour, but its ground speed would be 100 miles faster. And, at 600 miles an hour, the aircraft would reach its destination in just three hours and twenty minutes.
The above is the reason why some flights go “out of their way” to avoid headwinds or catch tailwinds. And, why some flights might appear to be traveling at “supersonic speeds,” even though their airspeed – the speed that would actually matter in determining whether or not the flight truly is supersonic – is subsonic.
Airspeed cannot be directly measured from a ground position, but must be computed from the ground speed and the wind speed. Airspeed is the vector difference between the ground speed and the wind speed. On a perfectly still day, the airspeed is equal to the ground speed. But if the wind is blowing in the same direction that the aircraft is moving, the airspeed will be less than the ground speed.
OBJECTIVE 3: Why is it not recommended to use aircraft engine power to move it on the ground at Airport?
ANS:
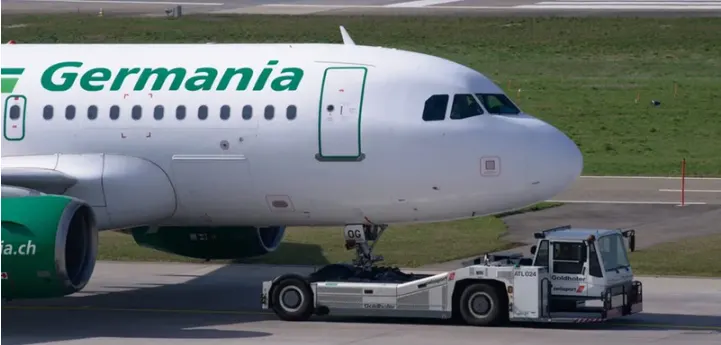
Airplanes get towed or pushed by tractors and tugs when jet blast from their engines or prop wash from their propellers will create a hazard to nearby buildings, ground crew, other aircraft & ground handling equipment. Moving aircraft from hangers to aprons does not require pilots if being towed.
When aircraft go in for maintenance or are not required for flight by far the easiest way is to send a tow vehicle to the gate and have the maintenance team tow the aircraft to the hanger or parking areas.
By doing this it allows time freedom for the airline, the airport ground controllers, and the maintenance team as pilots are not required to start the engines.
When an aircraft is being towed, trained and authorized maintenance personnel will be on board the aircraft to release and control the brakes to aid the tow vehicle operator.
Some airplanes will need to have their APU (Auxiliary Power Unit) started by the maintenance personnel so that electrical and hydraulic systems can be operational to operate the braking systems and aircraft lights when towing at night.
Moving an airplane away from the gate with a Tug or Tractor is by far the safest way around today’s busy airports.
Jet blast and propwash from an aircraft can easily send loose items airborne, turn grains of dust into projectiles and create debris that can be easily ingested into the multi-million-dollar engines.
By allowing the driver and apron walkers to reverse every aircraft out of their parking spots it allows many pairs of eyes to constantly scan the area for potential collisions and negates the need for engines to be running while in the close confines of a busy apron.
Tugs and tractors make manoeuvring an aircraft a simple and safe operation and that is why it is very; very rare you will ever see a large aircraft reverse using the power of its own engines.
Reference: Why Do Airplanes Need to Be Towed & Pushed? – Pilot Teacher
OBJECTIVE 4: How an aircraft is pushed to runway when its ready to take off?
ANS: an aircraft is pushed to runway
Ready for take-off in ten steps…
- The pilot parks the aircraft in exactly the right place. Usually with the help of an automatic system, but occasionally guided by a marshaller waving two paddles or wands. Dozens of handling personnel are already standing by to perform a whole range of tasks simultaneously.
- As soon as the aircraft is stationary and the engines are switched off, the first priority is to disembark the passengers as quickly as possible. The apron handler places chocks in front of the wheels and connects the ground power. Meanwhile, the passenger bridge manoeuvres up to the door and a belt loader rolls up to the cargo hold. Luggage is unloaded and transferred to the terminal on baggage carts.
- Refuelling begins, usually from a hydrant at the stand. A hose is attached to this from a special vehicle called a dispenser, with the other side connected to the fuel tank in the wing. Read more about refuelling here.
- Now it is time to service the aircraft. The caterer loads new meals and takes away the food waste and used cutlery and crockery. Other activities include draining the lavatories, replacing the headrest covers, removing rubbish and distributing fresh blankets and in-flight magazine.
- A specialist team – or sometimes the crew themselves – cleans the cabin so that the new passengers board a pristine aircraft.
- Meanwhile, specialists from the airline conduct a technical check to make sure that the engines, wings, control surfaces, landing gear, instruments, doors and other equipment are in full working order.
- The aircraft is now ready for baggage to be loaded for the next flight. This is a quick process, on average taking only 10-15 minutes. A little later the passengers start boarding. As soon as they are all in their seats, the door is closed and the pilot informs air-traffic control that the flight is ready for departure.
- The apron handler removes the chocks. A so-called pushback truck reverses the aircraft into taxiing position, pushing it with a towbar attached to the nose-wheel strut. Or, in the most modern versions, by actually lifting the wheel. That speeds up coupling and decoupling.
- The aircraft taxis to the runway to depart at the agreed time.
- The pilot waits for permission to take off from air-traffic control. This is possible once the departure route is clear. As soon as the go-ahead is received, the plane takes to the air at full power.
OBJECTIVE 5: Learn about take off power, tyre design, rolling resistance, tyre pressure, brake forces when landing.
ANS:
TAKE OFF AND LANDING
Take Off Performance
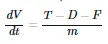
Take off performance can be predicted using a simple measure of the acceleration of the aircraft along the runway based on force equilibrium.
The forces involved will be,
T – Thrust of propulsion system pushing aircraft along runway.
D – Aerodynamic Drag of vehicle resisting the aircraft motion.
F – Rolling resistance friction due to the contact of wheels or skids on the ground.
During take-off run the imbalance in these forces will produce an acceleration along the runway.
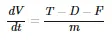
where dV/dt is the acceleration along the runway and m is the mass of the vehicle.
Rotation Velocity, Vr
The procedure for take-off will be that the vehicle will accelerate until it reaches a safe initial flying speed. The pilot can then rotate the vehicle to an attitude to produce climb lift and it will ascend from the ground. The determination of this safe flying speed or rotation speed, VR, is a critical factor in determining take-off performance.
Take-off rules vary slightly depending on the aircraft category. Small commuter aircraft should be considered as meeting FAR 23 rules, transport category aircraft should comply with FAR 25 rules.
Small commuter aircraft :
For safety reasons VR is usually determined as being 1.1 × VSTALL or 1.05 × Vmin CONTROL
which ever is greater. Stall speed, Vstall, is the lowest speed that the aircraft can be flown before the airflow starts to separate from wings as the angle of attack becomes too great. The wing is assumed in this case to be in take-off configuration or "clean".
It can be calculated based on knowledge of the aircraft take-off configuration and hence the maximum achievable lift coefficient CL(max). As shown in the previous section , to maintain level flight the lift produced must equal the weight, hence the stall speed can be calculated as,
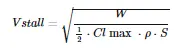
As well as rotation speed there are other safety considerations as shown in the following Figure.Minimum control speed, VMC is a more complex calculation and requires knowledge of the stall characteristics of the tailplane and elevator.
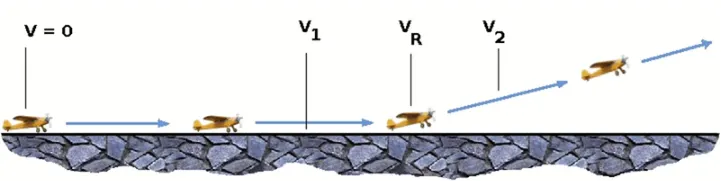
For conventional aircraft there is only a small difference between VR calculations based on stall speed or minimum control speed.
V1- Abort decision speed. Below this speed the take-off can be safely aborted. After this there will not be sufficient runway length to allow the aircraft to decelerate to a stop.
V2 – Safe climb speed. V2 must be no less than 1.2 * Vstall. Below this speed aircraft cannot attain sufficient climb rate.
Transport Aircraft :
VR must not be less than V1
VR must be greater than 1.05 * VMC
VR must be set so that aircraft achieves V2 before reaching a height of 35ft above the runway surface.
Aircraft must climb at a minimum gradient to avoid obstacles at the end of the runway. With engine failure on multi-engined aircraft, this speed should still be achievable.
Thrust
The thrust of gas turbine or turbofan engines will be relatively constant during take-off. A good assumption is to use the manufacturer's values for maximum static thrust for take-off calculations.
The thrust of a propeller driven aircraft can be found from the given shaft horsepower data for the engine and the use of the equations using propeller efficiency given in the previous section.

DragIt is critical to correctly estimate the propeller efficiency for the particular aircraft velocity along the runway. At V=0 the efficiency is 0 so the above equation makes no sense. At V=VR the efficiency will be in the range 50% to 80% depending on the type of propeller system used and the thrust value at this point will be easy to obtain. In practice, the thrust obtained throughout the take-off roll is roughly constant so this end point value is a good approximation from V=0 to V=VR
The resistance to motion due to the air viscosity will give a drag of
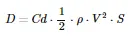
where CD can be considered constant and calculated using the formula shown in the previous sectionρ.V2S
Although Drag Coefficient is constant, Drag will increase in proportion to the square of velocity.
Rolling Resistance
The friction between aircraft and runway will be proportional to the normal force exerted by the aircraft on the runway.

The normal force will be the difference between Weight of aircraft and Lift, the friction coefficient will be typically of a magnitude of 0.02 for a standard tarmac runway.
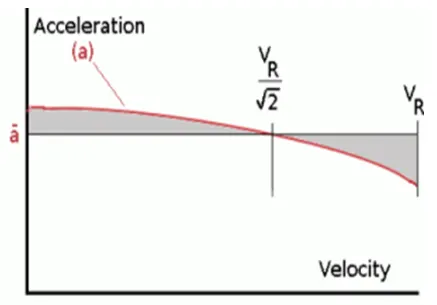
Average acceleration and distance to rotation
The rate of change of velocity can be predicted at any point on the take-off roll by substituting results for T, D and F into the initial equation for dV/dt. The subsequent velocity at any point can be found by integrating this resulting equation and the distance traveled found by then integrating the velocity.
Typically acceleration will be dominated by the drag component as thrust, weight and friction are relatively constant during this period. This leads to the result shown where acceleration is inversely proportional to velocity squared.
Due to the quadratic nature of acceleration change, an average value,

can be used for the take-off run. This average acceleration can be found at the point where,

VR=This average acceleration can be used to simplify calculations and the take-off run can be calculated as an equivalent constant acceleration over the complete period of time (tR) taken to get from 0 to VR. For a constant acceleration take-off calculation,

Rearranging leads to a relatively simple calculation to predict distance to rotation point.tR2

s2=From the rotation point, the end of the runway can be defined by the requirement to clear a 35ft obstacle at the end. During rotation it can be assumed that any residual excess thrust is absorbed in overcoming the lift induced drag as the aircraft begins to climb. Acceleration reduces and a constant flight speed during this climb phase can be assumed. The distance along the ground from rotation point to obstacle clearance point with thus be,Obstacle Clearance Distance
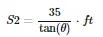
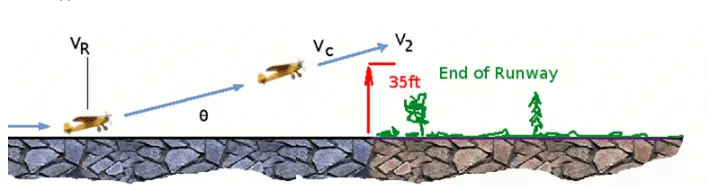
This distance estimate will require knowledge of the climb gradient which can be calculated by using the methods in the following section on Climb and Descent. ft
Take-Off (Balanced) Field Length
The required length of runway will be the sum of the distance required to get to rotation speed and the extra length required to clear a 50ft obstacle or the extra length required to allow for rapid braking if the pilot decides to abort take-off at the decision speed V1.
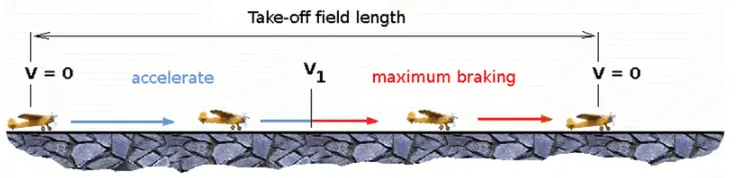
This length will typically be considerably longer than the distance required to achieve rotation (flying) speed. A rough approximation is that runway total length is around 2 x s1
Distance to V1 can be calculated in a manner similar to that shown for VR. The calculation of braking distance will require knowledge of the maximum braking friction coefficient that can be generated by the aircraft. This information should be available from manufacturer's data. Braking distance calculations should also be done without any assumption of reverse thrust from engines as during a take-off abort, engine power may not be available.
Landing
The landing run can be calculated in a similar fashion to the take off distance. The aim is again to minimise the distance.
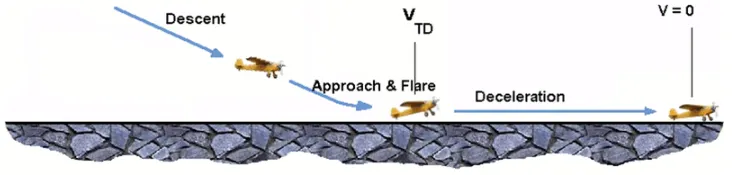
The touch down velocity should be approximately the stall speed of the aircraft in landing configuration. This will be achieved by a pitch manoeuvre during the flare portion of the approach which which increase drag an decelerate the aircraft to minimum flying speed.
The deceleration on the landing roll from VTD to V0 will be accomplished by braking and reverse thrust. This can be solved by the average acceleration approach that was used to estimate the take-off roll.
The negative acceleration or deceleration value will be based on friction coefficient for maximum braking and the value of reverse thrust (if available).
Design and Construction of Aircraft tyre
Carcass plies are used to form the tire. They are sometimes called casing plies. An aircraft tyre is constructed for the purpose it serves.
- They support the weight of an aircraft while it is on the ground.
- It also provides the necessary traction for braking and stopping of an aeroplane.
- Tyre also helps to absorb the shock of landing and provide cushioning the roughness of take-off, roll-out, and taxi operations.
Unlike an automobile or truck tyre, it does not have to carry a load for a long period of continuous operation. However, an aircraft tyre absorbs the high impact loads of landing, and also it’s operating at hig speeds for a short time when required.
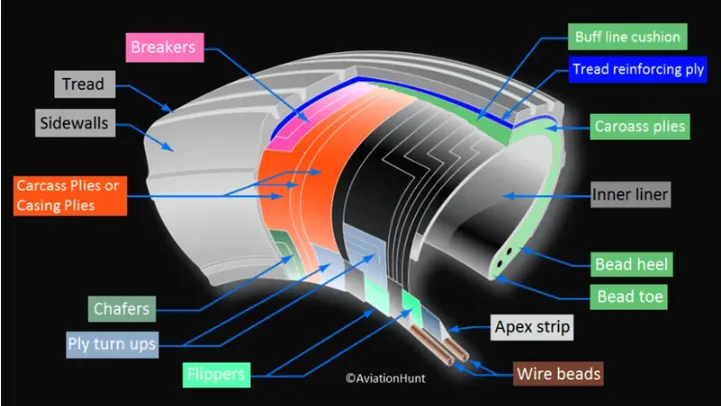
Let’s go through some technical aspects of the tyre.
Retreading – Retreading is methods of restoring a worn tyre by renewing the tread area or by renewing the tread area plus one or both sidewalls. Repairs are included in the tyre retreading process.
Load Rating – Load rating is the maximum permissible load at a specified inflation pressure.
Ply Rating – Ply Rating is used to identify the maximum recommended load rating and inflation pressure for a specified tyre. It is an index of tyre strength.
Speed Rating – The speed rating is the maximum takeoff speed to which the tyre has been tested.
Skid Depth – Skid depth is the distance between the tread surface and the deepest groove as measured in the mould.
Aircraft tyres must have an approved speed and load rating and have sufficient clearance when retracted through landing gear to allow for tyre growth. Tyre growth is the increase in the size of the tyre due to centrifugal forces at high speed.
Reference: Aircraft Tyre | Design and Construction - AviationHunt
ROLLING RESISTANCE
The force to move an airplane on an absolute flat runway with no wind at constant low speed is equal to the rolling resistance between the plane and the tarmac.
The rolling resistance for the air plane can be calculated as
Fr = c mr ag (1)
where
Fr = rolling resistance (N, lbf)
c = rolling resistance coefficient
mr = rolling mass (kg, lbm)
ag = acceleration of gravity (9.81 m/s2)
Example - Force required to pull an airplane at constant low speed on tarmac
If the mass of a plane is 40000 kg and the rolling coefficient between the aircraft wheel and the tarmac is 0.02 - the force required to overcome the rolling resistance can be calculated as
Fr = 0.02 (40000 kg) (9.81 m/s2)
= 7848 N
This force can be delivered by a pulling truck or - as occasionally seen - by a number of pulling people. Enough weight for the pullers are required to create friction forces against the tarmac that equals the plane rolling resistance.
The friction force for the puller can be calculated to
Ff = μ W
= μ mf ag (2)
where
Ff = frictional force (N, lb)
μ = friction coefficient
W = weight (N, lbf)
mf = friction mass (kg)
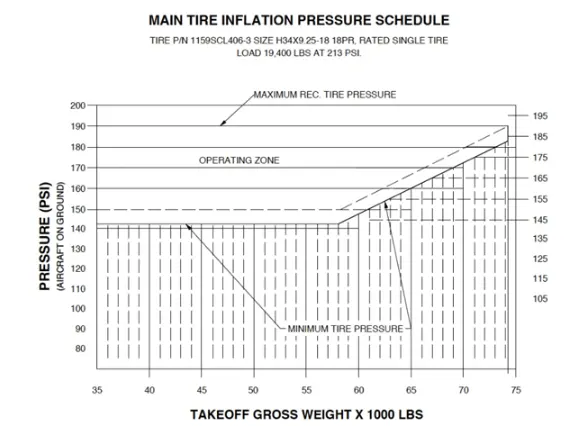
TYRE PRESSURE
PART B
OBJECTIVE 6: With necessary assumptions, calculate the force and power required to push / pull an aircraft by a towing vehicle.
ANS:
Mototok: Electric tugs for aircrafts over 95 t
Towing vehicel for study:
SPACER 250
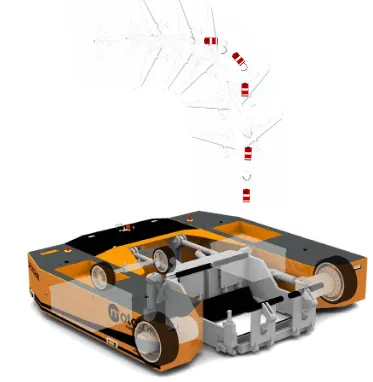
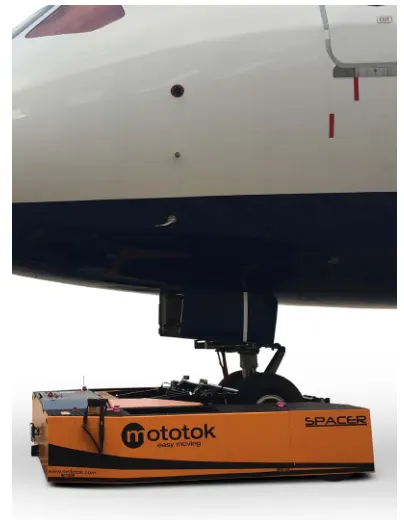
Tugs for aircraft above 95T.
Dimensions:
width 3988mm
length 3999mm
overall height 879mm
weight 13000kg
wheel radius (r) 0.5m
speed 4km/h
AIRBUS 350
Length 60.54m
Height 17.10m
weight 190tonnes
width 43.90m
TO CALCULATE POWER RQUIRED BY TOWING VEHICLE;
Force acting on vehicel ;
Ft = Frr + Fad;
Ft = tractive force;
Frr = rolling resistance force;
Fad = air drag force;
now,
ROLLING RESISTANCE;

co-efficient of rolling resistance = 0.02`
m= mass of vehicle + mass of aircraft;
m = 13000 + 190000;
m = 2,03,000 kg.
g = gravity = 9.81m/s2
calculating Total rolling resistance ;
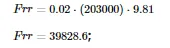
AIR DRAG FORCE;
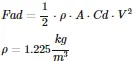
ρ=1.225kgm3
A = front area of aircraft
A = height * width;
A = ( 15.80 * 43.90 );
A-693.62 m^2
Cd = drag co-efficient = 0.0265;
v = velocity of vehicle = 1.2m/s;
calculating Total AIR DRAG ;
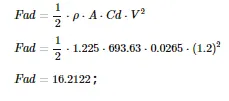
CALCULATING TOTAL TRACTIVE FORCE = Frr + Fad ;
Ft = 39828.6 + 16.211
Ft = 39298.811
now,
calculating TOTAL POWER REQUIRED BY VEHICEL;
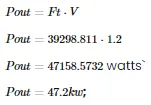
THE POWER REQUIRED BY VEHICLE IS 47.2 KW.
calculating TOTAL TORQUE REQUIRED BY VEHICEL;
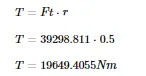
THE TORQUE REQUIRED BY VEHICLE IS 19649.4055 Nm.
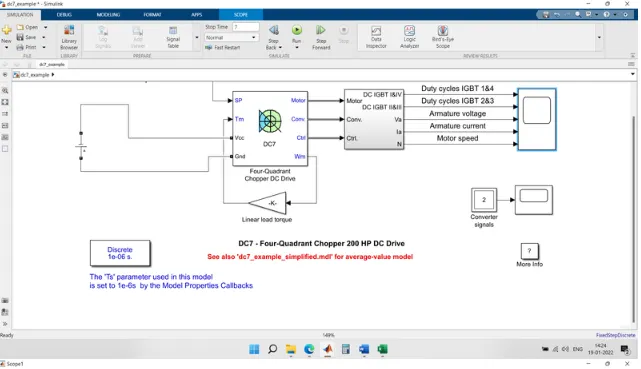
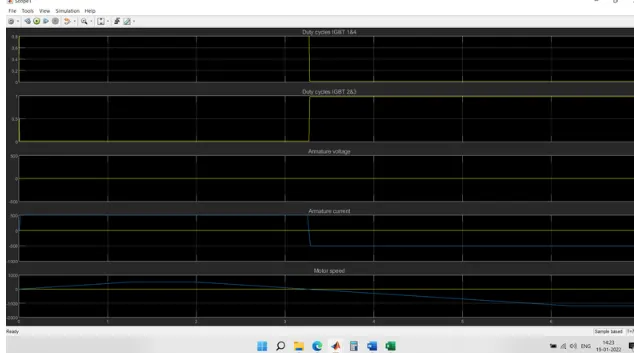
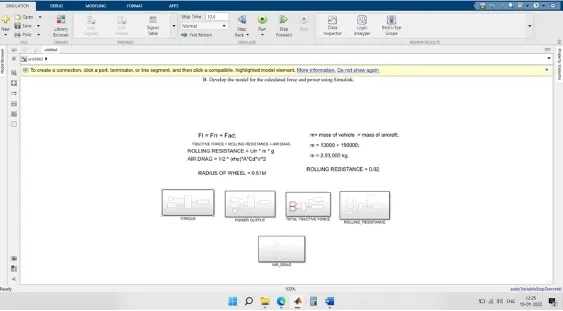
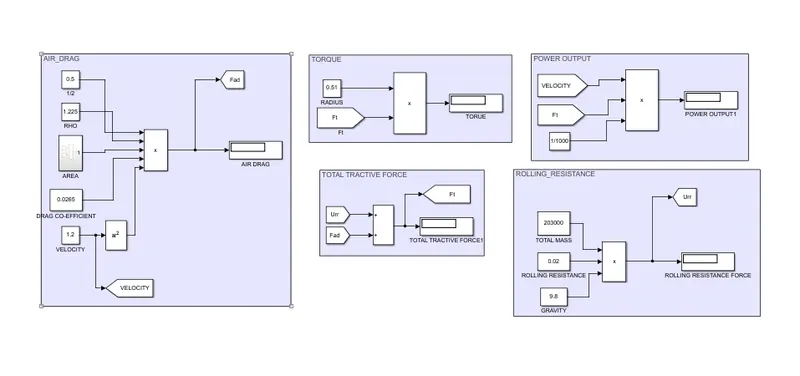
SIMULINK MODEL OF THE SAME CALCULATION IS SHOWN BELOW;
OBJECTIVE 7:
A. Design an electric powertrain with type of motor, it’s power rating, and energy requirement to fulfill aircraft towing application in Simulink. Estimate the duty cycle range to control the aircraft speed from zero to highest. Make all required assumptions. Prepare a table of assumed parameters. Draw a block diagram of powertrain.
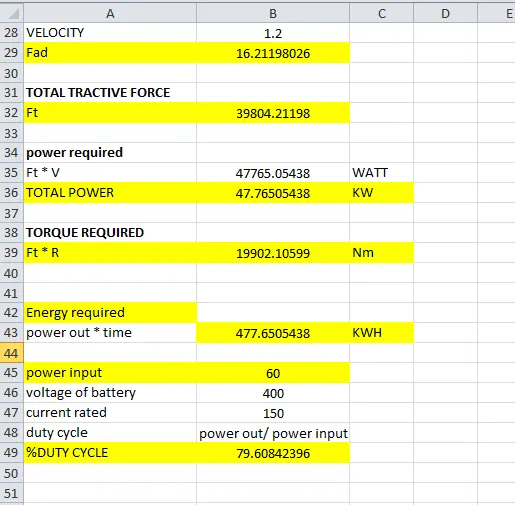
B. Also, Design the parameters in excel sheet
ANS:
Power rating of required motor : 47.2KW
torque required : 19649Nm
Energy = Pout * time ;
E = 47.2 * (10) ;
E = 472 KWH ;
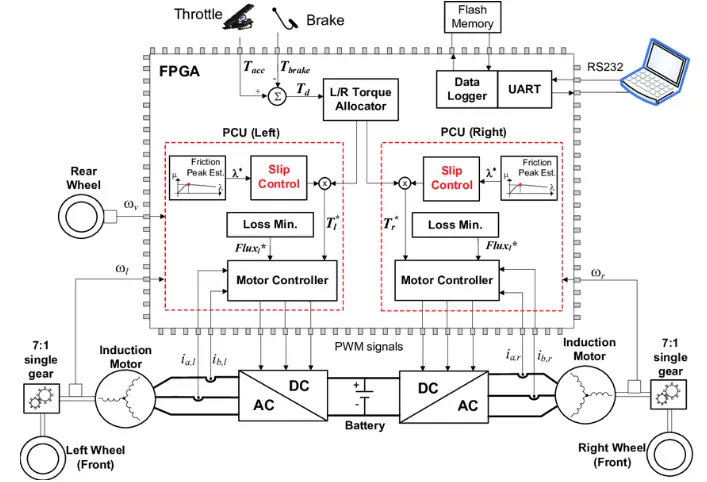
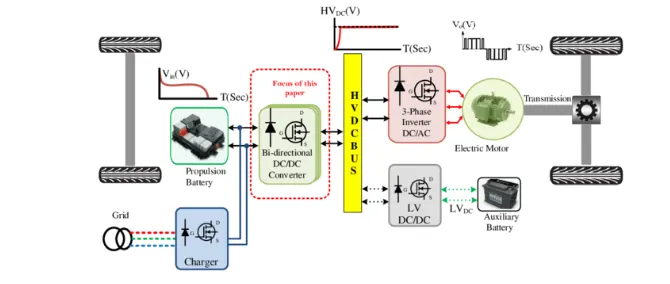
Duty cyle = power input / power output
assuming battery speicfication ;
voltage = 400v
current = 150A
POWER INPUT = 400 * 150
POWER INPUT = 60kW
duty cycle = 47.2/60
DUTY CYCLE = 0.7866
%DUTY CYCLE = 78%
Also, Design the parameters in excel sheet.
EXCEL CALCULATOR:
SIMULINK MODEL OF POWERTRAIN: