Project 2 - Rankine cycle Simulator
Aim:-Writing a code to simulate rankine cycle.
Theory:-
The Rankine cycle is a model used to predict the performance of steam turbine systems.Rankine cycle consits of an operating fluid which continuously gets evaporated and condensed in a close loop.
Components used:-
1)Boiler for generating steam at constant pressure
2)A turbine or engine in which steam will expand isentropically and work is done.
3)A condenser in which heat is removed from the exhaust steam and it is completely converted into water at constant pressure.
4)A pump which raises the pressure of liquid water to boiler pressure and pumps it in to the boiler for converting into steam.
Process:
•Process 1–2: The working fluid is pumped from low to high pressure. As the fluid is a liquid at this stage, the pump requires little input energy.it is isentropic compression process
•Process 2–3: The high-pressure liquid enters a boiler, where it is heated at constant pressure by an external heat source to become a dry saturated vapour.it is constant pressure heat addition process
•Process 3–4: The dry saturated vapour expands through a turbine. This decreases the temperature and pressure of the vapour, and some condensation may occur. .it is isentropic expansion.
•Process 4–1: The wet vapour then enters a condenser, where it is condensed at a constant pressure to become a saturated liquid.it is constant pressure heat rejection process.
Rankine cycle code on MATLAB:
clear all
close all
clc
disp('RANKINE CYCLE SIMULATOR');
disp('1-2 = isentropic expansion in the turbine');
disp('2-3 = constant pressure heat rejection by the condensor');
disp('3-4 = isentropic compression in the pump');
disp('4-1 = constant pressure heat addition by the boiler');
%To type the inputs and getting the text as given in the problem
t1 = input('enter the temperature at the turbine inlet (in degree celsius):');
p1=input('enter the pressure at the turbine inlet (in bar):');
p2=input('enter the pressure at the condensor (in bar)');
fprintf('rRESULTSrn')
%stage 1 (turbine inlet)
s1= XSteam('s_pT',p1,t1);
h1=XSteam('h_pT',p1,t1);
%stage 2 condenser inlet
sf2 = XSteam('sL_p',p2);
sg2 = XSteam('sV_p',p2);
hf2 = XSteam('hL_p',p2);
hg2 = XSteam('hV_p',p2);
s2 = s1;
t2 = XSteam('Tsat_p',p2);
%splitting the formulae
x2=((s2-sf2)/(sg2-sf2));
h2=hf2+(x2*(hg2-hf2));
%stage3 (pump inlet)
p3=p2;
t3=XSteam('Tsat_p',p2);
s3=XSteam('sL_p',p3);
h3=XSteam('hL_p',p3);
cp4 = XSteam('cpL_p',p3);
cv4 = XSteam('cvL_p',p3);
gamma = (cp4/cv4);
g = (gamma-1)/gamma;
%stage 4(boiler inlet)
p4=p1;
s4=s3;
h4 = XSteam('h_ps',p4,s4);
t4=t3*((p4/p3)^g);
%turbine work
wt=h1-h2;
%pump work
wp=h4-h3;
%network
w_net=wt-wp;
%Heat in and out of the system
q_in=h1-h4;
q_out=h2-h3;
q_in=h1-h4;
q_out=h2-h3;
n=w_net/q_in;
np=n*100;
SSC=3600/w_net;
tf_sat=XSteam('Tsat_p',p1);
sf_sat=XSteam('sL_p',p1);
hf_sat=XSteam('hL_p',p1);
sg_sat=XSteam('sV_p',p1);
hg_sat=XSteam('hV_p',p1);
%plot figure 1
figure(1)
hold on
temp=linspace(0,400,1000);
for i=1:length(temp)
aa(i) =XSteam('sL_T',temp(i));
end
for j=1:length(temp)
bb(j)=XSteam('sV_T',temp(j));
end
plot(aa,temp,'color','b')
plot(bb,temp,'color','b')
temp=(XSteam('Tsat_p',p1));
t0=linspace(temp,t1,300);
for i=1:length(t0)
c11(i)=XSteam('s_pt',p1,t0(i));
end
t5=XSteam('Tsat_p',p4);
s5=XSteam('sL_T',t5);
plot([s1 s2],[t1 t2],'color','r')
plot([s2 s3],[t2 t3],'color','r')
plot([s3 s4],[t3 t4],'color','r')
plot([s4 s5],[t4 t5],'color','r')
plot([sf_sat sg_sat],[tf_sat tf_sat],'color','r')
plot(c11,t0,'color','r')
title('T-S diagram')
xlabel('entropy(KJ/kgK)')
ylabel('Temperature(K)')
text(s1,t1,'1');
text(s2,t2,'2');
text(s3,t3,'3');
text(s4,t4,'4');
text(s5,t5,'4s');
text(sg_sat,tf_sat,'1s');
%plotting figure 2
figure(2)
hold on
temp1=linspace(0,400,1000);
for i=1:length(temp1)
cc(i)=XSteam('hL_T',temp1(i));
end
for j=1:length(temp1)
dd(j)=XSteam('hV_T',temp1(j));
end
plot(aa,cc,'color','b')
plot(bb,dd,'color','b')
plot([s1 s2],[h1 h2],'color','r')
plot([s2 s3],[h2 h3],'color','r')
plot([s3 s4],[h3 h4],'color','r')
plot([s4 s1],[h4 h1],'color','r')
title('H-S diagram')
xlabel('entropy(KJ/KgK)')
ylabel('enthalpy(KJ/Kg)')
text(s1,h1,'1');
text(s2,h2,'2');
text(s3,h3,'3');
text(s4,h4,'4');
%printing the output
fprintf('at stage point 1:n')
fprintf('P1 is : %f barn',p1)
fprintf('T1 is : %f deg celsiusn',p1)
fprintf('T1 is :%f KJ/kgn',h1)
fprintf('S1 is: %f KJ/KgKrn',s1)
disp('at state point 2:')
fprintf('P2 is : %f Barn',p2)
fprintf('T2 is : %f deg celsiusn',t2)
fprintf('H2 is : %f KJ/Kgn',h2)
fprintf('S2 is : %f KJ/KgKn',s2)
fprintf('X is : %f rn',x2)
disp('at state point 3:')
fprintf('P3 is : %f Barn',p3)
fprintf('T3 is : %f deg celsius400n',t3)
fprintf('H3 is : %f KJ/Kgn',h3)
fprintf('S2 is : %f KJ/KgKbn',s3)
disp('at state point 4:')
fprintf('P4 is : %f Barn',p4)
fprintf('T4 is : %f deg celsiusn',t4)
fprintf('H4 is : %f KJ/Kgn',h4)
fprintf('S4 is : %f KJ/KgKbn',s4)
fprintf('Wt : %f KJ/Kgn',wt)
fprintf('Wp : %f KJ/Kgn',wp)
fprintf('Wnet : %f KJ/Kgn',w_net)
fprintf('Ntherm : %f %%n',n*100)
fprintf('SSC : %f KJ/KWhbn',SSC)
Explaination of code -
clc, clear all, close all - to clear command window and remove previous variables.
fprintf - to print required lines in command window.
input - to get values of input conditions from user.
XSteam - custom function to get values from steam table.
if-else - to calculate dryness fraction s2.
for - to create points to plot dry saturated liquid and vapour line.
plot - to plot graph based on input.
text - give name to points in plot.
Result:
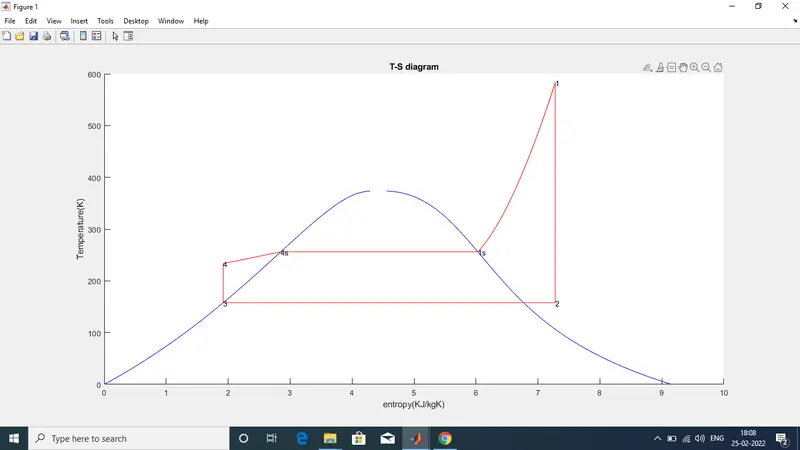
T-S Diagram
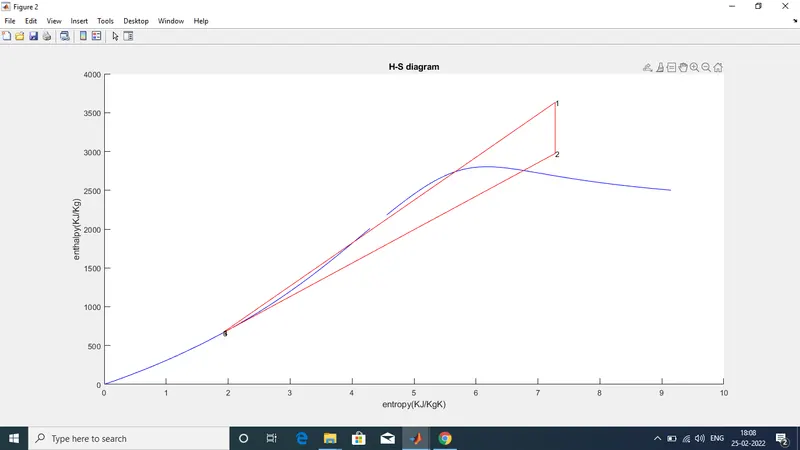
H-S Diagram
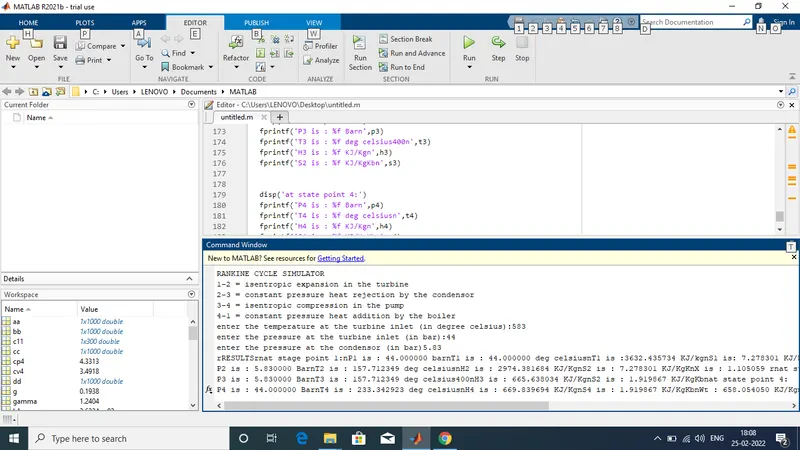
Output screen/Command window :