Modelling and simulation of flow through a flowbench
Aim: To study the flow bench simulation and select the best mesh size and run the parametric study on different valve lifts.
Objective :
- To create a 3D model of the Flow bench And Flow Analysis.
- Obtain Plot lift vs mass flow rate.
- To parametric study of valve Lift.
Introduction:
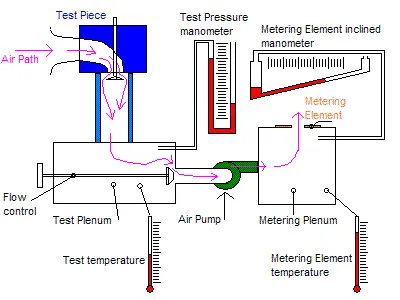
An air flow bench is a device used for testing the internal aerodynamic qualities of an engine component and is related to the more familiar wind tunnel. It is used primarily for testing the intake and exhaust ports of cylinder heads of internal combustion engines. It is also used to test the flow capabilities of any component such as air filters, carburetors, manifolds, or any other part that is required to flow gas.
A flow bench consists of an air pump of the sort a metering element pressure & temperature measuring instruments. The air pump must be able to deliver the volume required pressure required. The mass flow rate can be calculated using the known pressure and temperature data to calculate air densities and multiplying by the volume flow rate. The airflow through the engine is directly controlled by the valve lift, so greater flow should occur at the maximum valve lift at least up to a certain point.
Explanation:
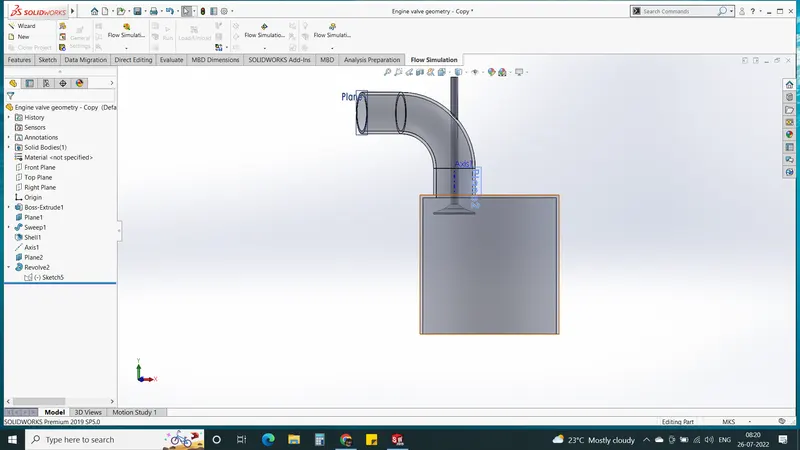
- Create a 3D model of the Flow bench Model with an Approx Dimension.
- Create a new project to perform flow simulation.
- Apply Boundry Conditions as per requirement Such as Total Pressure at the inlet & Static pressure at the exit.
- Select the Required Goal Parameter such as Global Mass Flow Rate & Surface Goal parameter.
- Results Required Cut Plot Of Velocity & Pressure.
To perform simulation Parameters to be Considered
| Project Name | Flow Bench Simulation |
| Unit System | M-k-S |
| Analysis Type | Internal |
| Fluids | Air |
| Flow Type | Laminar & Turbulent |
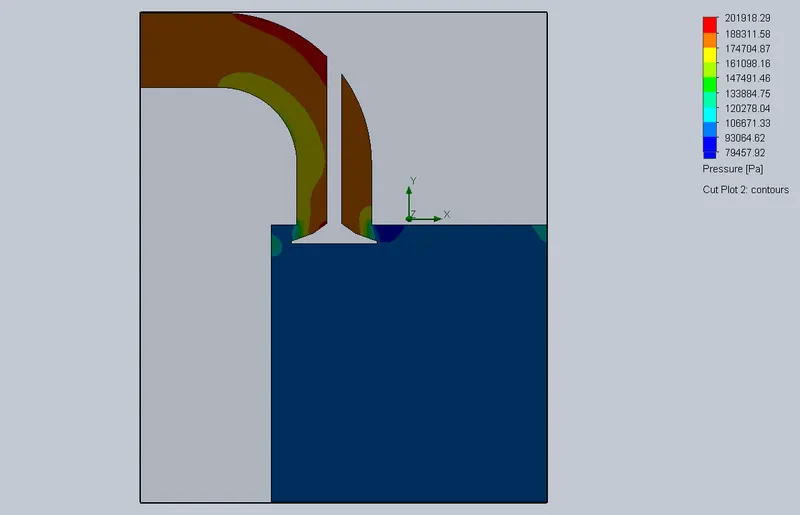
Total pressure: (202650 Pa)
The total pressure is the measure of the total energy of the airstream and is equal to static pressure plus velocity pressure.
Static pressure: (101325 Pa)
Static pressure is the pressure that a fluid exerts when it is not moving.
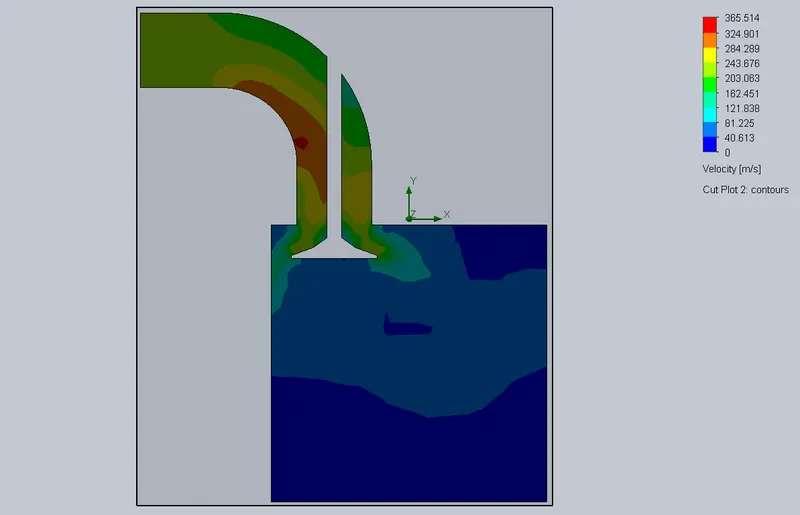
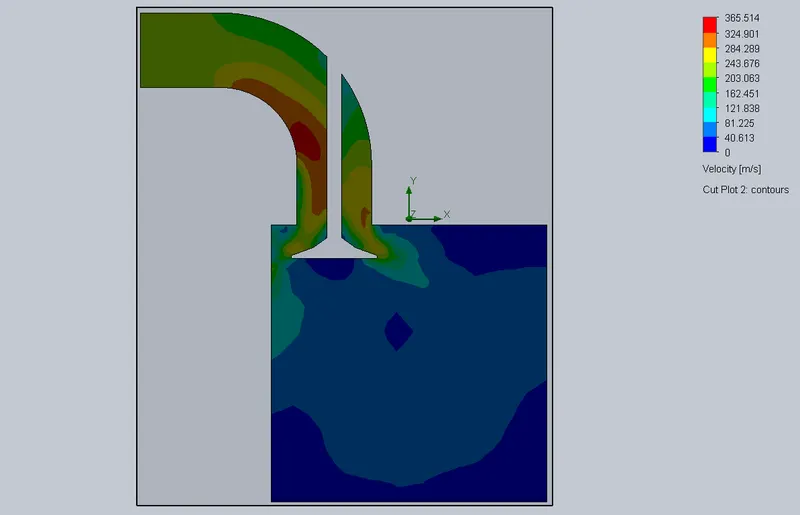
We have to perform the Grid Dependency Test to get which mesh is giving the best Results ( 3,4,5) As the mesh getting Refine it gives the best results. Considering Refineries Mesh (5) Performing simulation. at maximum valve Lift 0.008m.
Mesh Size 3
Mesh Size 4
Mesh Size 5
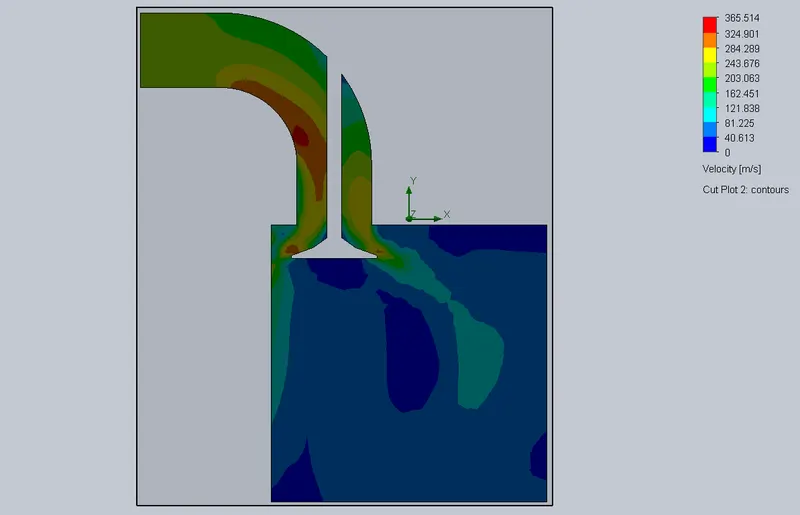
After Considering a Better mesh Size of 5, a more refined mesh we got the result for Pressure & Velocity Plots at different valve Lifts.
Max Valve Lift - 0.008
Min Valve Lift - 0.003
Results :
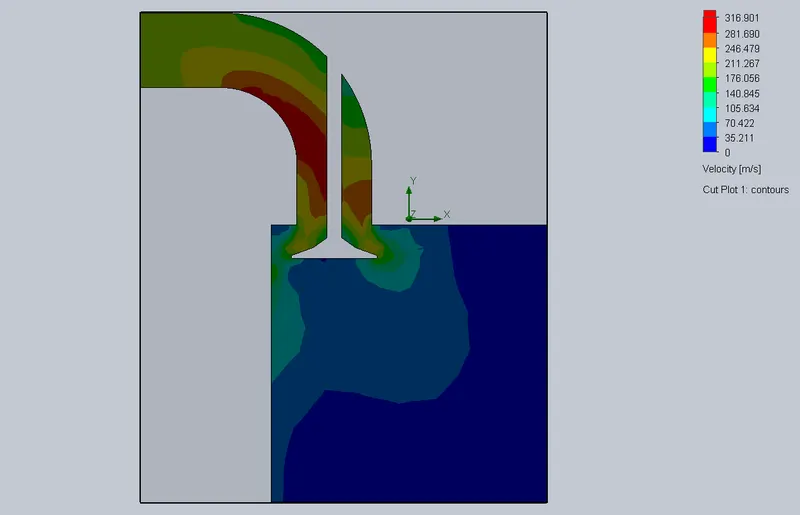
Cut Plot Of Pressure & Velocity at valve lift 0.003
Pressure
Velocity
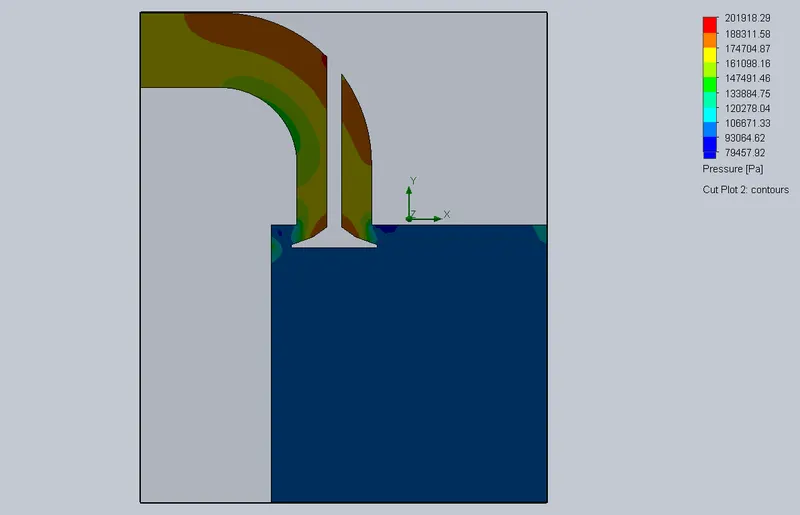
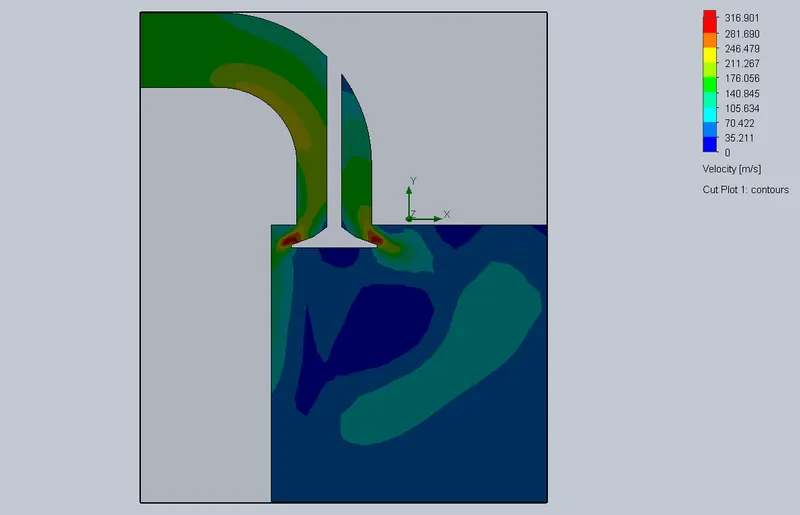
Cut Plot Of Pressure & Velocity at valve lift 0.00425
Pressure
Velocity
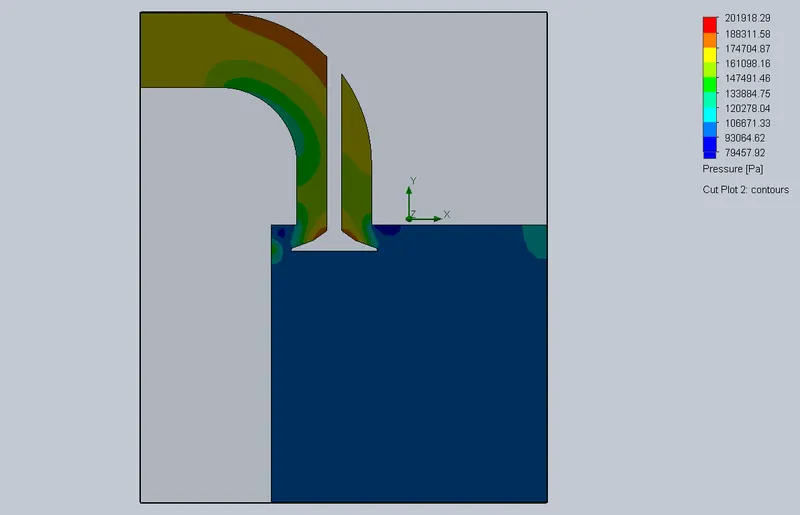
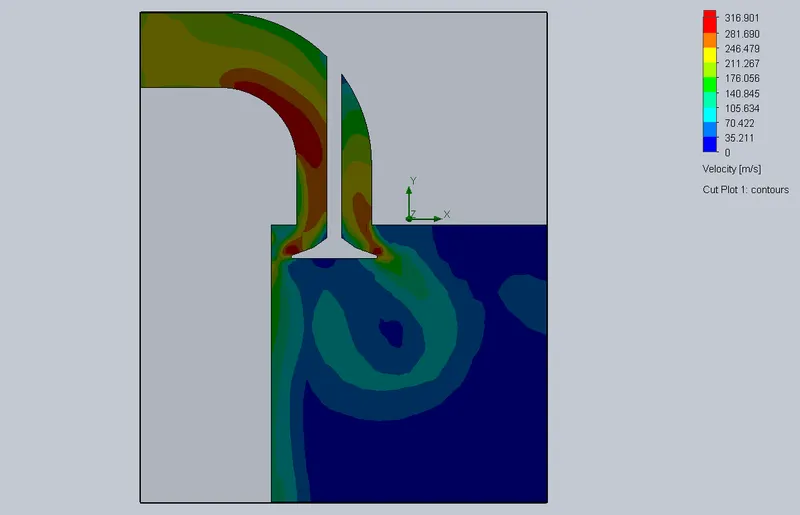
Cut Plot Of Pressure & Velocity at valve lift 0.0055
Pressure
Velocity
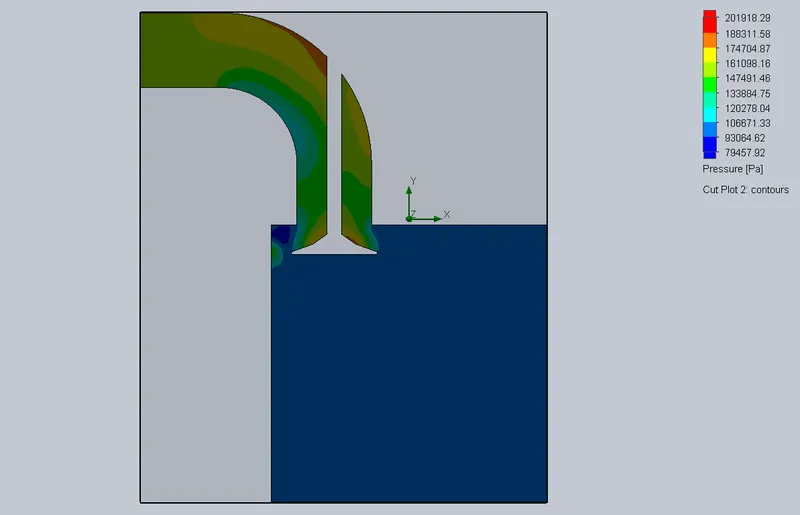
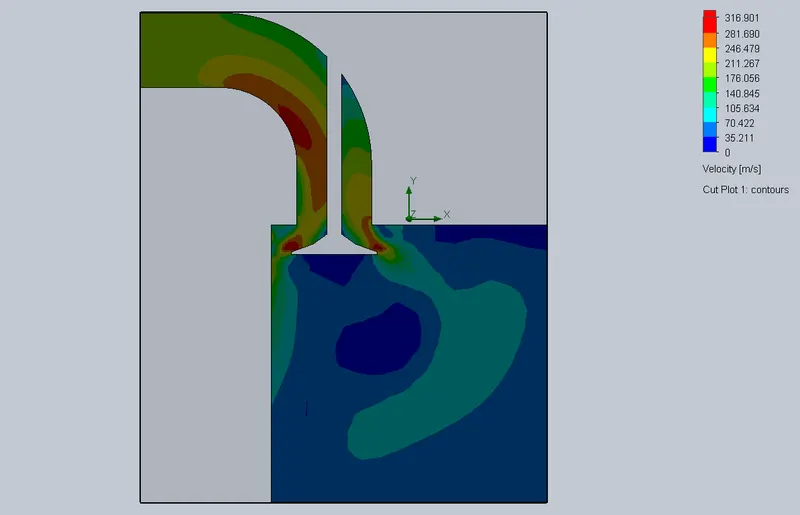
Cut Plot Of Pressure & Velocity at valve lift 0.00675
Pressure
Velocity
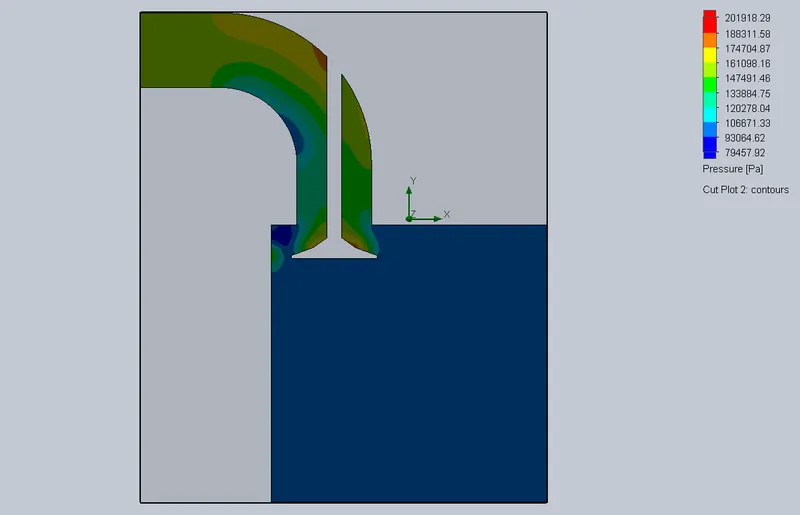
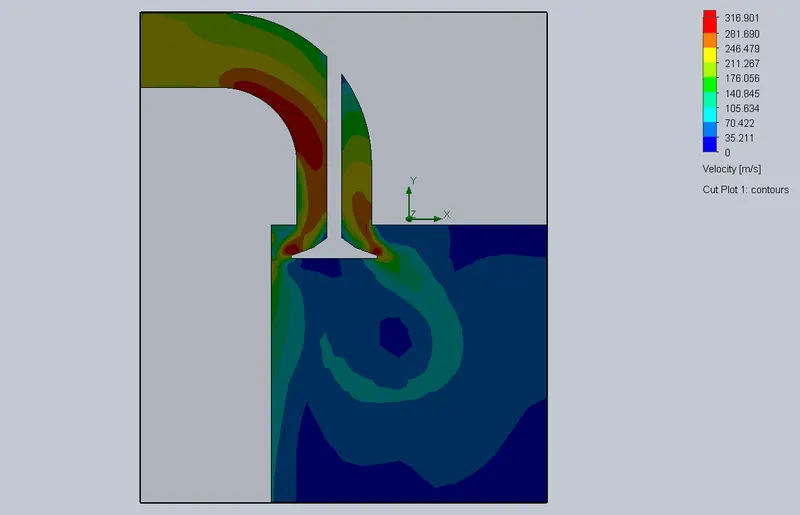
Cut Plot Of Pressure & Velocity at valve lift 0.008
Pressure
Velocity
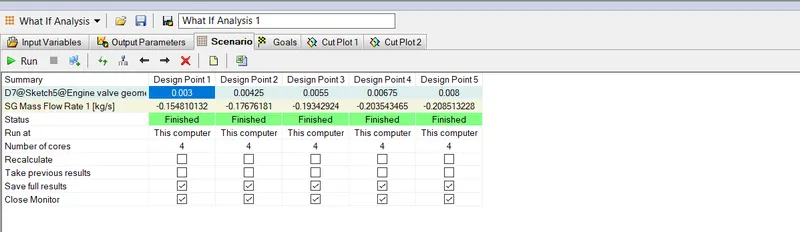
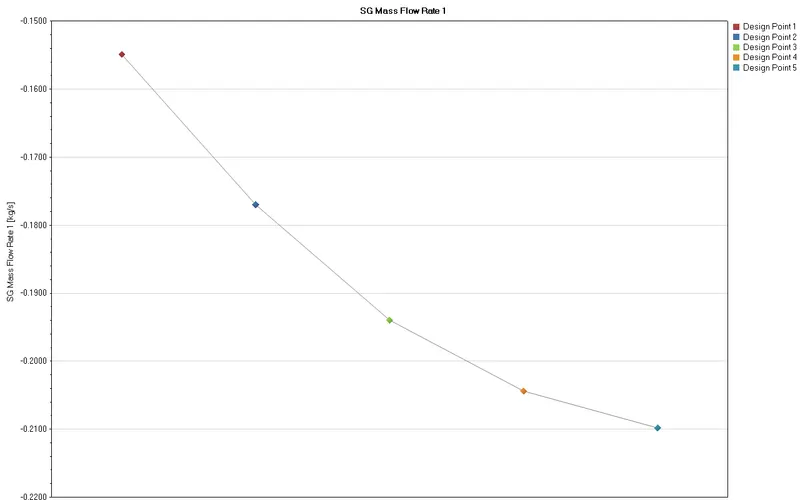
After Performing a Parametric study of flow simulation we got a Mass Flow Rate Result.
| Goal | Design Point 1 | Design Point 2 | Design Point 3 | Design Point 4 | Design Point 5 |
| D7@Sketch5@Engine valve geometry - Copy.Part [m] | 0.003 | 0.00425 | 0.0055 | 0.00675 | 0.008 |
| SG Mass Flow Rate 1 [kg/s] | -0.1549 | -0.177 | -0.194 | -0.2044 | -0.2098 |
a plot of lift vs mass flow rate
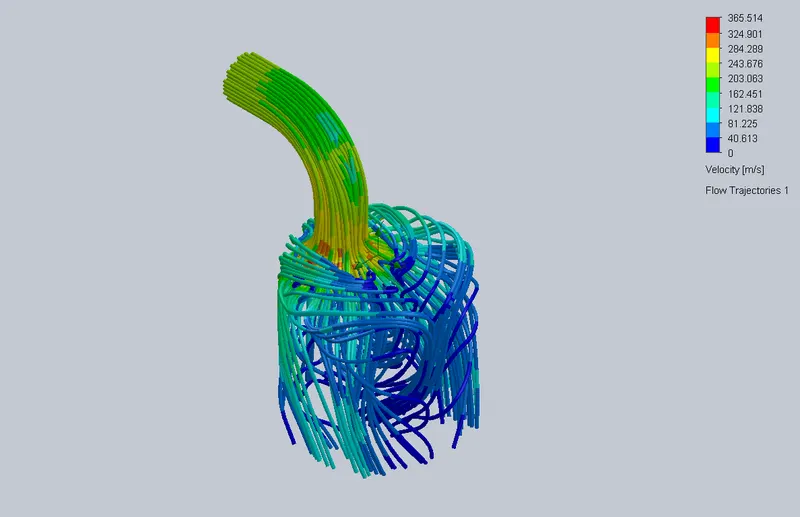
Flow Trajectory
Conclusion:
- From the Above Simulation, we got the result for mass flow rate at different valve lifts max mass flow rate - -0.1549 & Max mass flow rate - -0.2098.
- The above study concludes that As the lift increases, the velocity rate increases which improves the combustion of the fuel and can produce more power.
- Actually, the mass flow rate increases but as the goals are specified on the valve surface only the result are negative.
- As mesh becomes finer it gives good results.