WIDE OPEN THROTTLE (WOT) CONDITION
AIM:
MODELLING OF HEV AND EV FOR A WIDE-OPEN THROTTLE (WOT) DRIVING CYCLE USING SIMULINK
OBJECTIVE:
1) To find the ratio of hill-climbing power required by fully loaded Tata Ultra Truck to half-loaded one.
2) How much can be the minimum length of the flyover, considering the minimum height at the summit should be 5.5 meters, state assumptions.
3) To prepare a new drive cycle excel file having a third column representing hill-climbing angle corresponding to speed and time. Revise the model file ‘Driver_Glider.slx’ such that it can calculate gradient force from drive cycle.
4) Model the WOT (Wide Open Throttle) response of GM EV1 car. Compare it with official figures of performance of the real vehicle. Prepare a table showing variation in acceleration time with 5% change in vehicle parameters.
STUDY-1: TO FIND THE RATIO OF HILL CLIMBING POWER REQUIRED BY FULLY LOADED TATA ULTRA TRUCK TO HALF LOADED ONE.
Introduction:
BSVI T.12 Ultra is the offering from Tata Motors in ICV segment with New Generation 3.3L Engine having more power at 155 HP @ 2600 RPM and Max Torque of 450 NM @ 1400 - 2200 RPM.
T.12 Ultra @ 11990 GVW Segment is the best fit as long-haul transportation with multiple deck lengths (20ft to 24ft) is designed to address the agile goods movement across all business applications. It is developed for Indian roads, redefining transportation industry leveraging enhanced technologies, blending ideally both technology and economy of operations.
The New Generation (NG) cabin with appealing, futuristic styling & aerodynamic is designed thoughtfully with a walk-through feature, adding up with roomy interiors and 1+2 seating. It is developed to delight both the fleet owners as also the general driving fraternity. 6-speed G550 gearbox is configured better drivability and best in class FE.
GIVEN DATA:
Gradeability: 33%
Degrees = Tan-1(Gradeability)
= Tan-1(0.33)
= 18.26
Sin (18.26) = 0.3133
But, we have to convert the degrees into radians 18.26°C = 0.31869712 radians
Therefore, Sin (0.31869712) = 0.00555314698
Speed = 30 Kmph (Assumed)
= 8.333 m/s
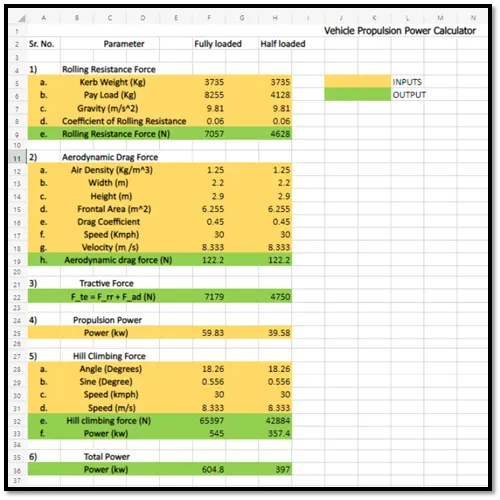
Fig.1. Power calculator for truck
EXCEL FILE: https://drive.google.com/file/d/1kOB_AhmmliuFZ_i4QEqlnR9cUdcj3XUa/view?usp=sharing
The power ratio = Fully loaded total power/ Half loaded total power
Power ratio = 604.8/397 = 1.52342569
Thus, the hill-climbing power ratio of TATA ultra-truck (T.12) is 1.523
STUDY-2: TO FIND THE MINIMUM LENGTH OF FLYOVER
GIVEN DATA:
Summit height: 5.5 m
Truck Gradeability: 33% (Assumed)
Degrees = Tan-1(Gradeability)
= Tan-1(0.33)
= 18.26
Sin (18.26) = 0.3133
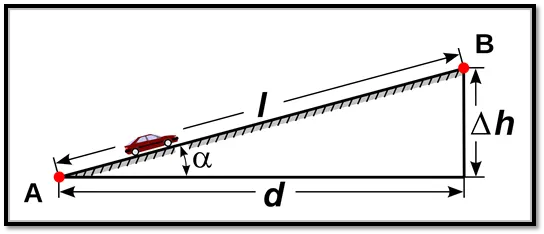
Fig.2. Gradeability for vehicle
Sin (18.26) = Perpendicular Height ( `triangle`h) / Hypotenuse (l)
Let's assume here,
Summit height = 5.5 m = Perpendicular Height (h)
i.e, l = 5.5/0.3133
Therefore, Hypotenuse (l) = 17.5534029 m
The minimum length of flyover is 17.55 meters.
STUDY-3: TO PREPARE THE DRIVE CYCLE EXCEL FILE WITH HILL CLIMBING ANGLE CORRESPONDING TO SPEED AND TIME. USING DRIVER GLIDER.XLS FILE CALCULATE GRADIENT FORCE FOR PREPARED DRIVE CYCLE
GIVEN DATA:
Drive cycle data assumptions,
Time – (1-125) secs
Velocity - (0-100) kmph
Inclination Angle - (0-10) °C
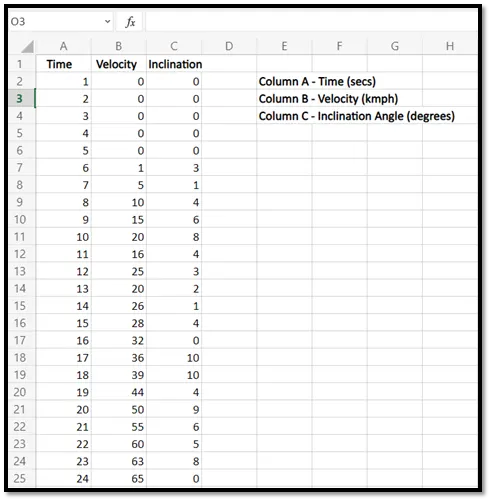
Fig.3. Drive Cycle
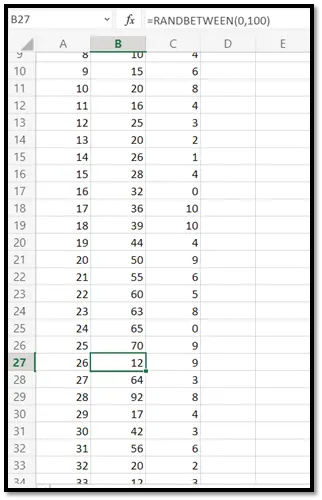
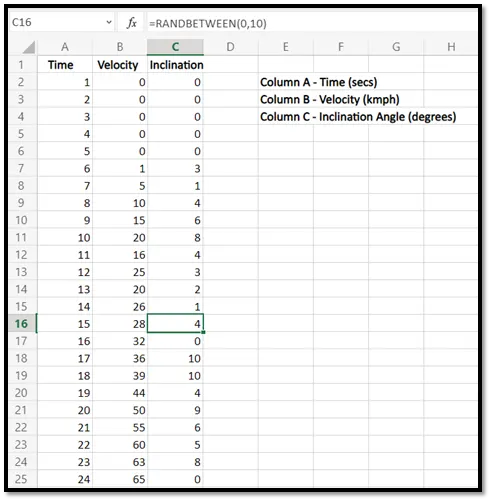
Fig.3.1. Rand values for velocity and inclination
DRIVE CYCLE DATA: https://drive.google.com/file/d/1GR00D1dqbctTX4diciY3EdGFoy1kOUHA/view?usp=sharing
After creating the drive cycle data, import the data file in matlab to use it in driver_glider model file.
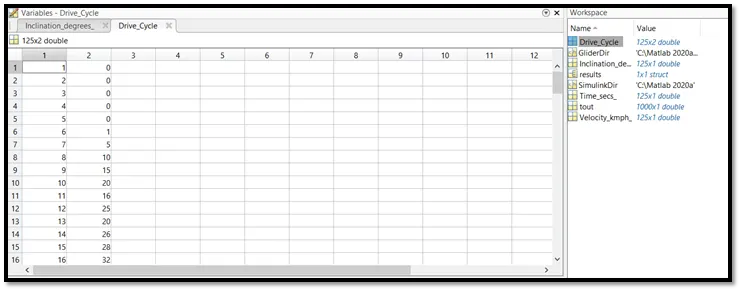
Fig.3.2. Imported data
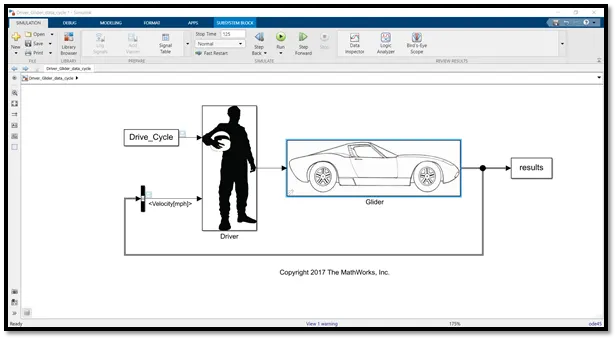
Fig.3.3 Data file inserted in Driver glider model
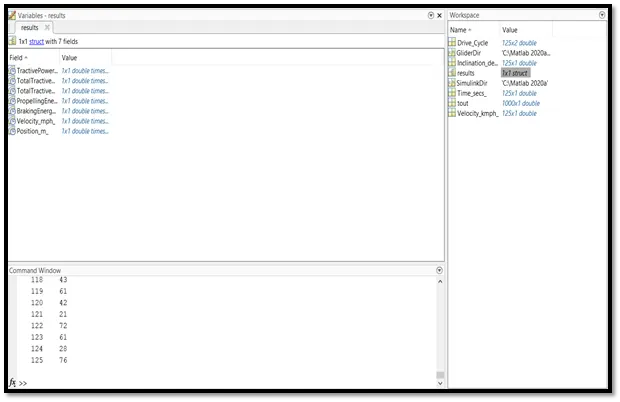
Fig.3.4. Results data
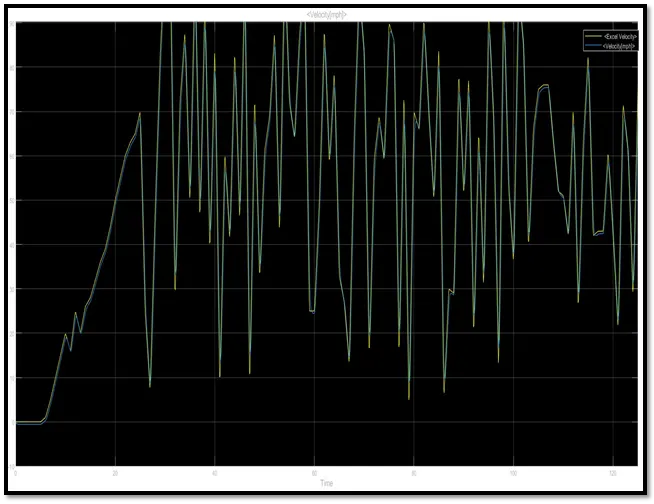
Fig.3.5. Drive Cycle output
To find the gradient force from the drive cycle,
We take the maximum slope angle in data file i.e. 10°C
Converting degrees into radians 10°C = 0.17453293 radians
So put the radian value inside the 'inclination Angle' given in grade force block parameter.
The gradient force from the drive cycle is 3918 N.
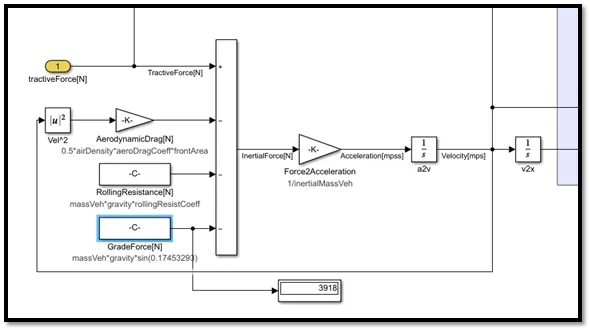
Fig.3.5. Grade Force
MODEL FILE: https://drive.google.com/file/d/1Y5IIMUctmRQJfjpT3qb0vtg8IrsbFxbV/view?usp=sharing
STUDY-4: MODEL THE WOT RESPONSE OF GM EV1 CAR. COMPARE WITH OFFICIAL FIGURES OF PERFORMANCE OF THE REAL VEHICLE, PREPARE A TABLE SHOWING VARIATION IN ACCELERATION TIME WITH 5% CHANGE IN VEHICLE PARAMETERS.
Introduction:
WOT is when the accelerator is depressed fully, sometimes referred to as "flooring it" (because automotive throttle controls are usually a pedal. It is the point at which the maximum amount of fuel is being injected relative to the amount of air pumped by the engine, generally in order to bring the fuel-air mixture up to the stoichiometric point.
GOVERNING EQUATIONS:
1) `V = (r*omega)/G`
where,
v - Velocity (m/s)
r - Radius (m)
`omega` - Angular velocity (rad/sec)
G - Gear ratio
2) `(G/r)*T_max. = mu_r*m*g + 0.625*A*C_d*v^2 + (m+I*(G^2/(eta_g*r^2)))*(dv)/dt`
where,
`(G/r)*T_max` - Acceleration Time
`mu_r*m*g` - Rolling Resistance Force
`0.625*A*C_d*v^2` - Aerodynamic drag force
`m+I*(G^2/(eta_g*r^2))` - Acceleration force component
GIVEN DATA:
GM EV1 car parameters,
m = 1540 kg
T_max = 140 Nm
G = 11
m + I = 1638
`omega`= 733 rad/sec
T = 1023000/37v = 2756/v ( T_max is replaced by T = (p*r)/(G*v))
A = 1.8 m^2
r = 0.30 m
`eta_g` = 0.95
v = 19.8 m/s
v_max = 35.8 m/s
C_d = 0.19
`mu_r` = 0.0048
Derived from the above equations,
We put the changed values in this equation -

and we obtain,
`v/dt = 3.11 - 0.000137v_n^2`
`v/dt = 62.1/v-0.046 - 0.000137v_n^2`
v_n+1 = v_n + `(3.11 - 0.000137v_n^2)*deltat`
v_n+1 = v_n + (62.1/v-0.046 - 0.000137v_n^2)*`deltat`
Program:
clear all
close all
clc

t = linspace(0,10,201);
vel = 0;
dt = 0.1;

% Velocity and time at WOT
for n = 1:200
    if vel(n)<19.8
        vel(n+1) = vel(n) + (3.11 - (0.000137*(vel(n)^2)))*dt;
    elseif vel(n)>= 35.8
        vel(n+1) = vel(n);
    else
        vel(n+1) = vel(n) + ((62.1/vel(n))-0.046-(0.000137*(vel(n)^2)))*dt;
    end
end

% Convert m/s to kmph
vel = vel*3.6;

plot(t,vel);
hold on;
axis([0 10 0 140]);
xlabel('Time(secs)')
ylabel('Velocity(kmph)')
OUTPUT:
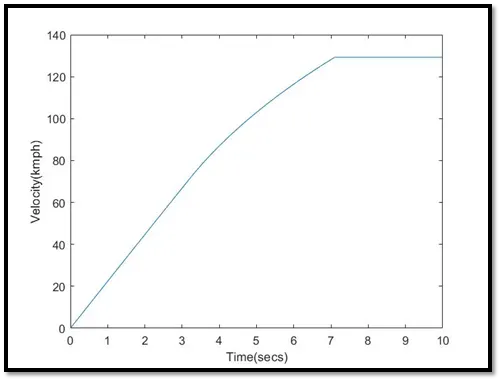
Fig.4. WOT acceleration of GM EV car
GIVEN DATA:
Data change with 5% increase in vehicle parameters,
m = 1617 kg
`mu_r` = 0.0048
A = 1.8 m^2
T_max = 140 Nm
G = 11
`C_d` = 0.19
r = 0.315 m
T = 2938.7/v
`omega` = 733 rad/sec
`eta_g` = 0.95
New equations derived from the above equations,
We put the changed values in this equation -
and obtain,
dv/dt = 2.83 - 0.000130v^2
dv/dt = 59.51/v-0.00474 - 0.000130v^2
v_n+1 = v_n + (2.83 - 0.000130v^2)*`deltat`
v_n+1 = v_n + (59.51/v_n - 0.00474 - 0.000130v_n^2)*`deltat`
Program:
clear all
close all
clc

t = linspace(0,50,201);
vel = 0;
dt = 0.1;

% Velocity at WOT time
for n = 1:200
    if vel(n)<=19.8
        vel(n+1) = vel(n) + (3.11 - (0.000137*vel(n)^2))*dt;
    elseif vel(n)>= 35.8
        vel(n+1)= vel(n);
    else
        vel(n+1) = vel(n) + ((62.1/vel(n)) - 0.046 - (0.000137*(vel(n)^2)))*dt;
    end
end

% Convert m/s to kmph
vel = vel*3.6;

% Plotting orginal parameter
plot(t,vel);
hold on;
axis ([ 0 50 0 140 ]);
xlabel('Time(seconds)');
ylabel('Velocity(kmph)');

% Changed parameter WOT time
for n = 1:200
    if vel(n)<20.99
        vel(n+1) = vel(n) + (2.83 - (0.000130*vel(n)^2))*dt;
    elseif vel(n) >= 35.8
        vel(n+1) = vel(n);
    else
        vel(n+1) = vel(n) + ((59.51/vel(n))-0.00474-(0.000130*vel(n)^2))*dt;
    end
end

% Convert m/s to kmph
vel = vel*3.6;

% Plotting changed parameter
plot(t,vel);
hold on;
axis ([ 0 50 0 140 ]);
xlabel('Time(seconds)');
ylabel('Velocity(kmph)');
grid minor;
title('WOT acceleration of gm ev car');
legend('Original dimensions','Changed dimensions')
OUTPUT:
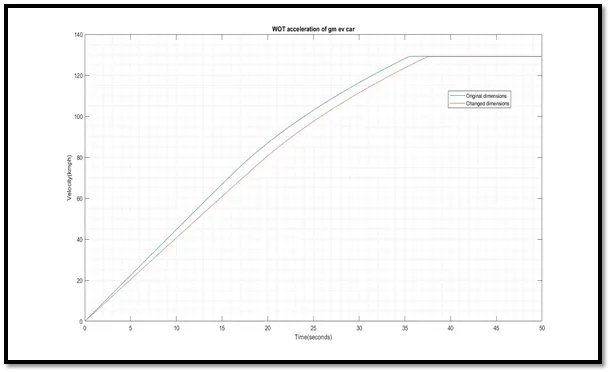
Fig.4.1. WOT acceleration comparison
comparing the obtained data,
| GM EV car WOT time | Time (secs) |
| Performance testing(0-60mph) | 9 secs |
| Matlab code (theoretical value) original values | 20 secs |
| Matlab code (theoretical value) changed values | 25 secs |
From the above results, we can conclude that with the 5% increase in the size of the vehicle, WOT acceleration time also increases.
CONCLUSION:
a) The hill-climbing power ratio for fully loaded to half loaded Tata ultra (T12) truck is 1.523.
b) The minimum height of the flyover is 17.55 m.
c) The stimulation for driver glider model file was successful and the gradient force is 3918 N.
d) With the 5% increase in the size of the vehicle, WOT acceleration time also increases.