EV AND HEV POWERTRAIN STIMULATION COMPARISON IN SIMULINK
AIM:
TO STUDY THE WOT CYCLE OF EV AND HEV POWERTRAIN BLOCK SET THROUGH STIMULATION
OBJECTIVE:
1) To find the difference between the mapped and dynamic model of motor/generator and engine. How to change the model type?
2) To calculate miles per gallon and factors considered to model fuel flow in Simulink.
3) To run the HEV reference application with WOT drive cycle. Change the grade and wind velocity in the environment block. Comment on the results.
4) Keeping all the parameters same, compare the simulated results of HEV with EV powertrain.
STUDY-1: TO FIND THE DIFFERENCE BETWEEN MAPPED AND DYNAMIC MODEL OF MOTOR/GENERATOR AND ENGINE. HOW TO SWITCH THE MODEL TYPE?
Mapped Model -
- Mapped engine model uses a set of steady-state lookup tables to characterize macro-level engine performance.
- The table provides overall engine characteristics like actual torque, fuel flow rate, BSFC, exhaust emissions, efficiency and temperature.
- The mapped motor model uses a motor and its drive electronics operating in the torque control mode whereas, for generator, generator speed and torque is also added.
- The mapped model is used when we need quasi-steady-state and fast engine-level stimulations.
- It also tracks the torque reference demand, motor response and drives response time constant.
- It doesn't require engine subsystems dynamic characteristics.
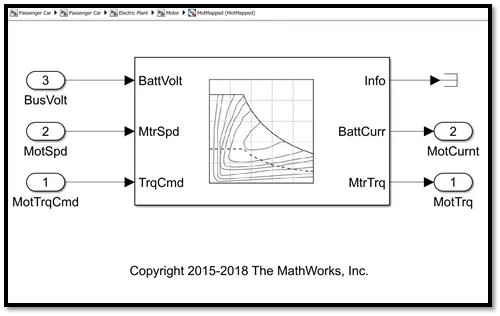
Fig.1.1 Mapped Motor
Dynamic Model -
- In this model, engine behaviour of every individual component in a dynamic state is considered mostly into two parts, airflow intake and turbocharger dynamics.
- This model helps in designing the controls, estimator and diagnostic algorithms that depend on dynamic sub-system states.
- The model considers engine characteristics that are separated into lower-level components, combing the effects of all lower-level components give the overall dynamic behaviour of the system.
- For dynamic motors/generators, the effects of lower-level components like – interior PM controller, three-phase voltage source inverters, etc contributes to the overall dynamic results of the system.
- It requires more stimulation time than the mapped model.
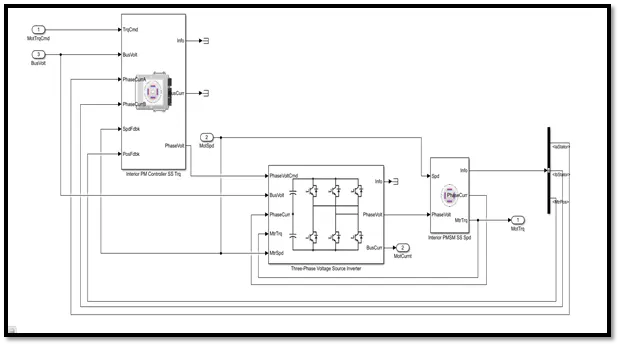
Fig.1.2. Dynamic Motor
Switching Models -
Open HEV/EV reference application model, the switching of mapped to dynamic state or vice-versa can take place as follows -
Method 1 -
- Click on the modelling on the top bar of the Simulink window and select model explorer.
- A model explorer window opens up, we will be able to see the block parameters, data type and mapped and dynamic model types of engine, generator and motor.
- Select the variant and apply the selected model type to run the desired stimulation.
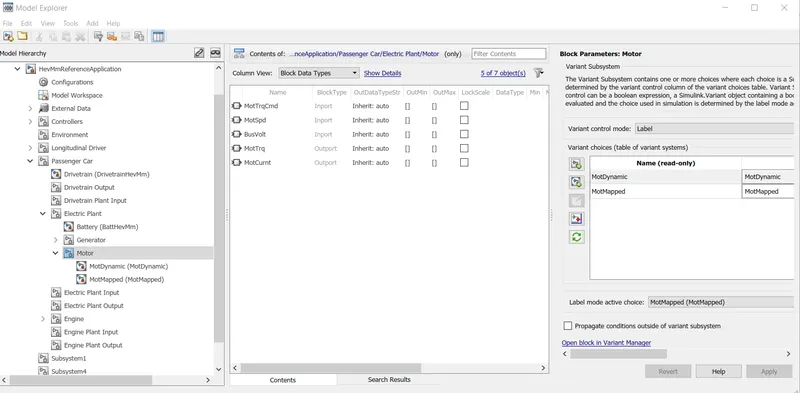
Method 2 -
- Open the passenger car and right-click on the sub-system that is needed to be changed.
- Select the ‘variant’ option, click on ‘open’.
- Select the model which needs to be changed and activate it to run the desired stimulation.
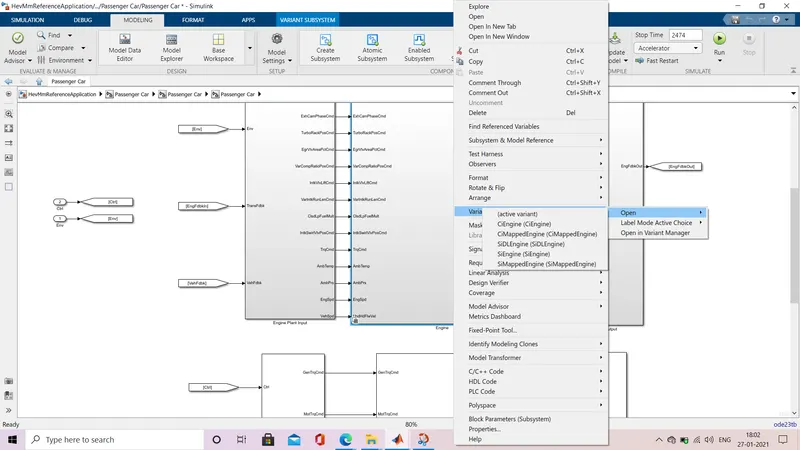
STUDY-2: TO CALCULATE MILES PER GALLON AND FUEL FLOW RATE IN SIMULINK
Miles per gallon (mpg) is fuel economy rating, distance covered by the car on a gallon of fuel/gas/diesel. Fuel consumption is a key factor in vehicle performance.
The energy used in a hybrid vehicle is from battery and fuel, thus we take the unit as (m^3/gal).
In this model fuel consumption is calculated in miles per gallon (mpg) through performance calculation block.
The block derives the performance of the vehicle over a distance on mileage and fuel consumption by considering these factors -
Vehicle Speed, Fuel Volume used, Battery Power, Vehicle load, Environment conditions, Driving cycle, etc.
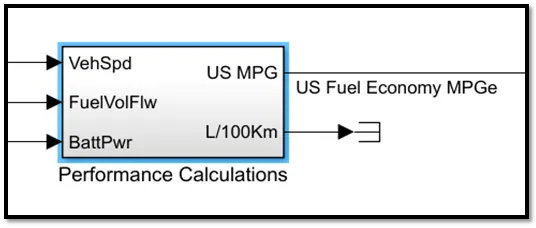
Fig.2.1. Performance calculation block for HEV
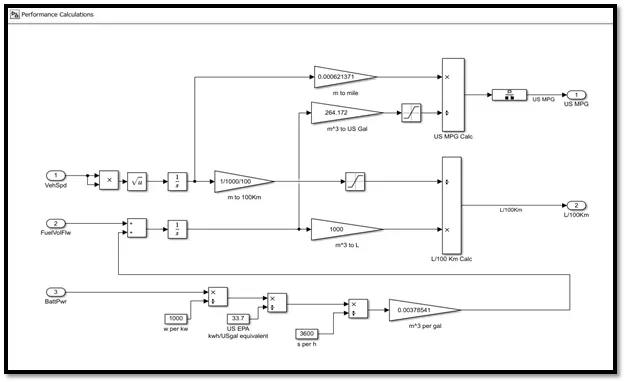
Explanation -
1) Battery Power is taken as watt (W) and divided by 1000 to convert it into kilowatt (KW).
2) Now the power is divided by 33.7 (KWh/USgal).
3) Convert (USgal/h) to (USgal/sec) by dividing 3600.
4) The obtained value is multiplied by 0.00378541 for conversion into (m^3/s).
5) The value is taken and added with the fuel volume flow and integrated.
6) Vehicle speed for every sec is also considered by squaring them and then taking the square root of them, removing the negative sign.
7) Integrate it and the obtained value will be in (m), multiply it with 0.00062137 for converting meters into miles.
8) The output of the fuel volume is multiplied by 264.172, converting m^3 to the gallon.
9) Total miles travelled divided by the total gallon of fuel used gives us the miles per gallon.
Block Diag. -
STUDY-3: TO RUN THE HEV REFERENCE APPLICATION WITH WOT DRIVE CYCLE, CHANGE THE GRADE AND WIND VELOCITY IN THE ENVIRONMENT BLOCK
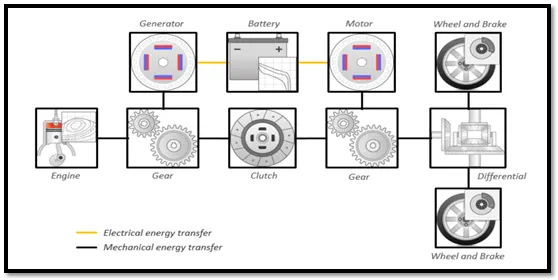
HEV Powertrain -
Simulink Model -
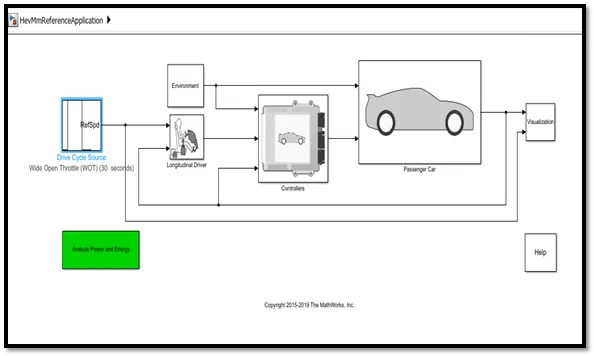
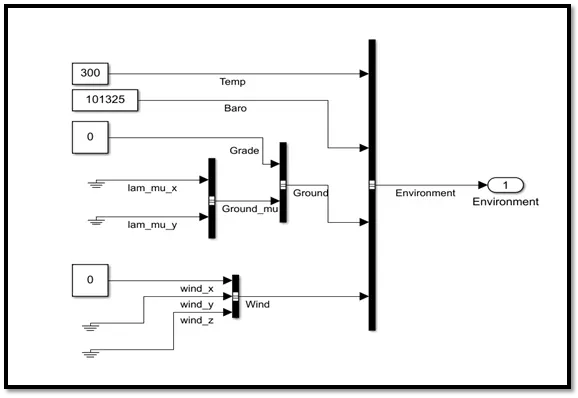
Environment block -
Output -
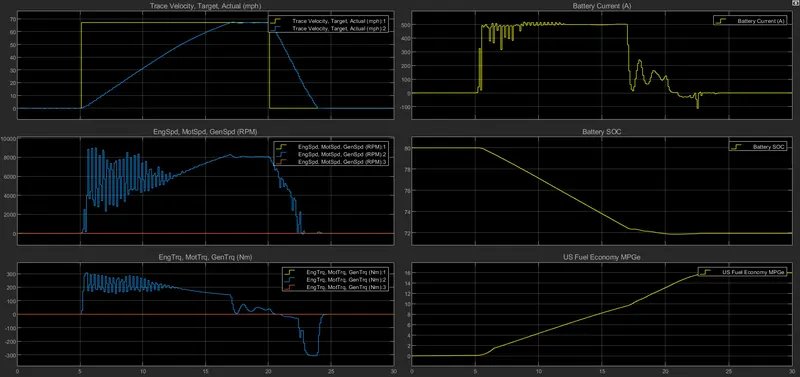
Assuming the default stimulation time for WOT cycle as 30 secs.
Conclusion: From the graphs, we can conclude that -
- The vehicle is at rest from 0-5 secs and then accelerates to 70 mph.
- After 20 secs, it starts deaccelerating and comes to stop at 24 secs.
- We can observe that engine plays no role here, the load demand is met by the battery.
- When the vehicle is accelerated, the state of charge of the battery is reduced from 80% to 72%.
- The maximum current used during the acceleration is near around 500 Amps and during acceleration, the current used goes negative around 100 Amps which is being used to charge the batteries.
- During deacceleration, the torque also goes negative showing the regenerative braking is used to charge the batteries.
- The fuel economy for this drive cycle stimulation is around 15 MPGe.
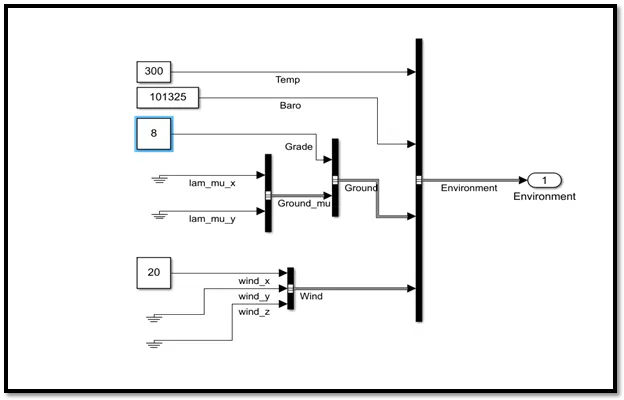
Changed Environment block -
Keeping all the other parameters the same but changing the grade and wind velocity in the environment block.
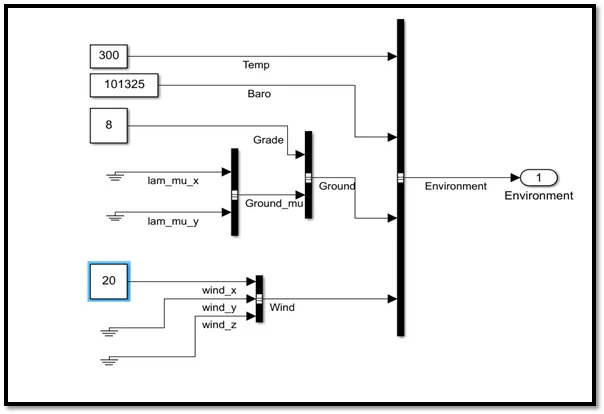
The assumed value for the grade is set as 8 and the wind velocity is 20 mph.
Output -
Conclusion: From the graphs, we can conclude that -
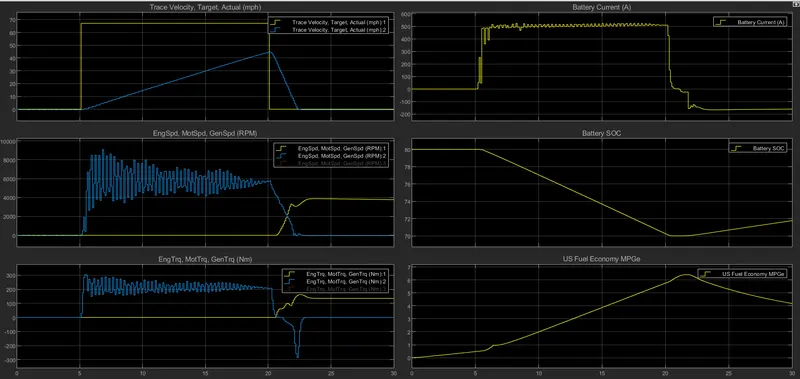
- The maximum speed obtained by the vehicle here is 45 mph at 20 secs.
- We can observe that the engine is also working because of the gradeability provided, the maximum engine speed obtained here is around 4000 rpm.
- The maximum torque produced by the engine is around 150 Nm and for the motor is 300 Nm, the vehicle has extra torque to overcome the grade and wind velocity load experienced by the vehicle.
- The maximum current used by the vehicle is around 510 Amps and when the brakes are applied the regenerative braking comes into action, the current goes negative around 150 Amps which is used for charging the batteries.
- We can also note that the state of charge is reduced from 80% to 70% and then the gradual increase of charge to 71% at 23secs due to regenerative braking.
- The fuel economy for this drive cycle stimulation is around 6.2 MPGe.
STUDY-4: COMPARE THE STIMULATED RESULTS OF EV AND HEV POWERTRAIN, KEEPING ALL THE PARAMETERS SAME
In study 3, we stimulated HEV reference application in Simulink.
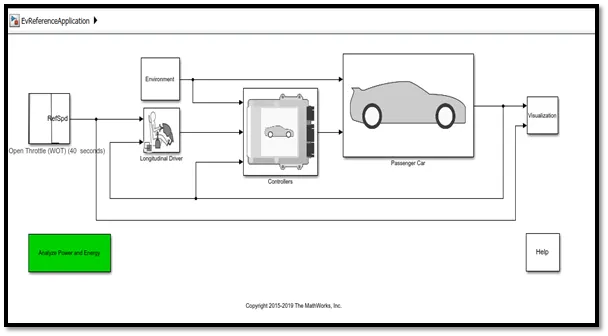
Here we will stimulate EV reference application in Simulink by keeping all other parameters same.
EV Powertrain -
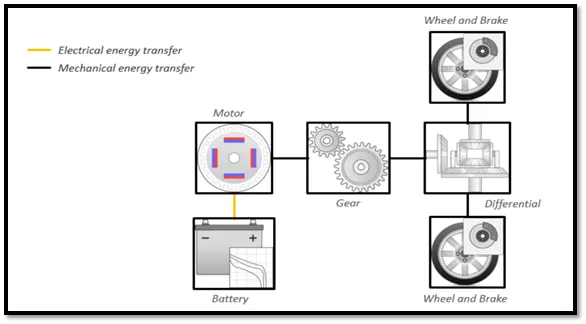
EV Simulink Model -
EV Environment block -
Output -
Assuming the default stimulation time for WOT cycle as 40 secs.
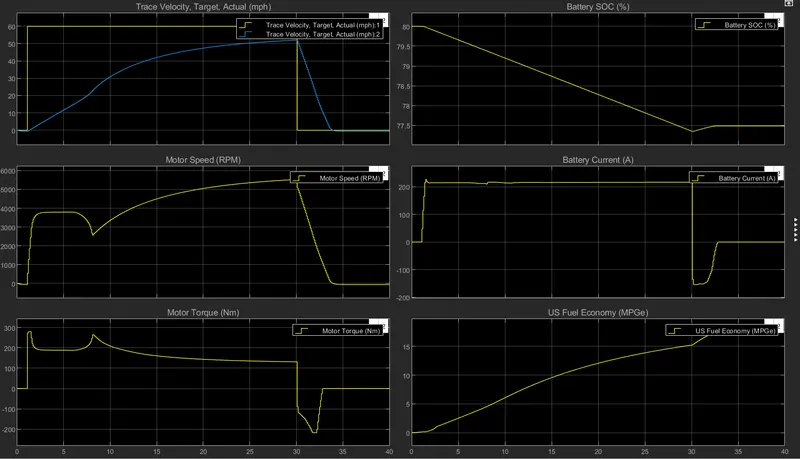
Conclusion: From the graphs, we can conclude that -
- The vehicle starts at 1 sec and accelerates till 30 secs to attain its maximum speed 52 mph.
- Due to gradeability and wind velocity, the motor attains its maximum speed around 5500 rpm at 30sec.
- We can see that the maximum torque obtained is during the starting of acceleration (280 Nm) and when the vehicle deaccelerates, the motor starts working as the generator and maximum negative torque is produced around (210 rpm).
- The state of the charge of the battery is reduced from 80% to 77% and during regenerative braking, a gradual increase in the charge to 77.5%.
- The maximum current used by the vehicle during acceleration is 210 Amps and when it deaccelerates the current goes negative 150 Amps which is used for charging the batteries.
- The fuel economy for this drive cycle stimulation is around 17 MPGe.
Comparison -
- HEV default WOT simulation run time is taken as 30 sec.
- EV default WOT simulation run time is taken as 40 sec.
- The assumed values are grade (8) and wind velocity (20 mph).
Comparison of HEV and EV reference application stimulation,
- The motor peak of EV (5500 rpm) is less than HEV (9000 rpm).
- The maximum speed obtained by HEV at full throttle is 45 mph while for EV is 52 mph.
- The total torque required by EV is comparably less than HEV motor and engine torque combined. Also, there is no fluctuation observed in the magnitude of EV torque and speed.
- The state of charge increase during regenerative braking is more in HEV than EV.
- HEV requires more current (510 Amps) for starting the vehicle whereas EV requires only (210 Amps) but the HEV has better regenerative efficiency than EV.
- The fuel economy of the EV (17 MPGe) is more efficient than HEV (6.2 MPGe).
CONCLUSION: HENCE WE HAVE SUCCESSFULLY STUDIED THE POWERTRAIN OF EV AND HEV THROUGH REFERENCE APPLICATION.