Gate Valve Parametric Study
AIM
Parametric study on the Gate Valve.
OBJECTIVES
- To understand the parametric study and perform simulation on the gate valve by setting the opening from 10% to 80%.
- Obtain the mass flow rates at the outlet for each design point.
- Calculate the flow coefficient and flow factor for each opening and plot the graph.
- Discuss the results of the mass flow rate and flow coefficient.
INTRODUCTION
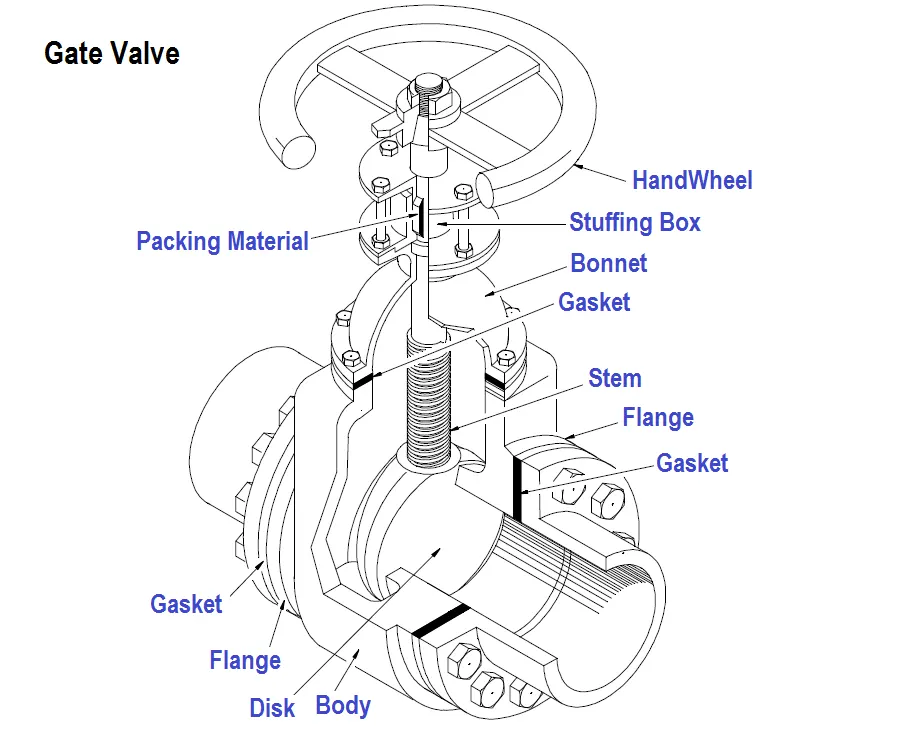
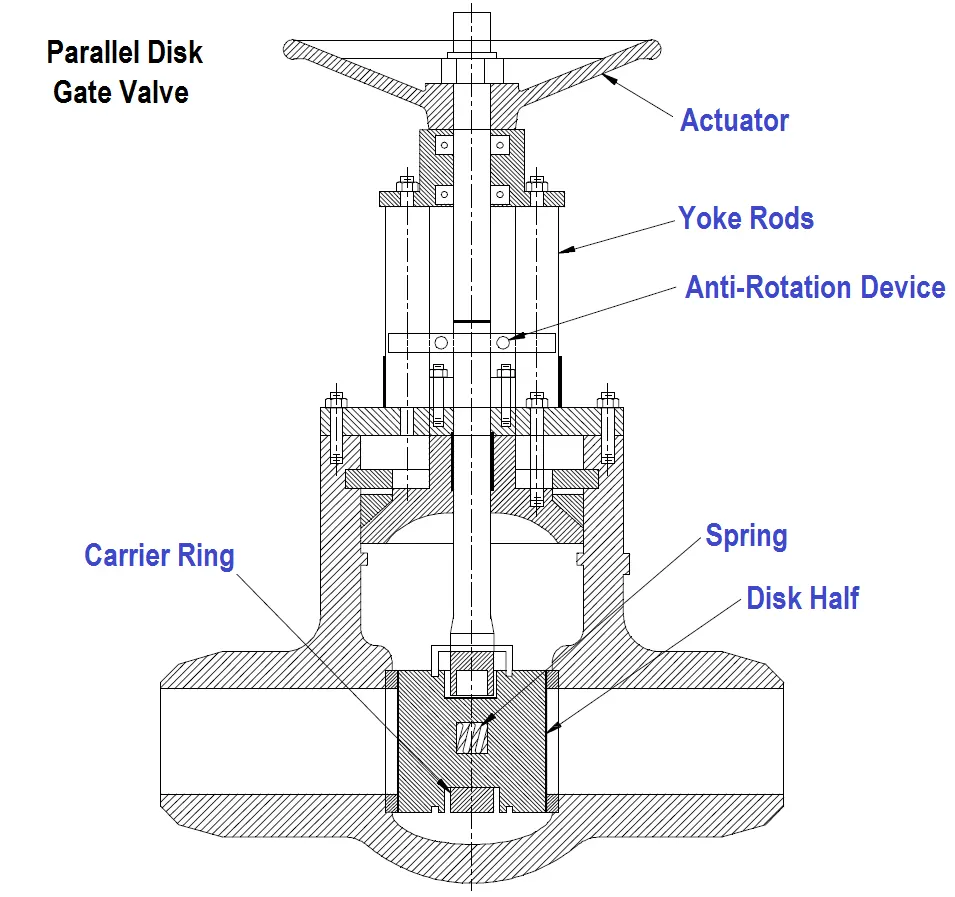
A gate valve is a valve that opens by lifting a barrier (gate) out of the path of the fluid and it also known as a sluice valve. Generally, Gate valves require very little space along the pipe axis and hardly restrict the flow of fluid when the gate is fully opened. The gate faces can be parallel but are most commonly wedge-shaped.
Use of Gate Valve
Gate valves are used to shut off the flow of liquids rather than for flow regulation. When fully open, the typical gate valve has no obstruction in the flow path, resulting in very low flow resistance. The size of the open flow path generally varies in a nonlinear manner as the gate is moved. This means that the flow rate does not change evenly with stem travel. Depending on the construction, a partially open gate can vibrate from the fluid flow.
Gate valves are mostly used with larger pipe diameters (from 2" to the largest pipelines) since they are less complex to construct than other types of valves in large sizes.
At high pressures, friction can become a problem. As the gate is pushed against its guiding rail by the pressure of the medium, it becomes harder to operate the valve. Large gate valves are sometimes fitted with a bypass controlled by a smaller valve to be able to reduce the pressure before operating the gate valve itself.
Gate valves without an extra sealing ring on the gate or the seat are used in applications where minor leaking of the valve is not an issue, such as heating circuits or sewer pipes.
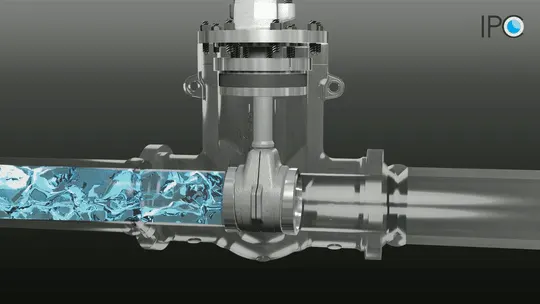
Simulation in Fluent
Modeling: 3D Geometry was created with the use of any CAD software and import that 3D geometry in the Ansys Spaceclaim.
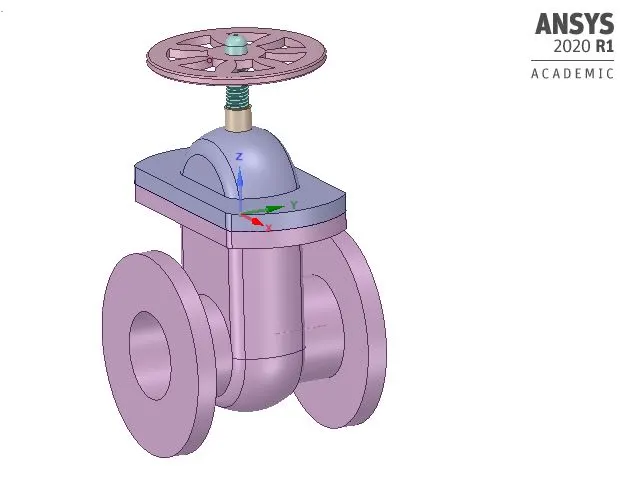
Geometry has been increased from both sides by 800 mm using a pull command so that fluid volume and fluid flow analysis carried out.
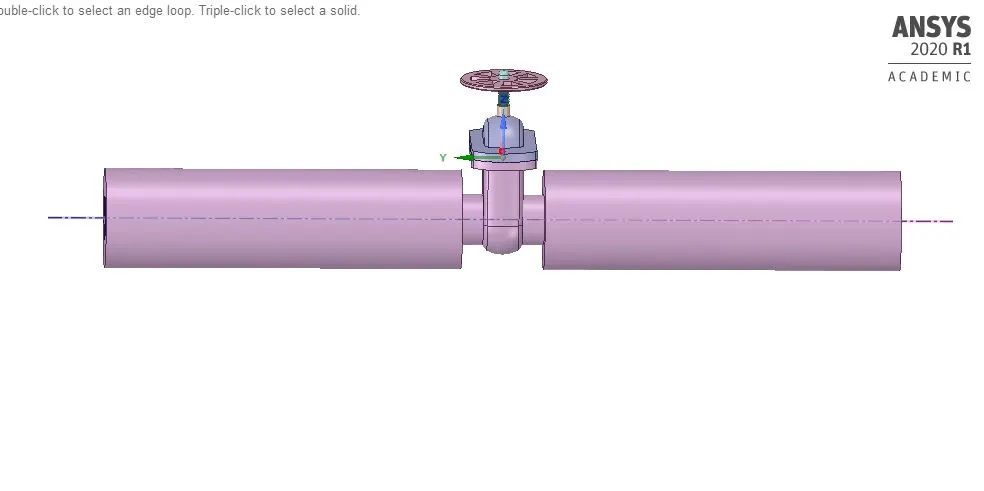
Extract the volume of this geometry using volume extraction.
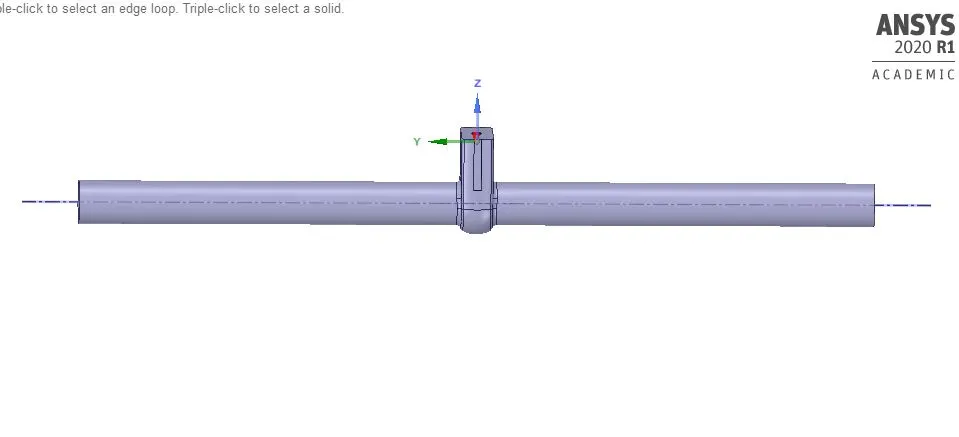
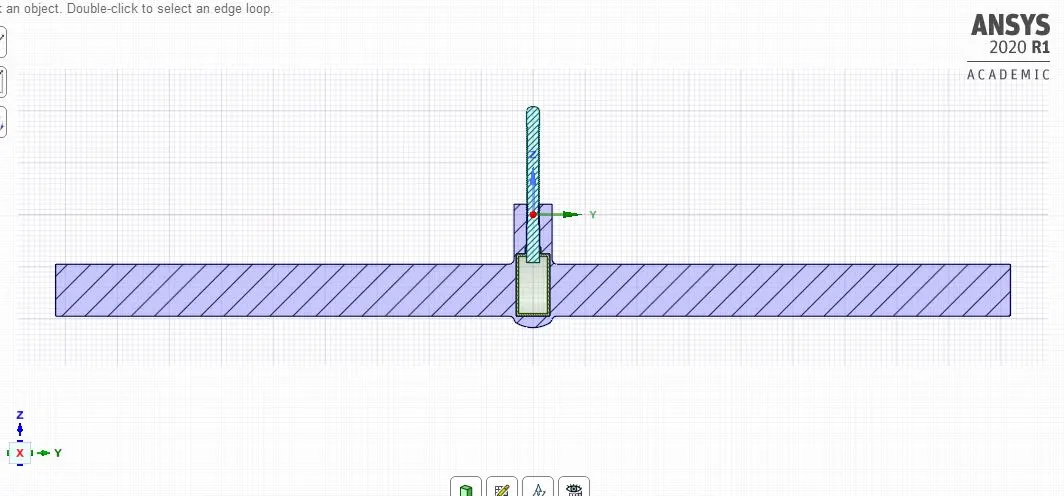
Check the crossection that wheater it is correct or not.
Meshing:
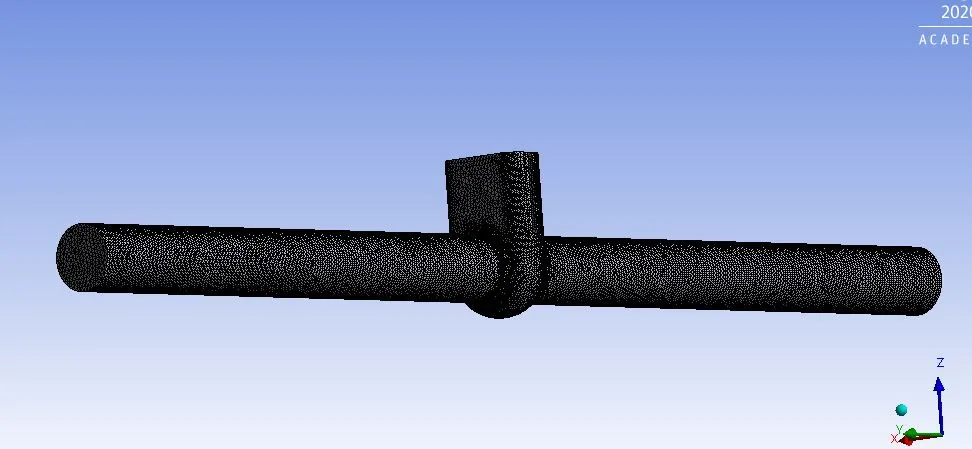
Open the Ansys Meshing and generate the mesh.
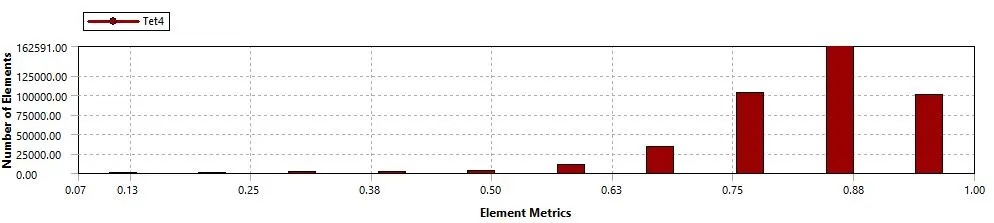
Mesh size: 0.009289
Nodes: 83791
Elements: 414055
Setting Up physics and solving:
Check the mesh first after that defines the solver.
Solver type: Pressure Based Solver
Gravity: Enable (-9.81 m/s2, Z- direction)
Solver: Steady State
Viscous Model: k-epsilon Realizable
Wall Function: Scalable wall function
Material: Water-liquid
Cell zones: Volume-volume > fluid > water
Boundary Conditions:
Inlet: Pressure Bc
= 10 Pa
Outlet: Pressure Bc
= 0 Pa
Inilitilazation: Standard
Compute from the inlet.
As we doing standard initialization compute from the inlet at 10 Pa pressure, There will be the velocity appears at the inlet in y-direction for different lifts. And based on this velocity Reynolds's number is calculated and the turbulence model is selected.
Parametric Study:
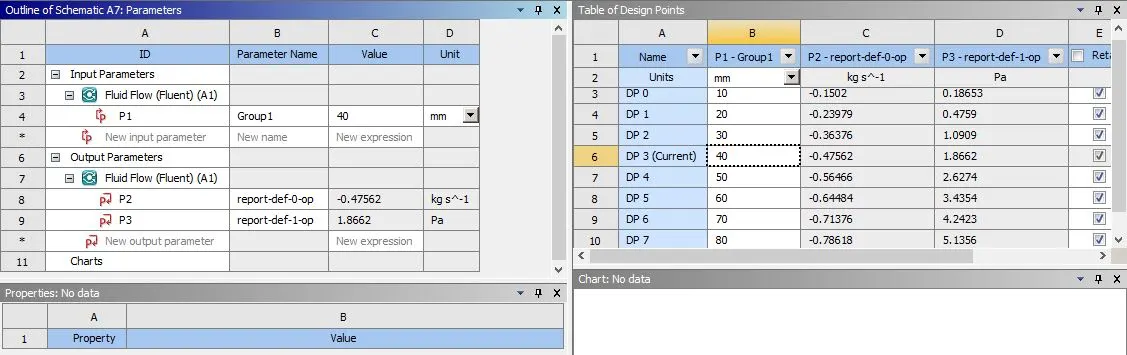
Set up the simulation for the first case i.e. 10 mm lift of the disk and set the input parameter for this disk lift. Create an appropriate mesh for this setup and open the fluent. After defining the solvers and boundary conditions start the standard initialization compute from the inlet. Define a new definition that belongs to the mass flow rate at the outlet and also defines here the outlet parameter and runs the simulation for approx 300 iterations. After that open the parameter window and define the other input parameter (Disk lift: 20,30,40,50,60,70,80), which we want to simulate and click on update. That whole process doing a parametric study and gives the mass flow rates of different disk lifts.
Case 1: 10 mm Lift
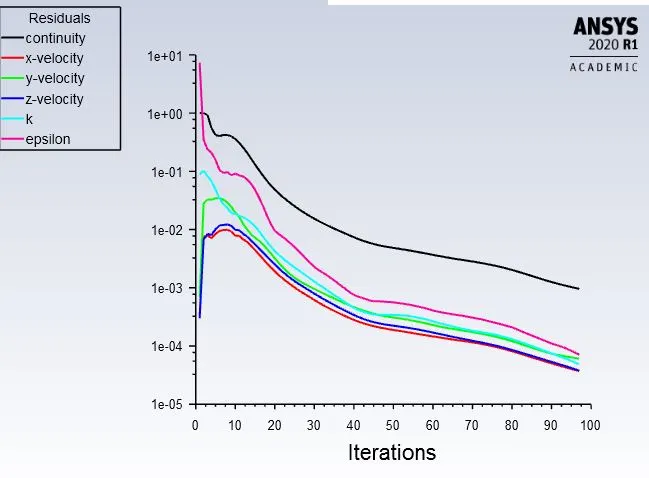
a) Residual Plot
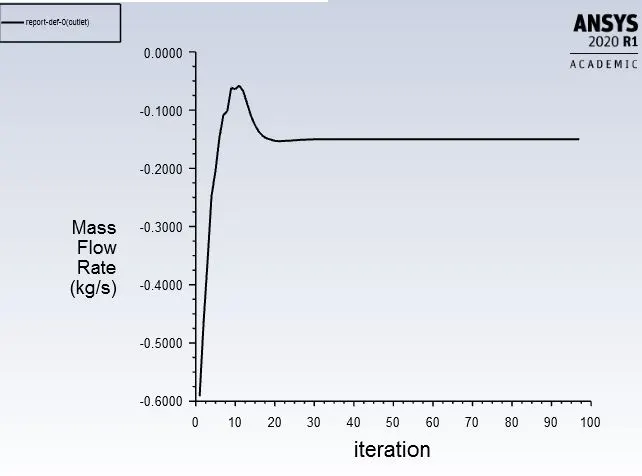
b) Mass Flow Rate
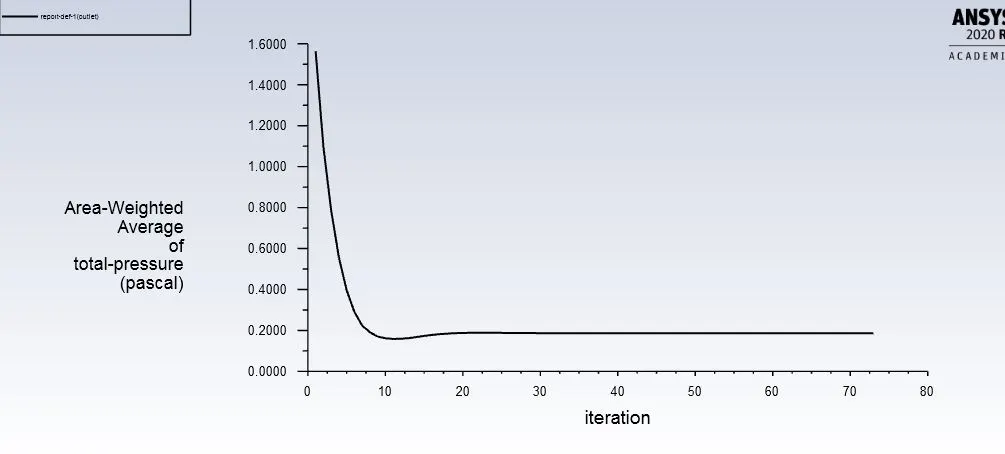
c) Total Pressure at Outlet
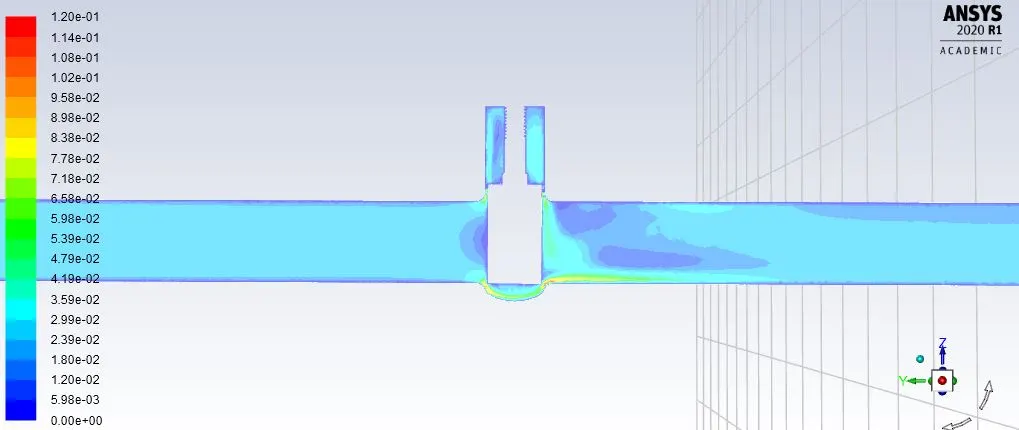
d) Velocity Contour
Case 2: 20 mm Lift
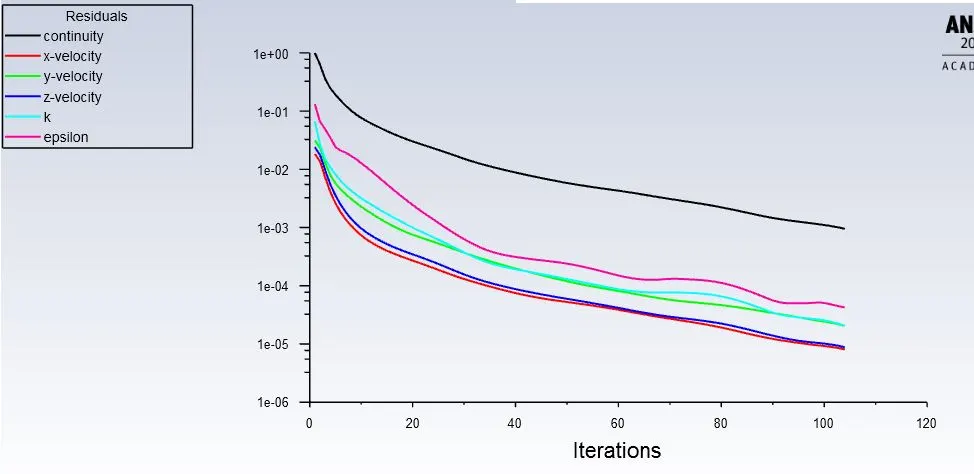
a) Residual Plot
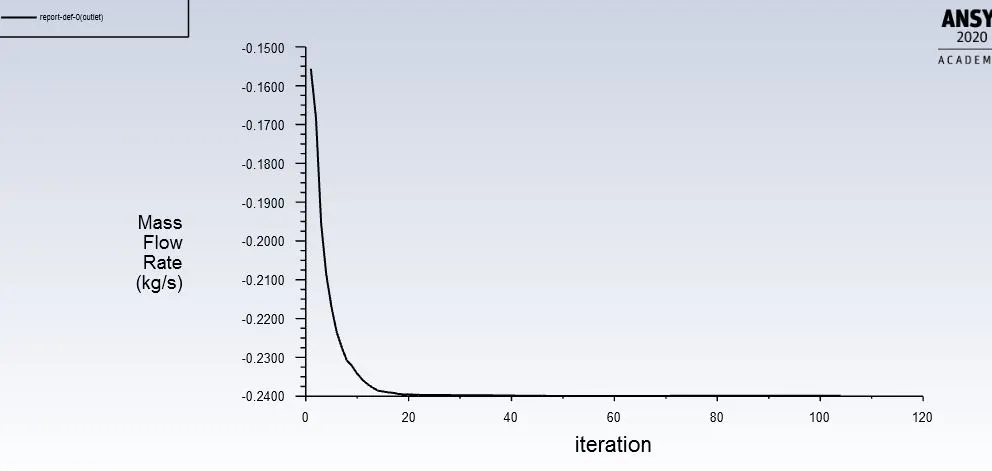
b) Mass Flow Rate
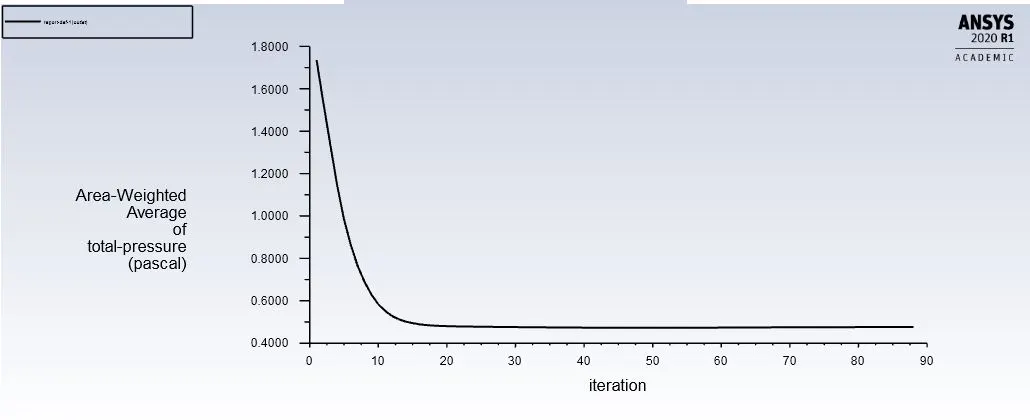
c) Total Pressure at Outlet
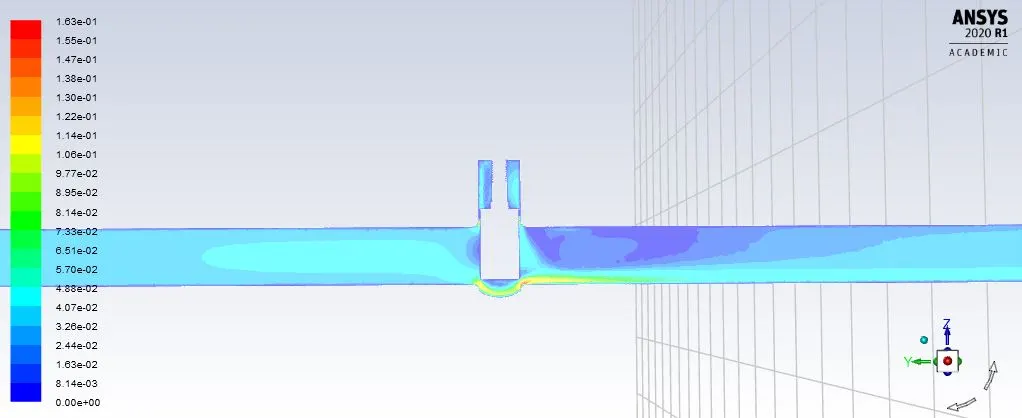
d) Velocity Contour
Case 3: 30 mm Lift
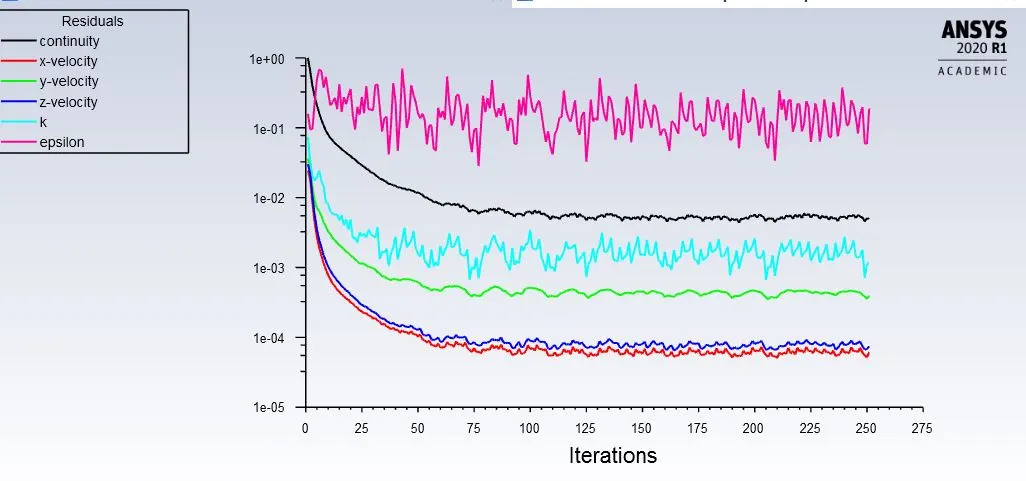
a) Residual Plot
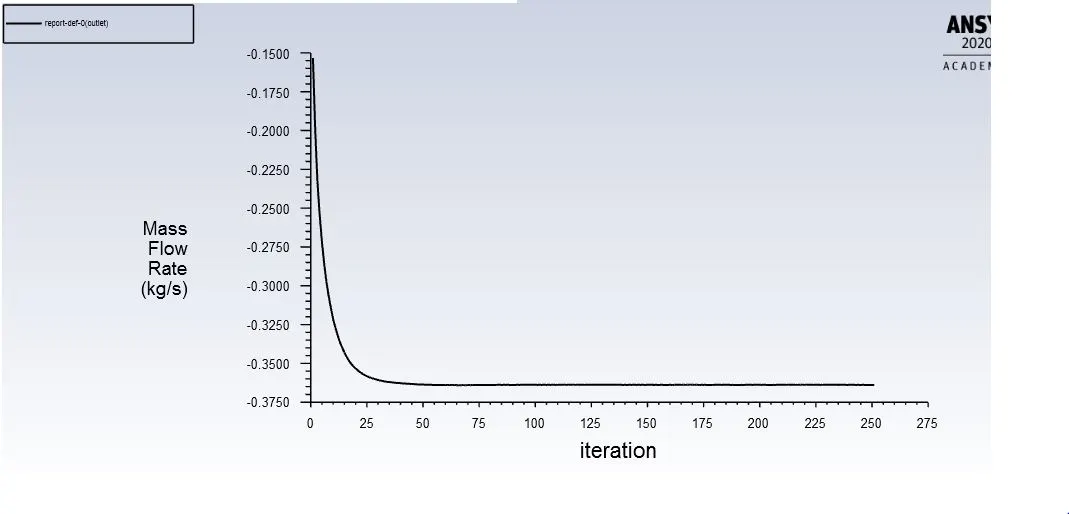
b) Mass Flow Rate
c) Total Pressure at Outlet
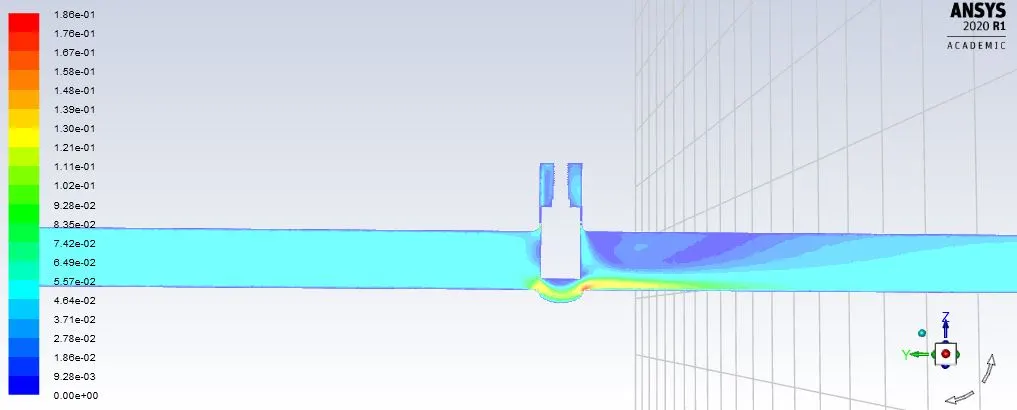
d) Velocity Contour
Case 4: 40 mm Lift
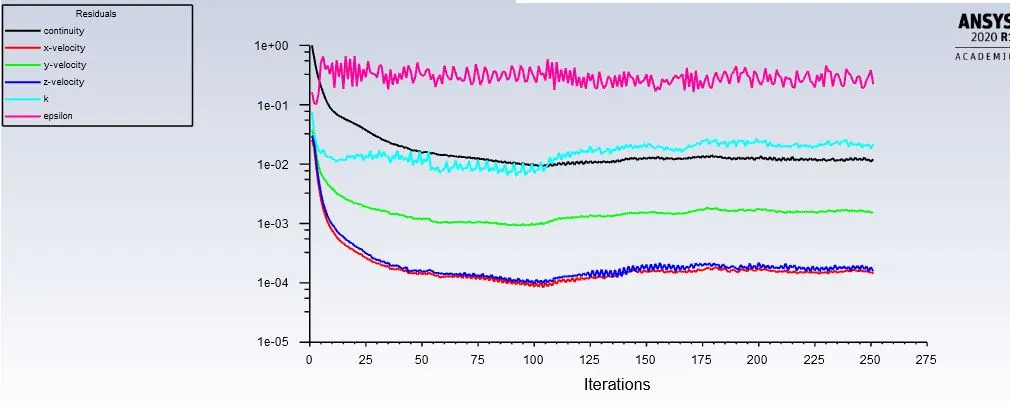
a) Residual Plot
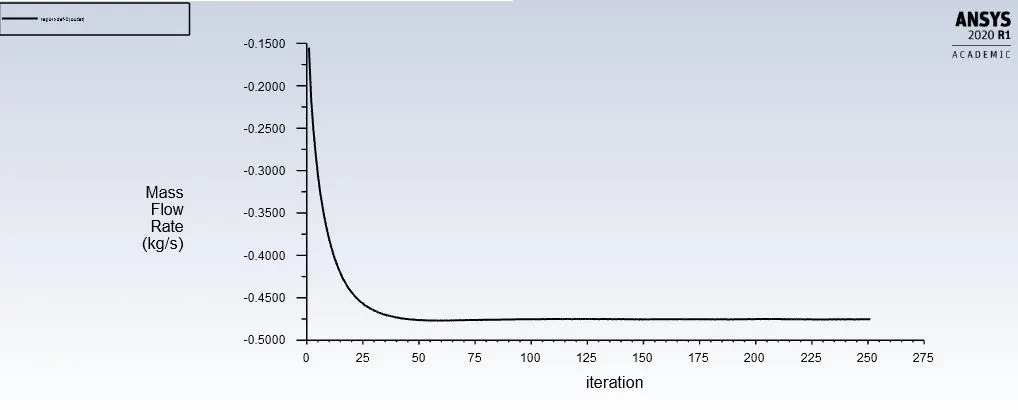
b) Mass Flow Rate
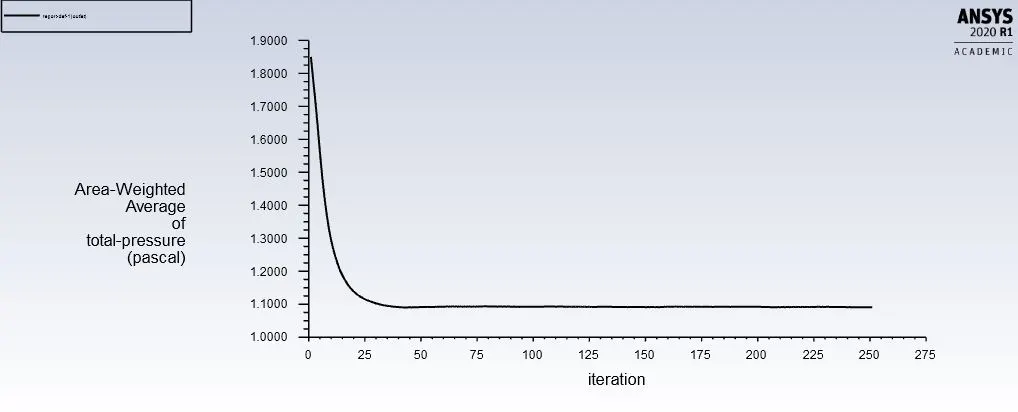
c) Total Pressure at Outlet
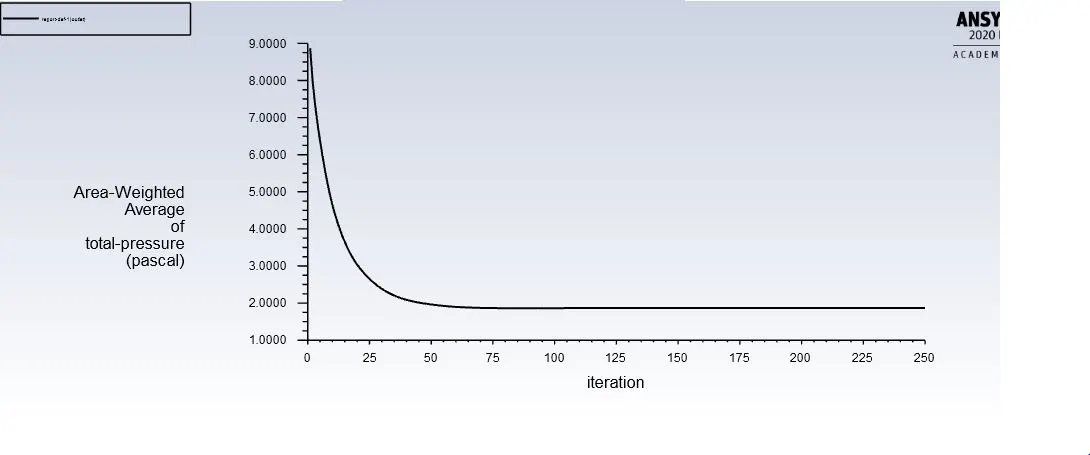
d) Velocity Contour
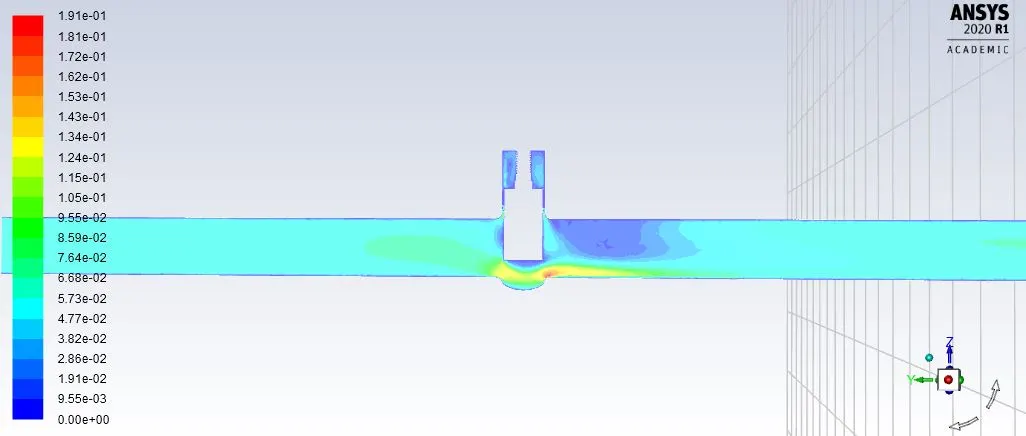
Case 5: 50 mm Lift
a) Residual Plot
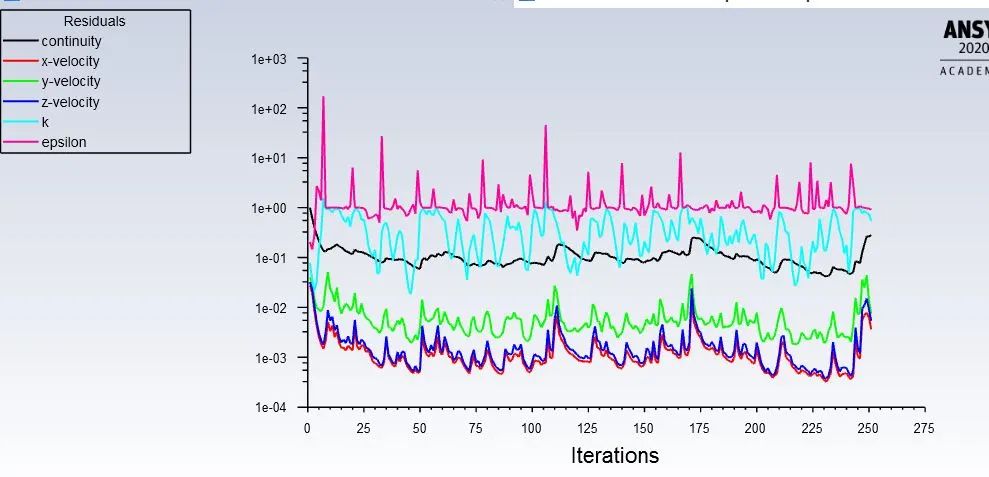
b) Mass Flow Rate
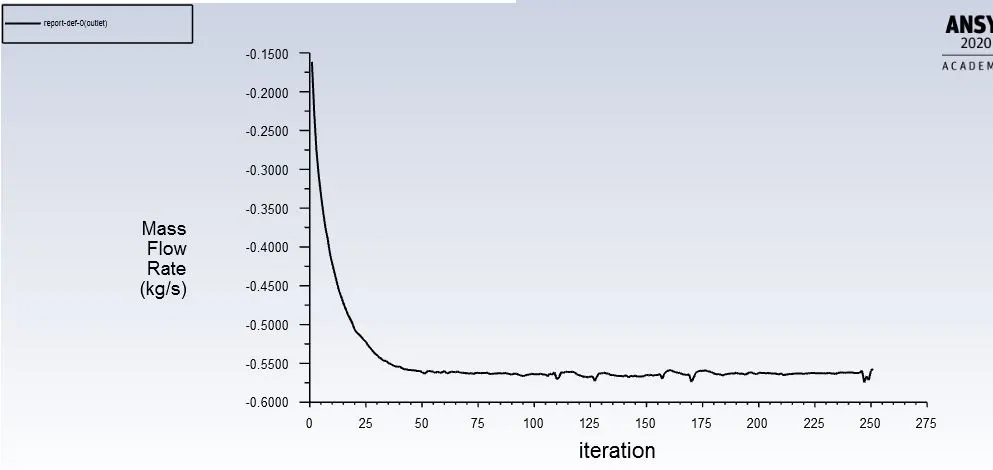
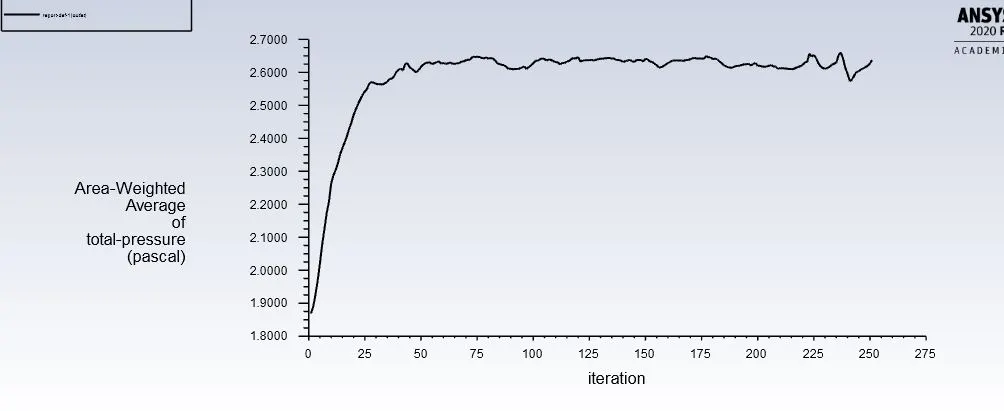
c) Total Pressure at Outlet
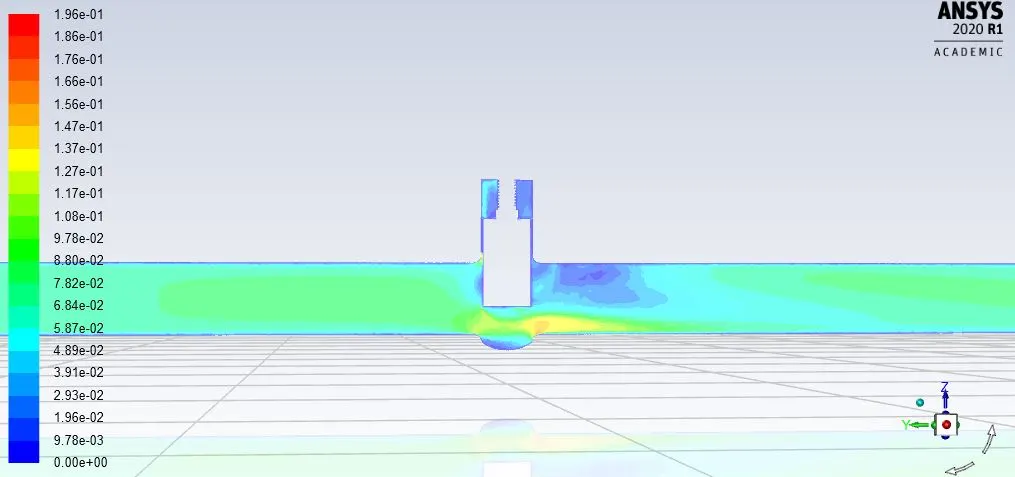
d) Velocity Contour
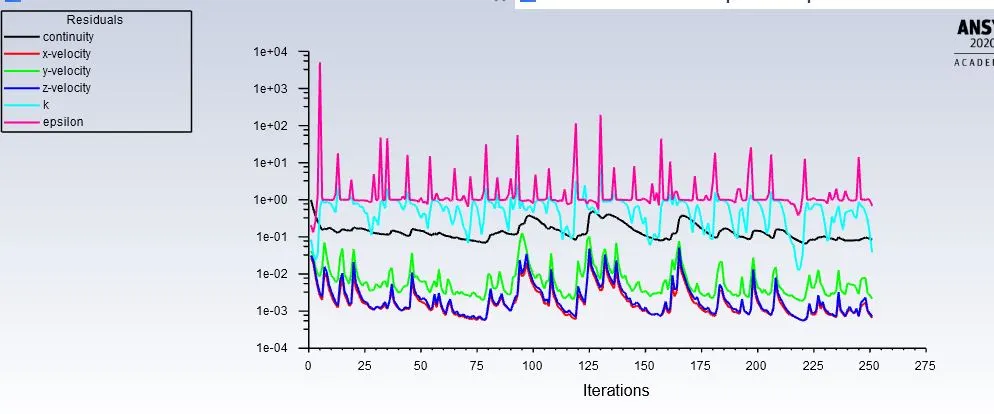
Case 6: 60 mm Lift
a) Residual Plot
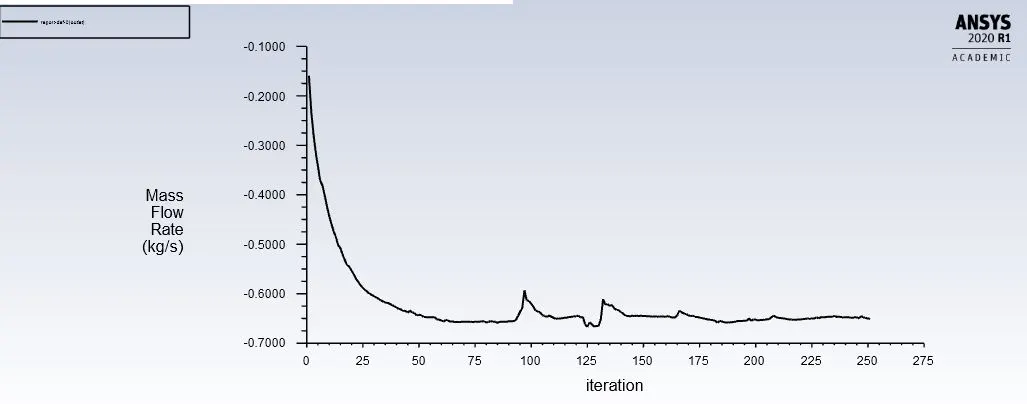
b) Mass Flow Rate
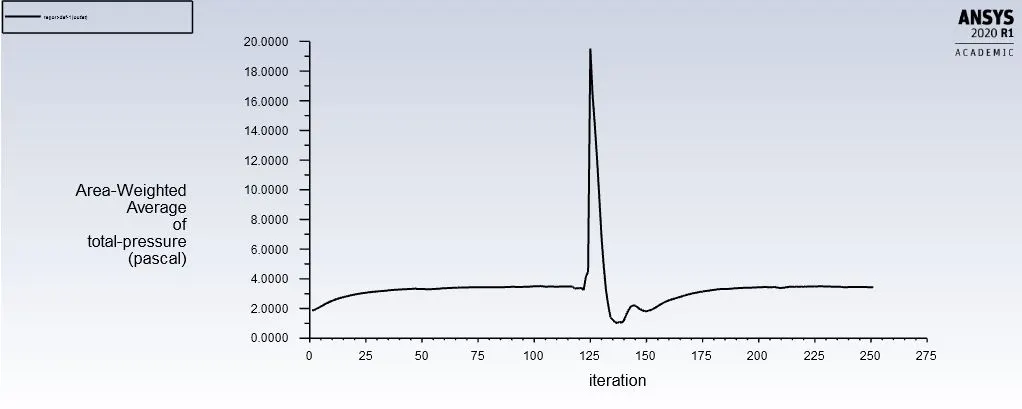
c) Total Pressure at Outlet
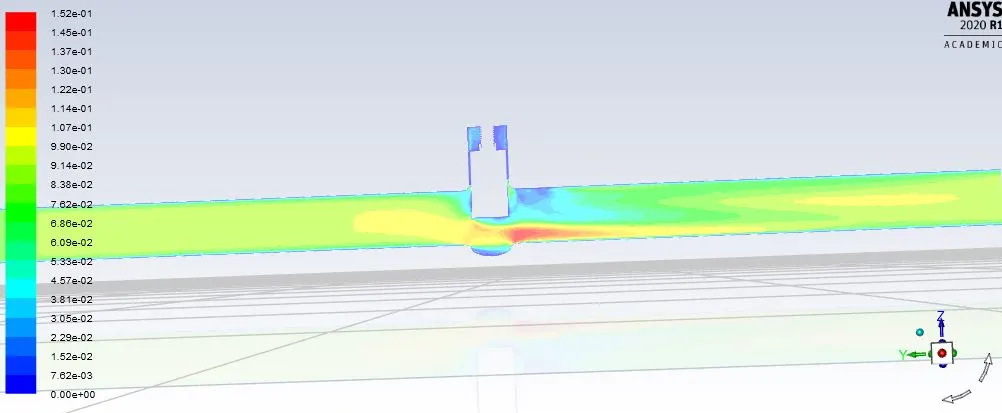
d) Velocity Contour
Case 7: 70 mm Lift
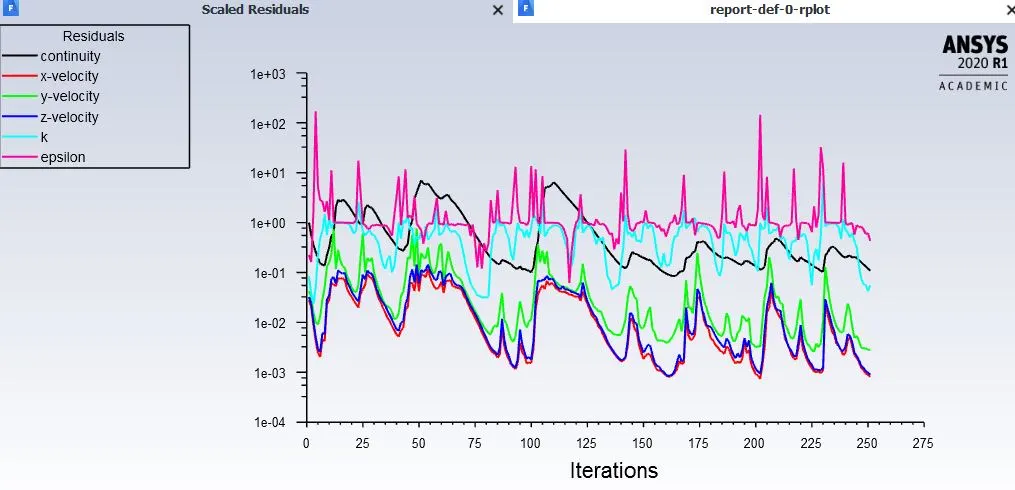
a) Residual Plot
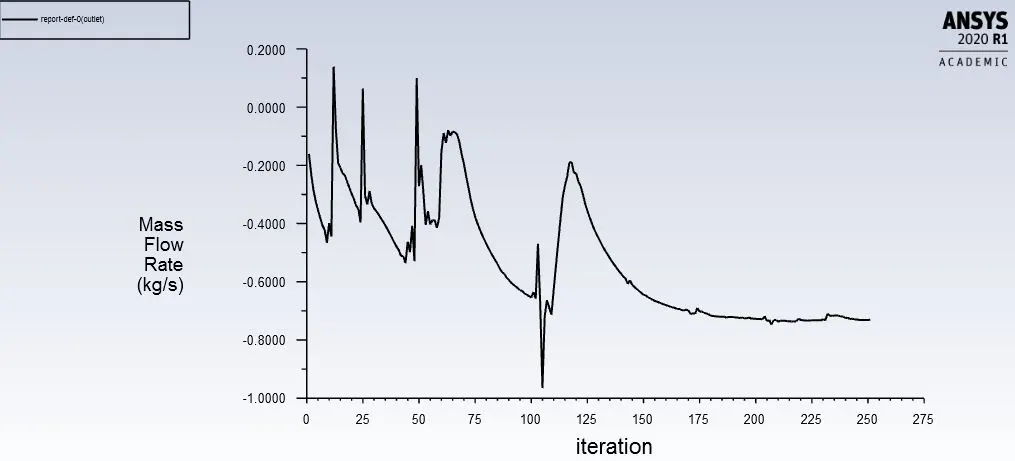
b) Mass Flow Rate
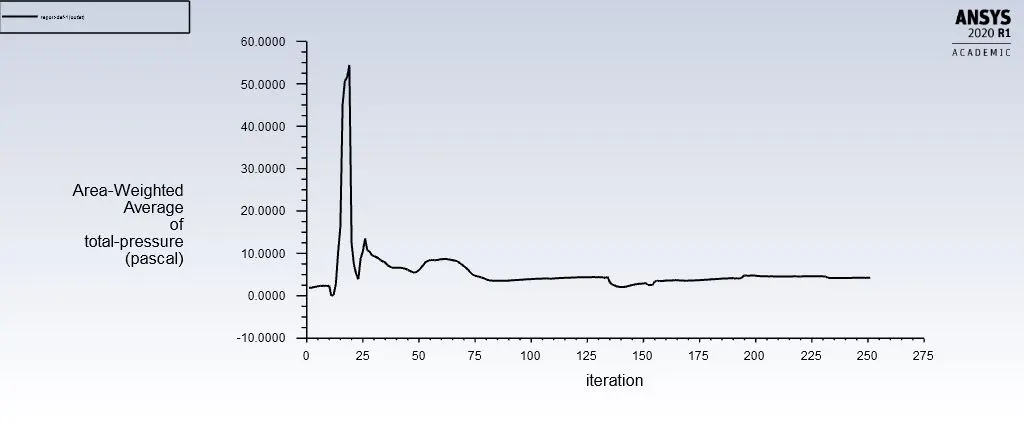
c) Total Pressure at Outlet
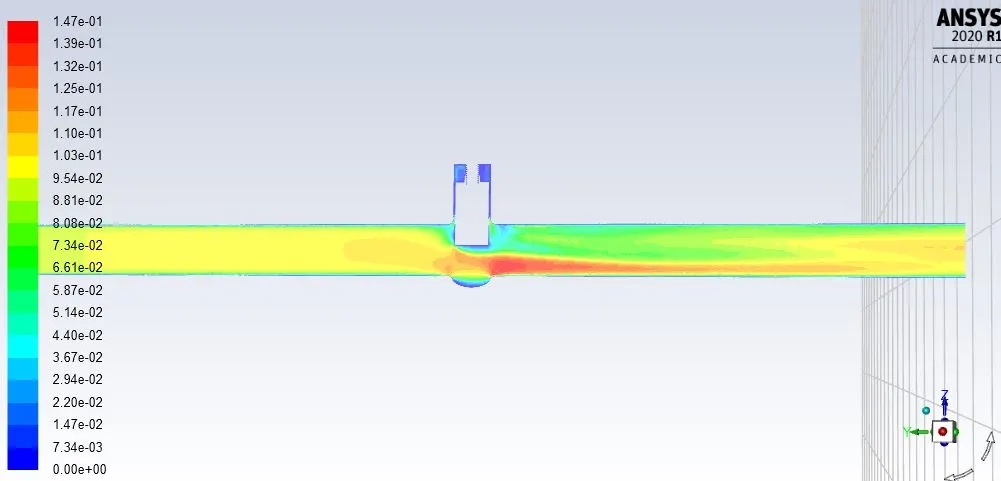
d) Velocity Contour
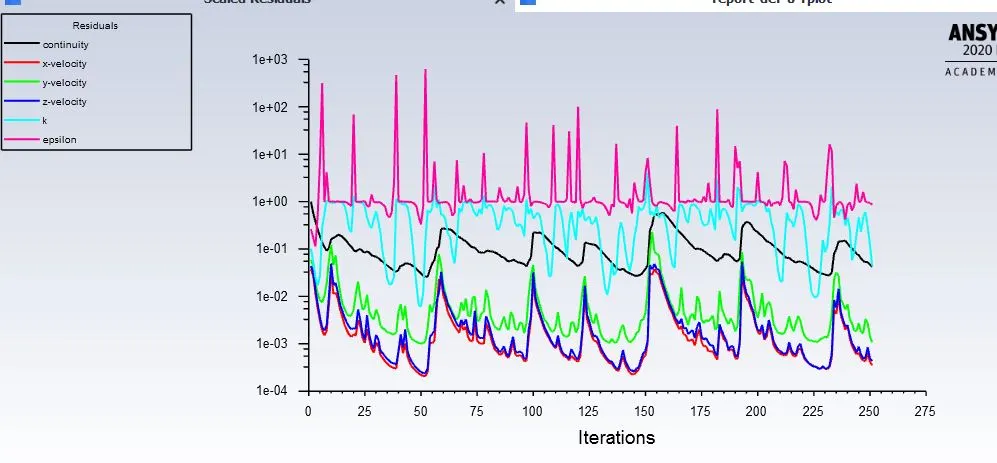
Case 8: 80 mm Lift
a) Residual Plot
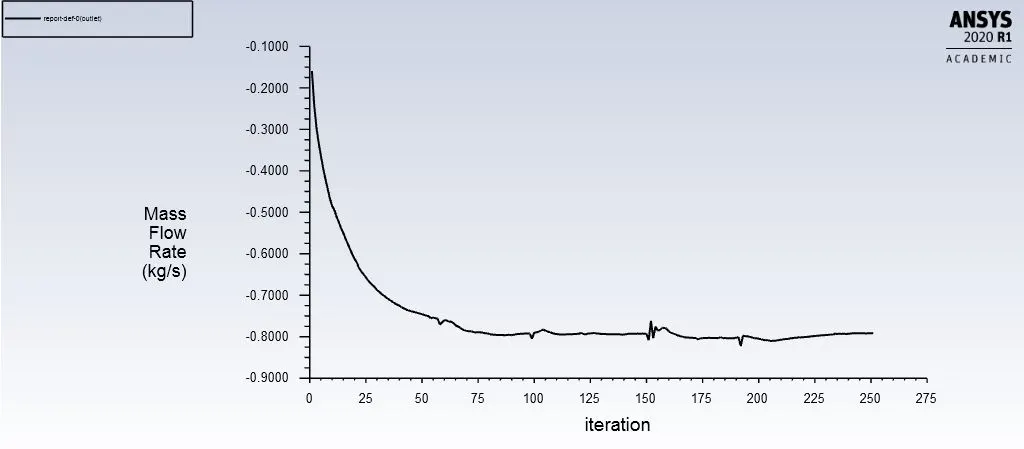
b) Mass Flow Rate
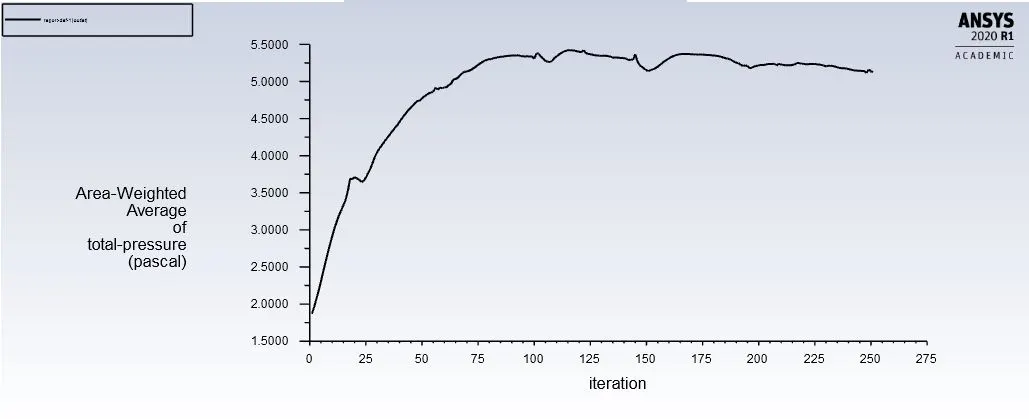
c) Total Pressure at Outlet
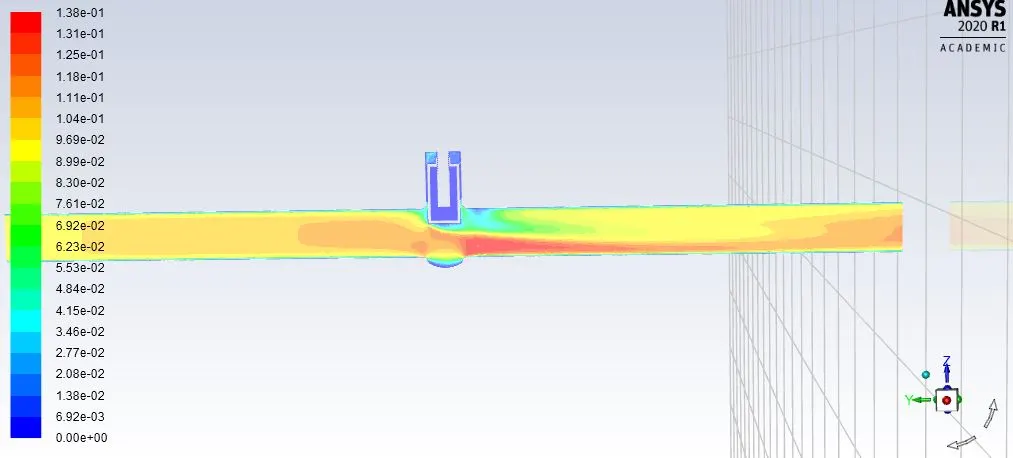
d) Velocity Contour
Flow-Factor (kv):
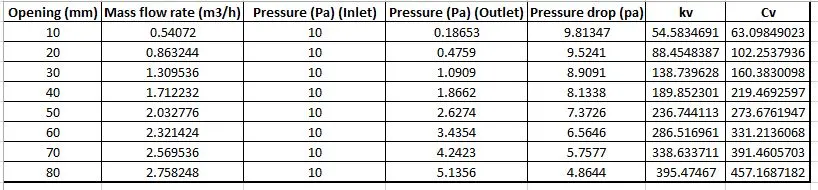
A flow factor kv is the flow coefficient in the metric units. It is defined as the flow rate in cubic meters per hour of water at a temperature of 16º celsius with a pressure drop across the valve of 1 bar.
Flow-coefficient(Cv):
Cv is the flow coefficient in imperial units. It is defined as the flow rate in US Gallons per minute [gpm] of water at a temperature of 60º fahrenheit with a pressure drop across the valve of 1 psi. It is used to determine a valve's flow under various conditions and to select the correct valve for a flow application.
`k=Qsqrt(frac{Sg}{DeltaP}`
where,
k= flow coefficient kv or Cv
Q= flow rate
Sg= Specific Gravity (1 for water)
`DeltaP`= Total Pressure Drop
Relationship Between kv and Cv:
Cv = kv*1.156
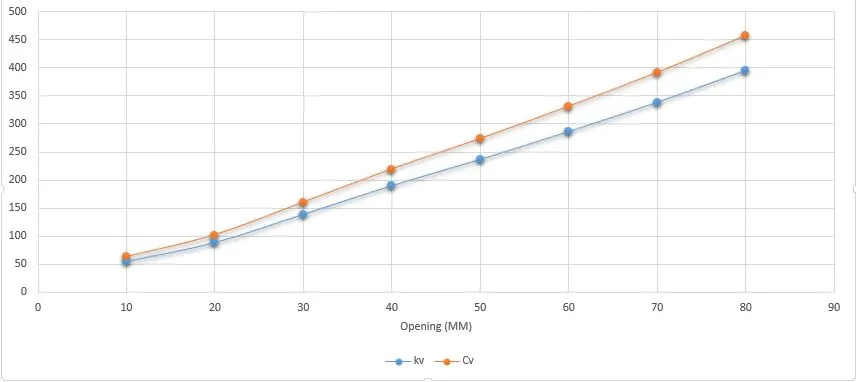
The X-axis represents the opening of the gate valve in mm while Y-axis represents the flow factor and flow coefficients.
As we increase the lift of the gate valve, pressure drop decreases, and the flow coefficient increases simultaneously. That's why we choose a high flow coefficient for industry purposes so we get minimum pressure losses and energy losses.
A pressure drop occurs when frictional forces, caused by the resistance to fluid flow are fluid velocity through the valve and fluid viscosity. Pressure drop increases proportionally to the frictional shear forces within the Valve. When the flow rate is low, backpressure is low also due to fluid viscosity, gets higher pressure drop. While when we increase the flow factor and flow coefficient, pressure drop decreases simultaneously and we get a higher flow rare.
Conclusions:
1) Mass flow rate at the outlet is negative and this negative term means that mass left the outlet.
2) Performing a parametric study helps to reduces the solving time in studying the effect of change of parameter of the gate valve problem.
3) Flow factor (Kv) increases as the flow increased and due to this flow coefficient also increases.
4) Graphical study defines that as the lift is increased of the gate valve, there will be an increase in the mass flow rate of fluid and a decrease in the pressure drop.