Assignment 5-RADIOSS Interfaces & Study of Effect of Notches Challenge
MESHING OF BUMPER AND RADIOSS INTERFACE AND STUDY OF EFFECT OF NOTCHES
OBJECTIVE:
1.Mesh the bumper assembly model with an Element target size of 6mm.
2.Run the Crash tube model with 6 different cases as given below and compare.
- Run the crash tube model as it is.
- Change the Inacti=6 and run.
- Create the type 11 contact and run.
- Remove both notches and remove boundary condition on rigid body node then run.
- Create a new notch in the middle, select the whole section and run.
- Create a new notch with nodes only from opposing 2 faces and run.
1. MESH THE GIVEN BUMPER MODEL
PROCEDURE:
- Import file to hyper Mesh
- Delete solid surfaces
- Geometry clean-up
- Toggling lines
- Assign quality criteria
- Meshing
- Check for free edges
- Check for normals
IMPORT GEOMETRY FILE TO HYPER MESH:
Import the Geometry file to hyper mesh
For open
Go to File >> Import >> Select geometry >> Open the model >> Click the model >> Import
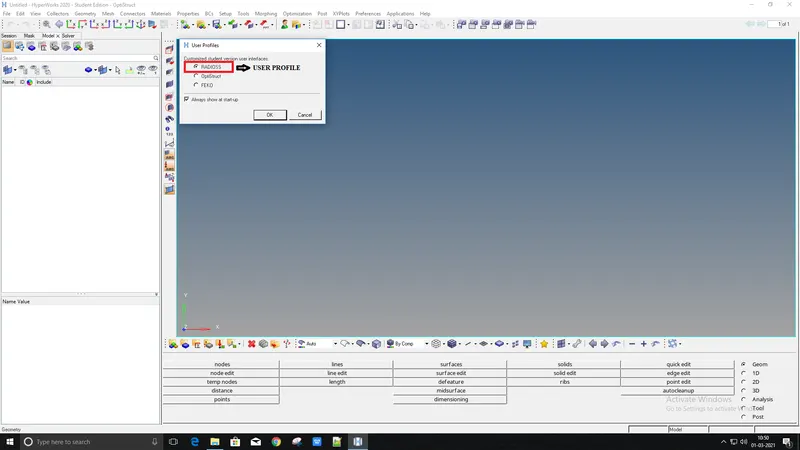
Select USER PROFILE as RADIOSS
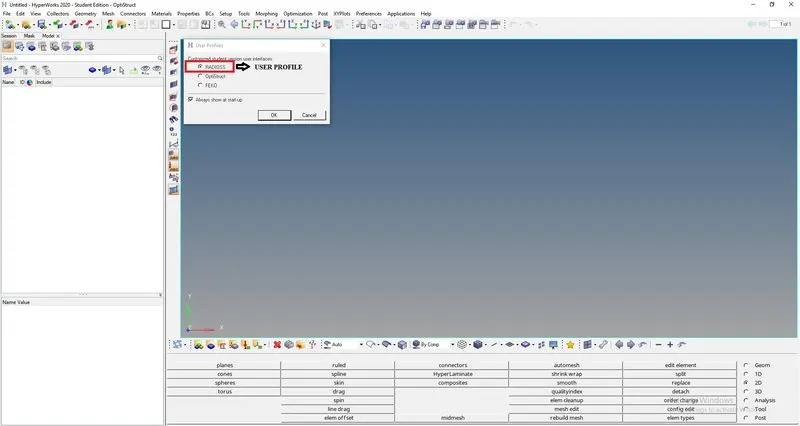
USER PROFILE
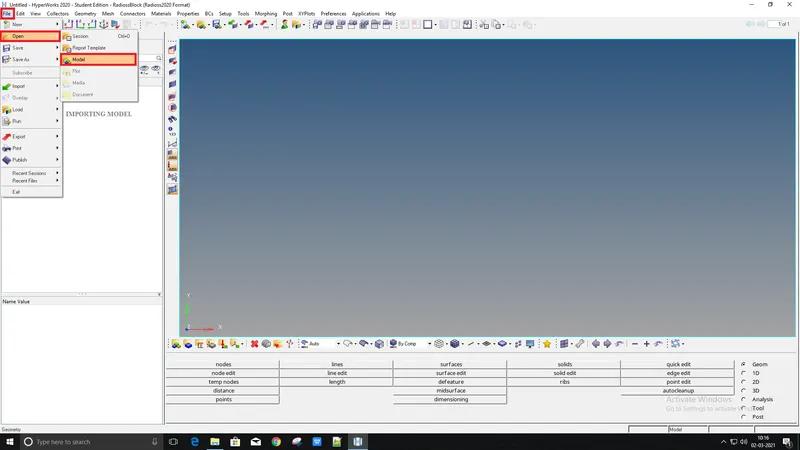
DELETING SOLID FACES:
We only have to work on the geometry, so before inspection check for solids and delete if there are any solid present.
Delete [F2] >> Solids >> Select by box selection >> Delete Entity
Another way to check for solids is by switching the view from AUTO MODE to TOPO MODE.
If the model is highlighted in GREEN that means solid is present.
From the image below, we can confirm that there are no solids present in the model
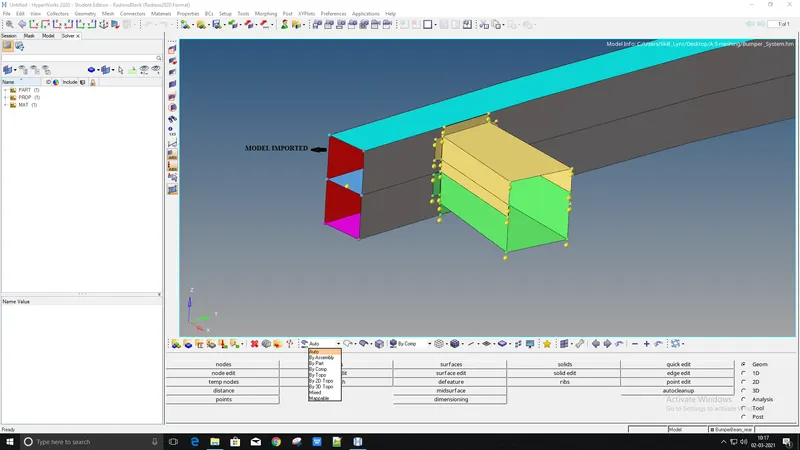
MODEL IMPORTED
Hence their are solids present in the above figure
Now we have to check the geometry clean up
GEOMETRY CLEAN UP:
Once the model is imported move to geometry clean up just to check whether there any extra surface or free edges or missing surface will present or not
Check for errors
To check an error
Go to visualize panel >> Disable shared edges and all except free edges
Change color mode from AUTO to TOPO we can able to see the geometrical errors
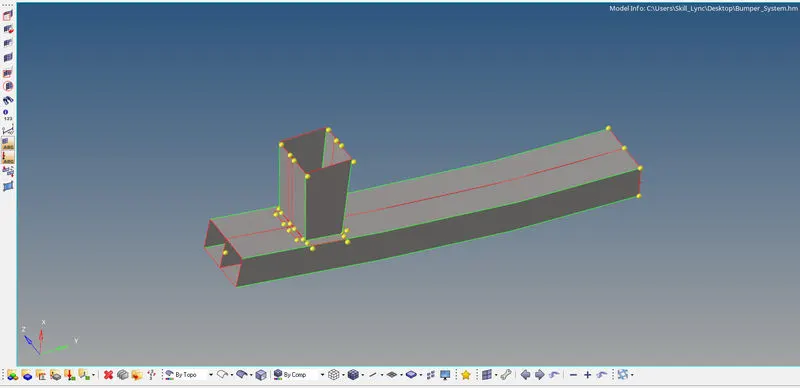
SWITCHED TO TOPO MODE
Now from the above figure, we can see that there are free edges
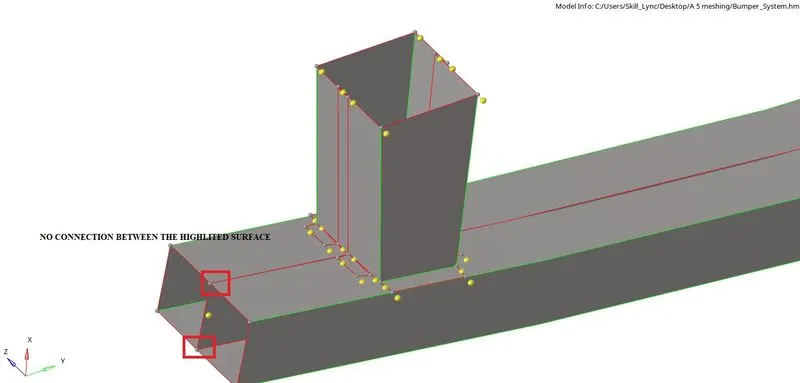
Form the above figure we can see that there are no connection between the two surfaces
Here we have to extend the surface and trim those surfaces to get a proper connection with these two surfaces
For that
Go to geometry page >> Surface edit (SHIFT + F7) >> Trim with surf/plane >> Self intersecting surf >> Select surf >> Trim

GEOMETRY PAGE

SURFACE EDIT TAB
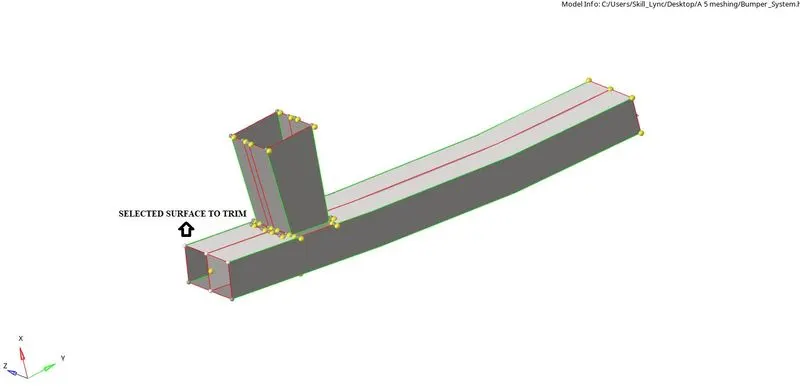
SELECTING SURFACES TO TRIM
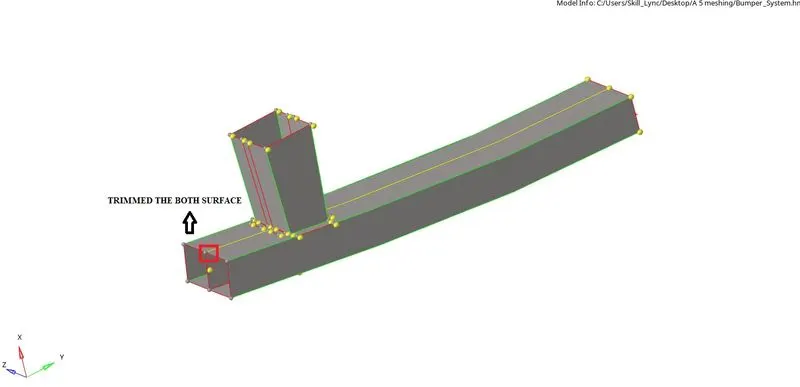
TRIMMED SURFACES
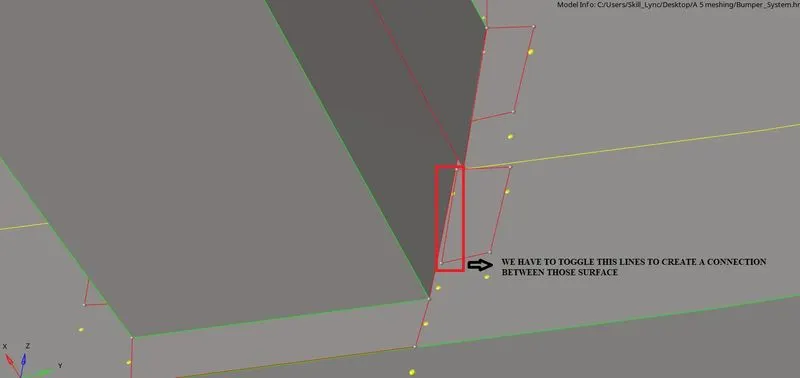
FREE EDGES
So, here we have to toggle those free lines to get a shared edge
Go to Quick edit >> Toggle >> Select line toggle
If we want to Toggle a particular line:
Toggle Edge > Right Click on the line
If we want to untoggled a line:
Toggle Edge > Left click on the line

GEOMETRY PAGE

QUICK EDIT PANEL
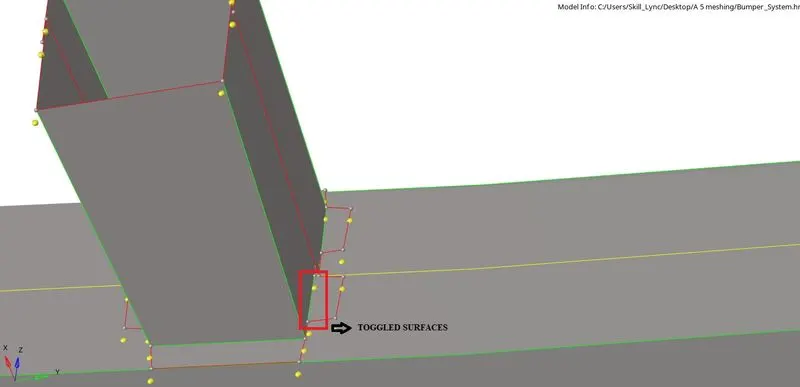
TOGGLED LINES
Now the model is error-free move to mesh
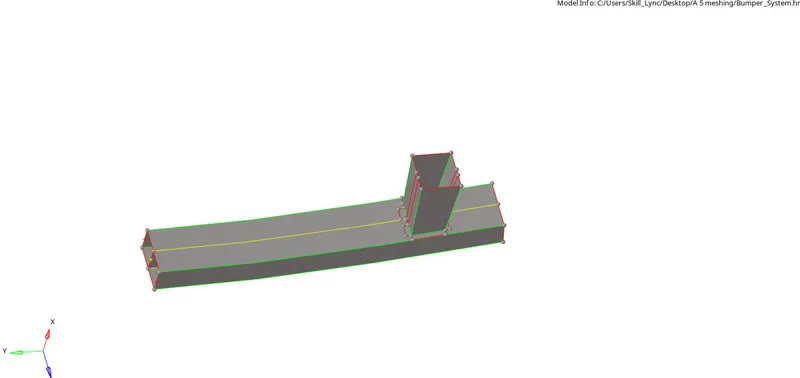
CLEAN UP MODEL
ASSIGN QUALITY CRITERIA:
Assign quality criteria for a given model
Go to preferences >> criteria file setting >> Enter the values >> Apply >> Ok
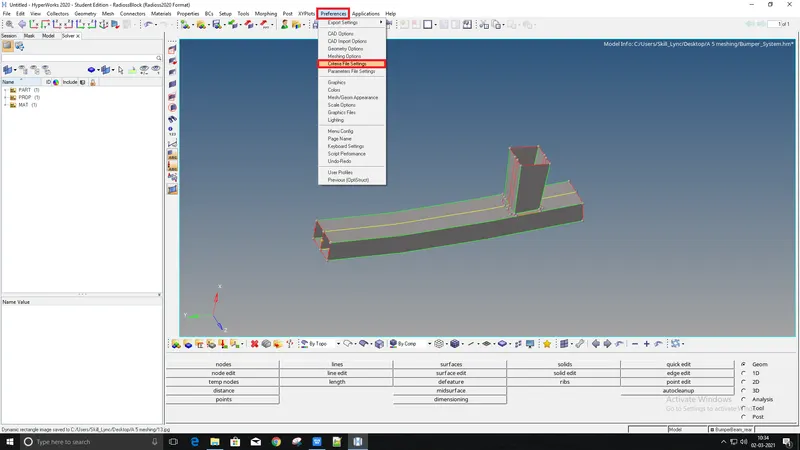
SELECTING PREFERENCES FROM MENU BAR
Here we don't have to worried about quality criteria we just have to enter the target element size as shown in the below figure
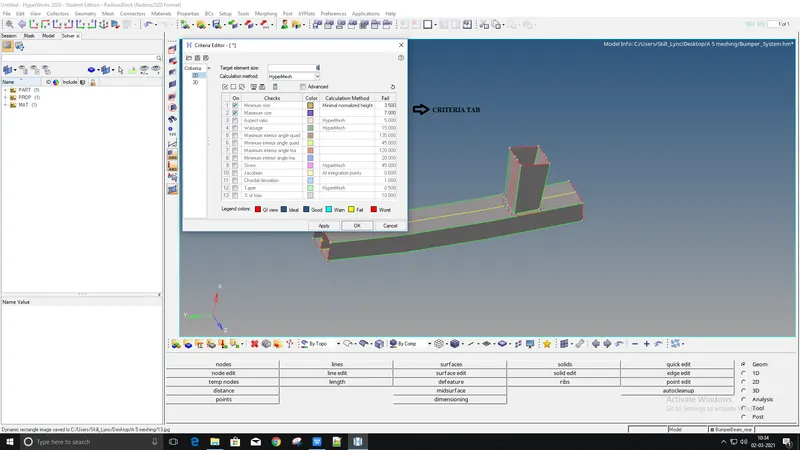
CRITERIA TAB
MESHING:
FEA stands for the finite element analysis which means that elements are analyzed and integrated over a region to derive the final result. so, in a continuous member, which in reality are everything starting from a pin to automotive parts. there are infinite nodes and it’s not possible to solve an infinite equation. so meshing is carried out so that we can desecrating that continuous member into a number of finite nodes. and hence go for solving the equations. after that interpolate the results for the entire domain.
Mesh the given components with a given quality criteria
Rules of mesh :
For better mesh flow we need to follow some rules :
- Opposite tria's are avoided.
- Flat surface trai's should be avoided by merging them using split.
- Avoid trai's near to hole region.
- The hole feature should be even-numbered.
- Avoid tria's at the perimeter line.
- Avoid zig-zag mesh flow.
- Avoid rotating quads.
- Divides the large surface into small parts using split for meshing.
- Defeature the area which is going to fail the quality criteria.
Now mesh the component
Go to geometry page >> Select 2D >> Select auto mesh >> Enter element size as 6mm >> Select surface >> Create

2D PAGE

AUTOMESH TAB
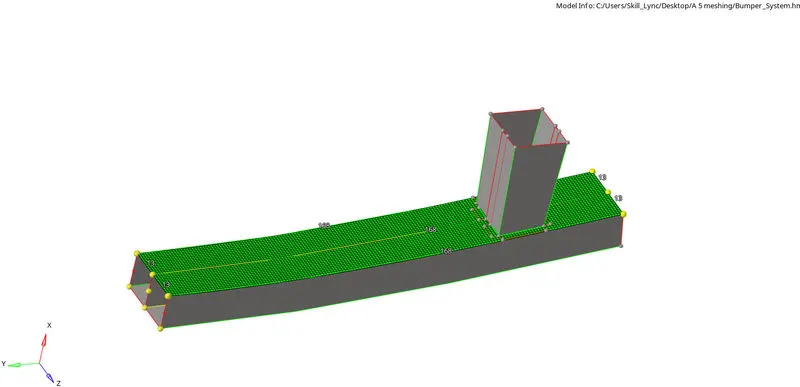
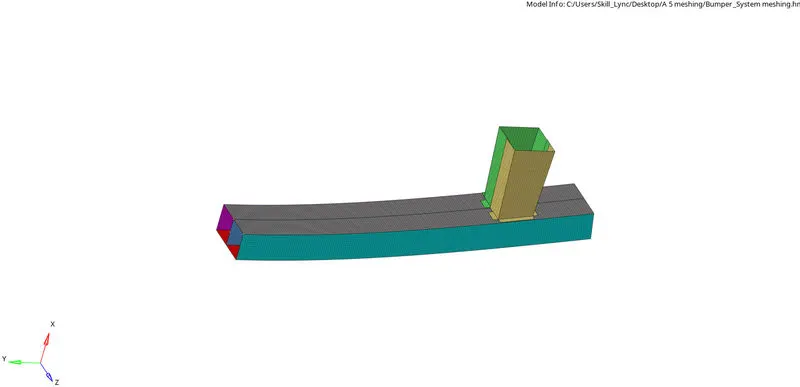
MESHED MODEL
CHECK FOR FREE EDGES:
we have to check for free edges (red lines) in the component.
Edges Tool will help us find this error:
Tool >> Edges [Shift + F3] >> Elem's >> Select by box selection >> Find edges
If free edges are present, connectivity won't be established between the surfaces.
As a result, when force is applied on any surface it won't be distributed to the neighboring surface due to a connectivity issue

CHECK FREE EDGE TAB
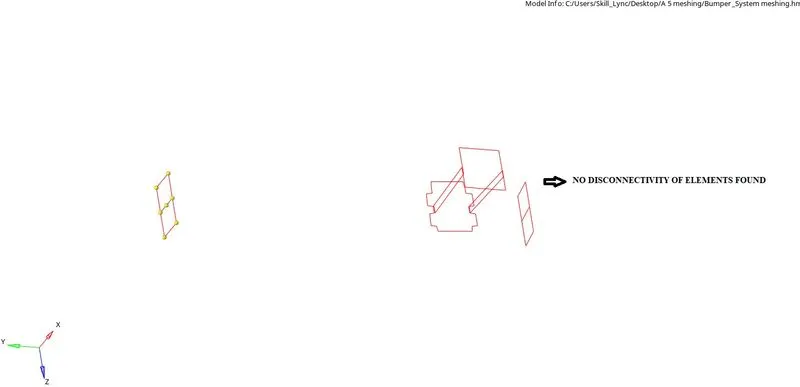
NO FREE EDGES PRESENT
CHECK FOR NORMALS:
After meshed the model check for vector normal
To check
Go to Tool >> Normal >> Select elements display
As a result, when force is applied on any surface it won't go the opposite direction

TOOL PAGE

NORMALS TAB
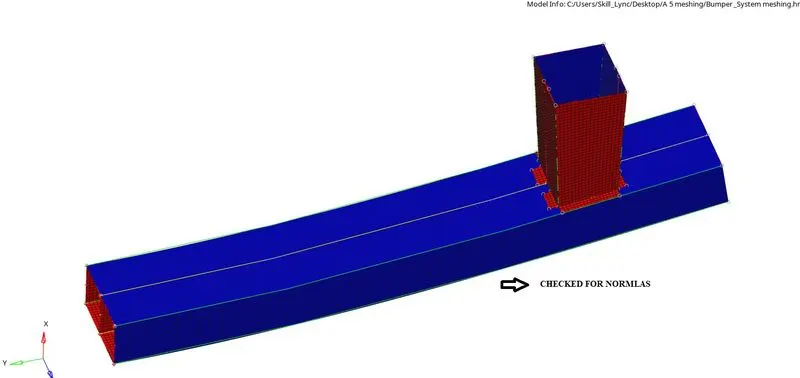
CHECKING FOR NORMALS
2.Run the Crash tube model with 6 different cases as given below and compare
PROCEDURE:
- BASICS OF STARTER AND ENGINE FILE
CASE 1: Import given starter file as it is
- Run the CRUSH_TUBE_0000.rad file
- Check the results
- Check the animation
- plot the 2D graphs
CASE 2: Import given starter file and edit inact=6
- Run the CRUSH_TUBE_0000.rad file
- Edit inact=6
- Check the results
- Check the animation
- plot the 2D graphs
CASE 3: Import given starter file and create TYPE 11
- Run the CRUSH_TUBE_0000.rad file
- Create TYPE 11 in groups
- Check the results
- Check the animation
- plot the 2D graphs
CASE 4: Import given starter file and remove both notches and boundary condition
- Run the CRUSH_TUBE_0000.rad file
- Remove both notches and boundary condition
- Check the results
- Check the animation
- plot the 2D graphs
CASE 5: Import given starter file and create a new notch in between the crush tube
- Run the CRUSH_TUBE_0000.rad file
- Create a new notch in the middle of the tube
- Check the results
- Check the animation
- plot the 2D graphs
CASE 6: Import given starter file and create a new notch on opposite two sides
- Run the CRUSH_TUBE_0000.rad file
- Create a new notch on the opposite side of the tube
- Check the results
- Check the animation
- plot the 2D graphs
BASICS OF STARTER AND ENGINE FILE
The starter file stores information about:
- Nodes
- Load Conditions
- Velocity
- Boundary Conditions, etc.
- Basically, it is an ASCII (American Standard Code for Information Interchange) file that contains the model information.
- The starter file should always end with 0000.rad.
The engine File stores information about:
Simulation Runtime
Simulation Speed control parameters, such as No. of Animation Files, No. of Time History File, Size of the history file and Animation frequency, etc.
Basically, it is an ASCII (American Standard Code for Information Interchange) file that describes the run controls.
We can also edit the Engine File directly through the Control Cards.
TWO TYPES OF INTERFACE:
TYPE 7: NODE TO SURFACE
- Impacts occur between a master surface and a set of slave nodes, similar to the TYPE5 interface.
- A node can impact one or more master segments.
- A node can impact on either side of a master surface.
- Each slave node can impact each master segment except if it is connected to this segment.
- A node can belong to a master surface and a set of slave nodes.
- A node can impact the edge and corners of a master segment. None of the previous interfaces allow this.
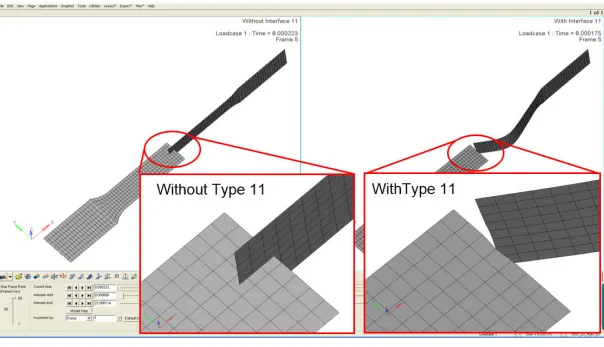
TYPE 11: EDGE TO EDGE
This interface simulates impact between edge to Edge or lines. A line can be a beam or truss element or a shell edge or spring elements. In association with interface TYPE7, interface TYPE11 solves the locking cases
• Defined by identifying master and slave lines (edges)
• Impacts occur between a master and a slave line. A slave line can impact one or more master lines. A line can belong to the master and the slave side. This allows self-impact.
• Works similar to Type 7 in terms of Penalty formulation, Gap definition
• Uses complicated mathematical algorithms; therefore, it is strongly advised to use it only when necessary. A huge interface TYPE11 can slow down the computation
IMPORT FILE TO HYPER MESH:
CASE1: RUN THE STARTER FILE AS IT IS
For that
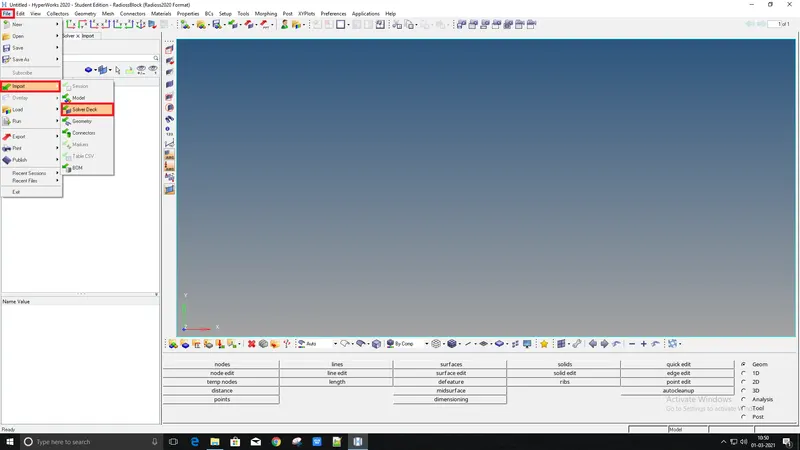
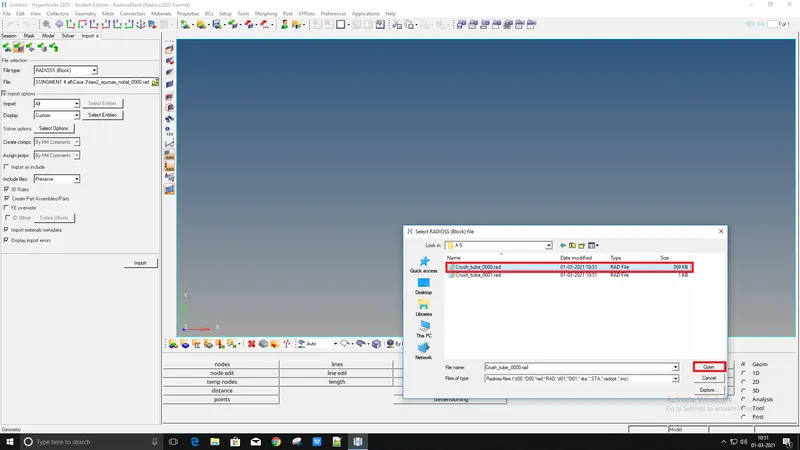
Go to Files in task bar >> Import >> Solver Deck >> CRUSH_TUBE_0000.rad (select) >> Import
Make sure the USER PROFILE is in RADIOSS
USER PROFILE
IMPORTING STARTER FILE
SELECTING FILE TO IMPORT
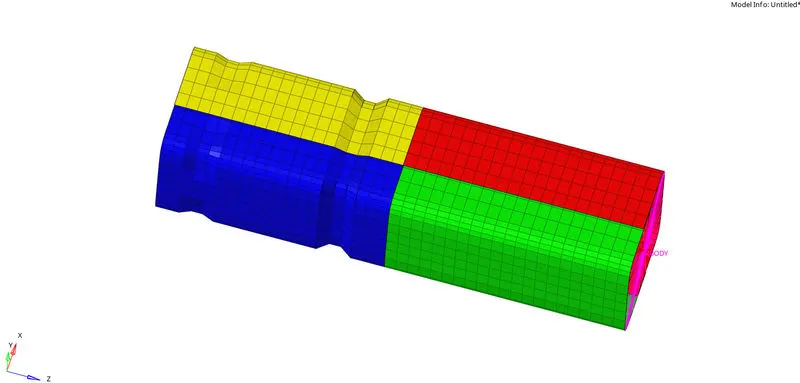
MODEL IMPORTED
After importing the model RUN the file
For that
Go to Analyize >> Radioss >> Save as >> Select file >> Radioss

ANALYSIS PAGE
SELECT THE STARTER FILE TO RUN
Before running the simulation
Create TH INTER
For that
Go to Solver >> TH >> Create >> TH >> Inter >> Select entity ID's >> Group's >> Select Type 7 (Node to surface) >> Num of variable: Default
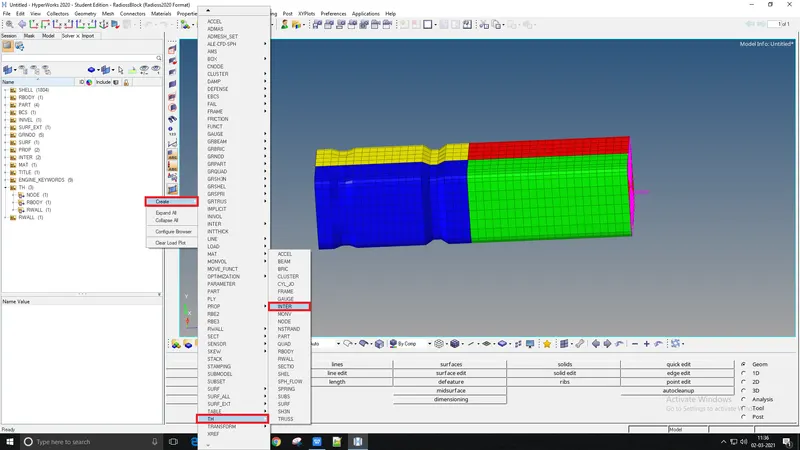
SOLVER TAB
Now run the simulation
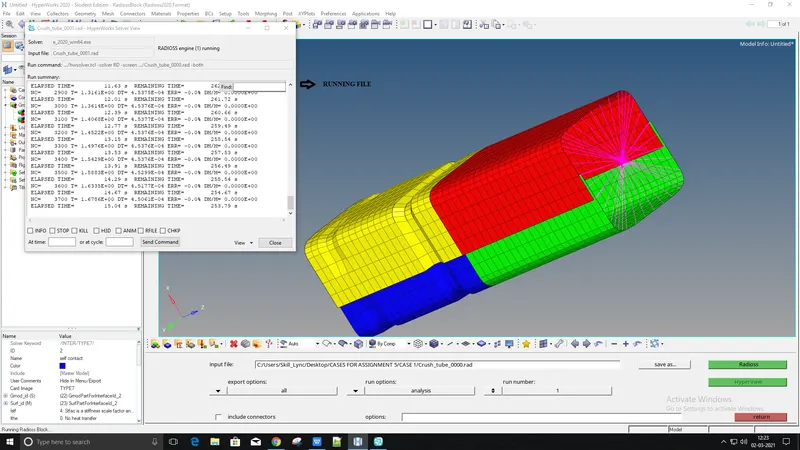
SIMULATION RUNNING
Once the simulation done
- Go to Engine out file
- Note down No. of cycle, Energy error, Mass error, and Simulation time
- The input file is the same Started file that we had just Edited.
- Once we hit Radioss, a pop-up box will appear. It shows us the real-time analysis and gives us the final result.
- After running the file will contain an animation video along with animation steps and the time history file will be saved in the same folder where the starter file exists.
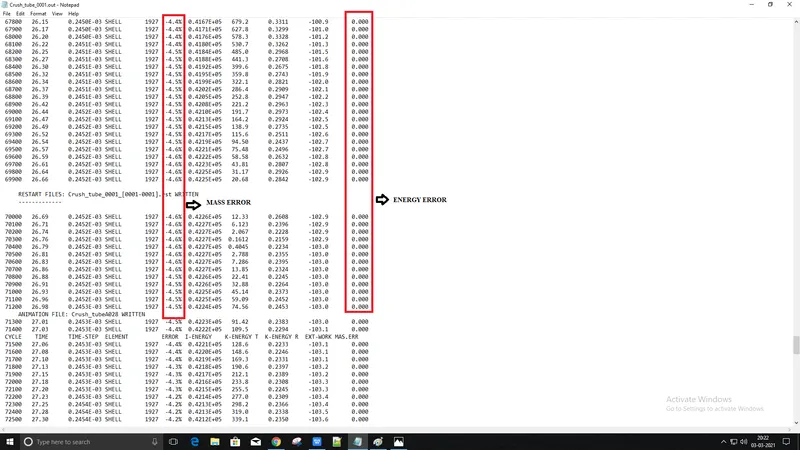
ENGINE OUT FILE
Now open the animation
For that
Go to Hyperveiw >> Select animation file >> Apply
To see von-mises
Go to contour in hyperveiw >> Select von-mises >> Select: Simple >> Apply
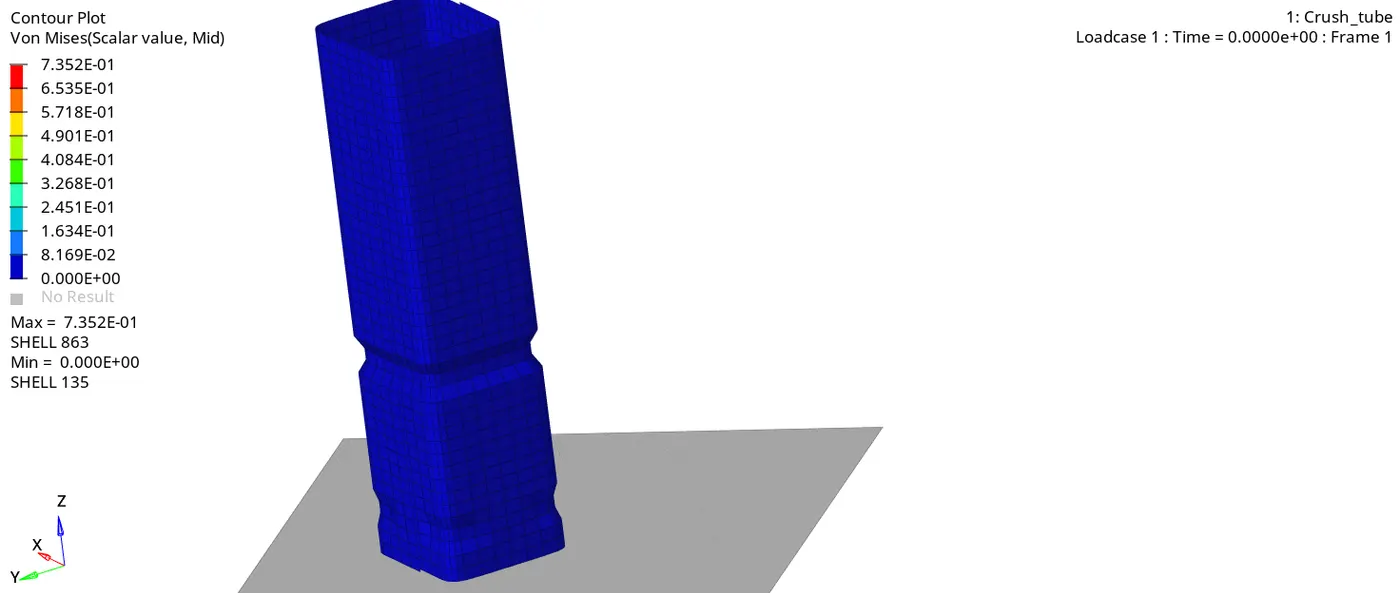
VON-MISES STRESS
The given plot is drawn for the Von mises stresses. Similarly, we can plot for Contact energy and displacement plots also. To do this, we
simply need to change the contour plotting from Von mises to Contact energy and displacement
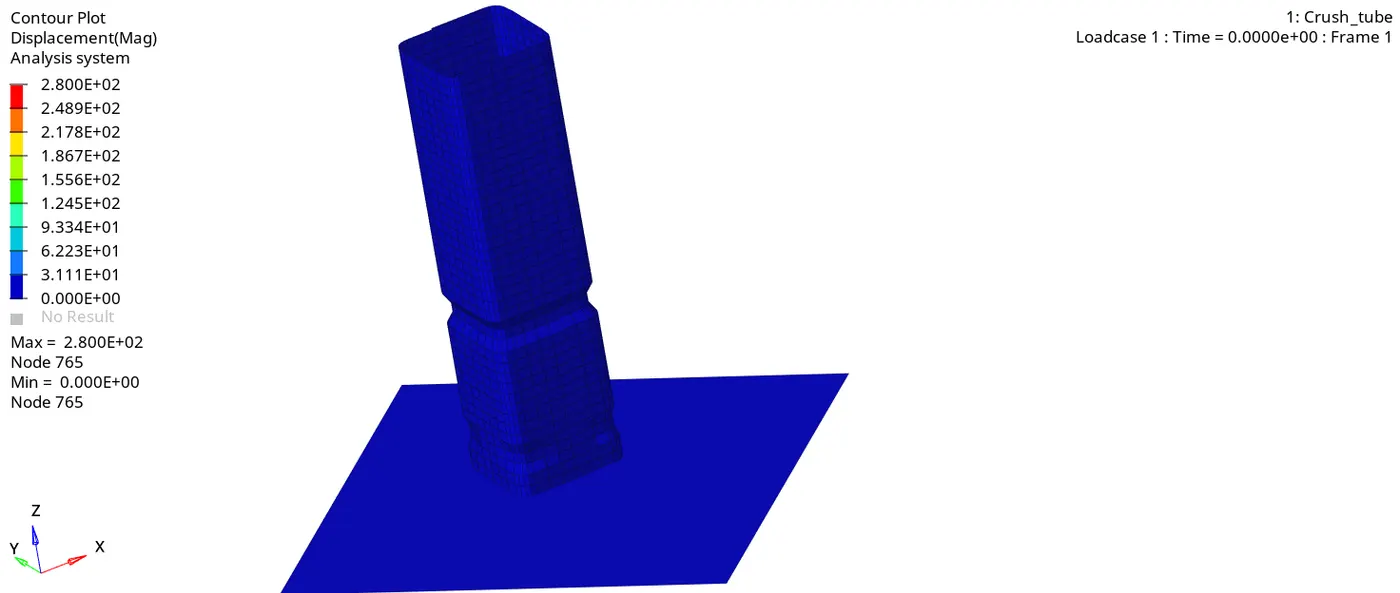
DISPLACEMENT
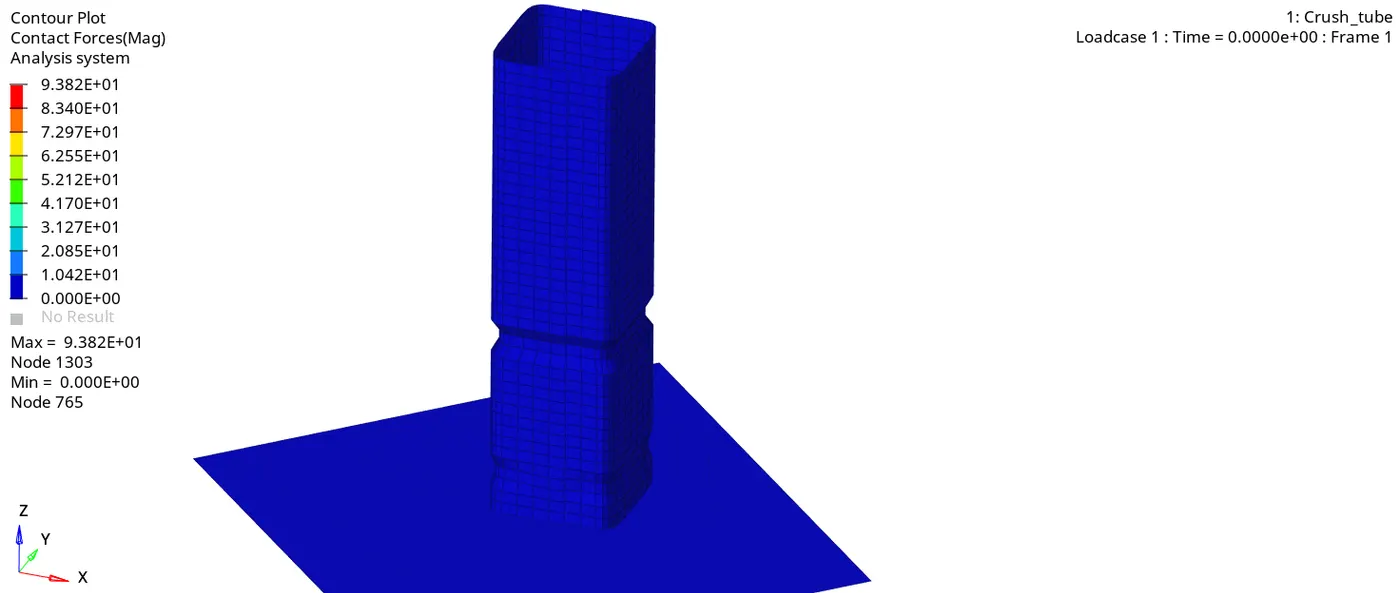
CONTACT FORCE
From the animation we can clearly see that the deformation taking place at the middle notch first due to applied velocity and also as shown in the below figure
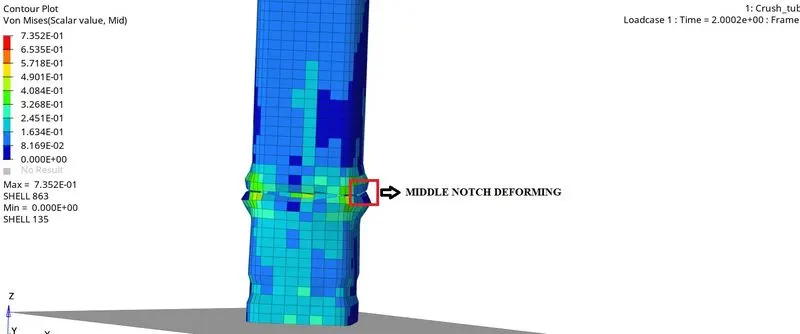
DEFORMING MIDDLE NOTCH
- Once mid notch deforms the next deformation occurs in the second notch i.e Near to rigid wall this is because the thickness is less at bottom
- When the notch elements are undergoing deformation
- Here notch elements deforming inside and the rest flat elements are coming outside. This region does not require more force to deform the elements
After checking the animation file, we have to plot the graphs
For that
Go to Hypergraph 2D >> Select T01(Time history file) >> Select x-type = Time >> Y-type = Global variable >> Y-request = Internal, kinetic, contact, Hourglass and Total energies >> MAG(Magnitude) >> Apply
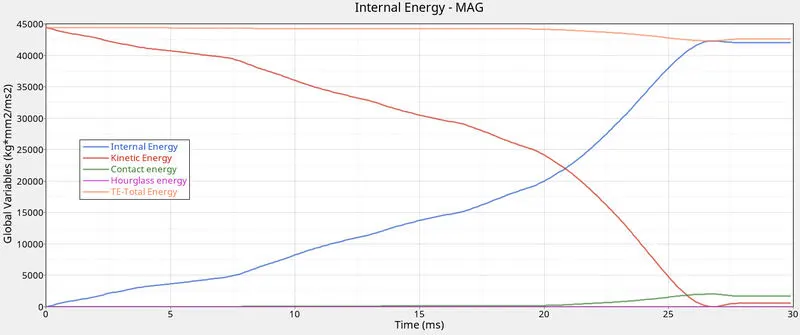
GLOBAL VARIABLES GRAPH
1. Form the above graph we can see that when the tube is in its initial position the velocity is maximum due to this kinetic energy is maximum
2. But when the tube is hitting the rigid body the kinetic energy is absorbing by the elements so that the kinetic energy goes on decreasing
3. However the kinetic energy decreasing internal energy increasing
4. So, once the deformation reaches maximum due to rigid wall
5. Form the graph rigid wall forces are decreasing once it reaches to peak because velocity drops this is due to rigid wall forces velocity decreases so, kinectic energy become zero and internal energy become max
6. Initially the contact energy is at zero when the velocity applied to the tube starts deforming due to this deformation the penetration taking places
7. To avoid those penetrations the forces are building as per the given GAPmin due to these forces we can see this contact energy
8. The total energy remains constant (no loss or generation of energy), kinetic energy decreases while internal energy increases. Hourglass energy and Contact energy are negligible small
PLOT RIGIT WALL FORCES:
Same steps we have to follow to plot rigid wall forces
But here instead of global variables, we have to choose Rigid wall forces
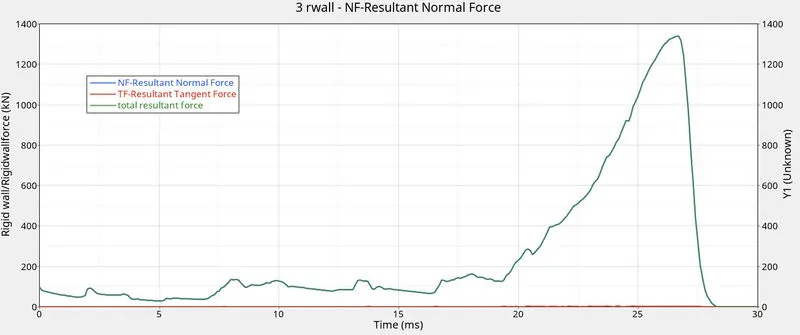
RIGID WALL FORCES
- Before velocity acting on the tube, there are zero rigid wall forces
- Once the velocity acting on the tube connects with a rigid connection then the forces start applying on the body then the elements were deforming
- Initial stage rigid wall forces start building opposite to the velocity
- From the graph we can see that till 20-sec elements deforming easily because of notches this will require less forces, But after 20 sec the graph is suddenly increasing because its required more forces to deform, So the rigid wall reaction forces increasing till the final displacement
CASE 2: IMPORT GIVEN STARTER FILE AND CHANGE TO Inacti =6
Inacti =6
Special treatment for initial penetrations can be accomplished through the use of inacti
Import the given starter file
Once the model is imported
Go to model browser >> Groups >> Type 7 >> Change inacti = 6
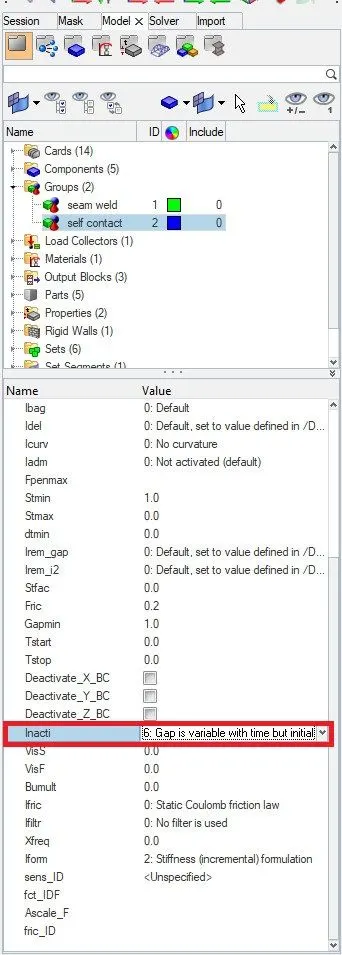
CHANGING Inacti value
In this case, we are changing Inacti to 6 in type 7 Interface.
This will take if initial penetrations exist or Remove initial penetration where possible and this will reduce less than 30% of the defined gap value and adjust the gap with Incact.
After made changes run the file as shown in case 1 same steps should be fallowed
Once the simulation is done, Open the engine out file write down all the values
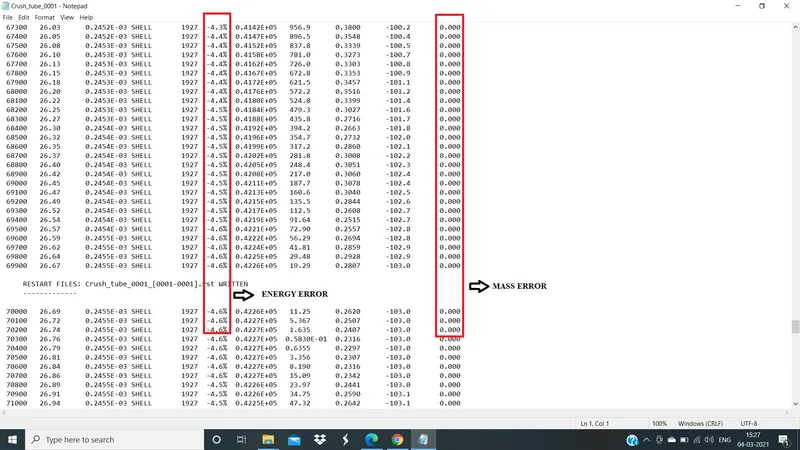
ENGINE OUT FILE
Now open the animation
For that
Go to Hyperveiw >> Select animation file >> Apply
To see von-mises
Go to contour in hyperveiw >> Select von-mises >> Select: Simple >> Apply
CONTACT ENERGY
DISPLACEMENT
In this simulation, the Displacement animation indicates the displacement of the components. And the elements have a much higher displacement at the end than the elements that are near to the wall. It is also possible to consider this displacement as the deformation of the elements. So as the simulation progresses, the elements which are at the end deform much more than the elements near the wall.
VON-MISES STRESS
we can see the rigid wall forces i.e total resultant, normal, and total resultant forces. which is the same as that case 1. because there is no initial penetration. In this model, we have 2.1 mm gap, and we have a 1mm min gap which is we are given, and master element thickness we have 3mm Gm is T/2, so we have 1.5 mm of the master gap and add Gapmin and Gm that is 2.5mm. but gap minimum is 1mm so which is less than the present gap, so we can conclude there is no initial penetration.
After checking the animation file we have to plot the graphs
For that
Go to Hypergraph 2D >> Select T01(Time history file) >> Select x-type = Time >> Y-type = Global variable >> Y-request = Internal, kinetic, contact, Hour glass and Total energies >> MAG(Magnitude) >> Apply
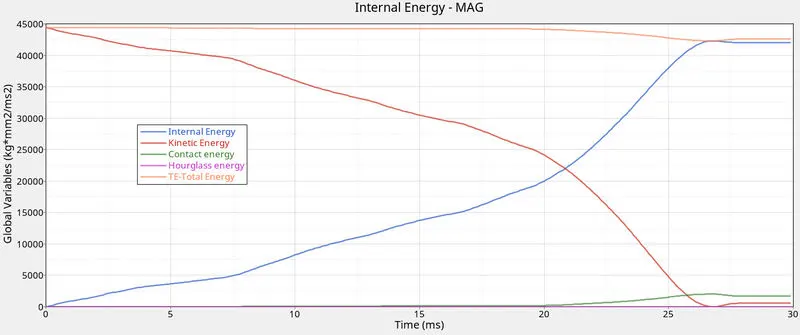
GLOBAL VARIABLE GRAPH
CASE 1 and CASE 2 have the same values and the same graph for explanation as that of case 1
PLOT RIGIT WALL FORCES:
Same steps we have to follow to plot right wall forces
But here instead of global variables, we have to choose Rigid wall forces
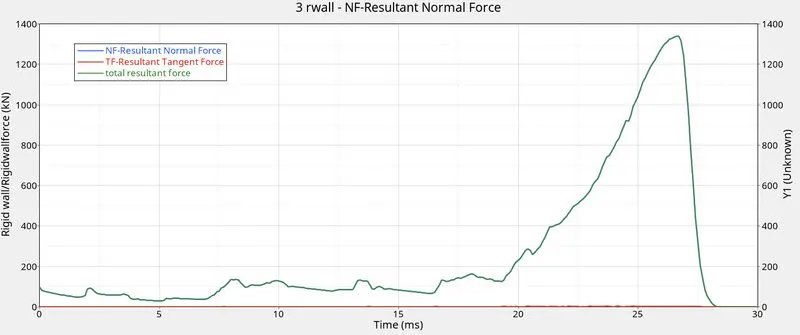
RIGID WALL FORCES
The forces being plotted in the Rigid Wall Forces plot are the Usual Forces applied to the crash tube by the Rigid Wall. So as the contact energy increases, the Rigid Wall forces will also increase, and we can see that the Rigid Wall Forces also decrease at the point where the Contact energy flat and finally when the specimen loses contact with the Rigid Wall, the Rigid Wall Forces become Zero.
CASE 3: IMPORT GIVEN FILE AND CREATE TYPE 11
In this case, we have to create a Type11 Contact we have to keep Type7 contact interface as it now we have to create a new contact type 11
Enter recommended properties to the software under type 11.
The recommended properties are as following:
1.Igap = 3 (Variable Gap took into account.)
2.Gapmin ≥≥0.5mm (minimum thickness to avoid the numerical issue.)
3.Inacti = 6 (remove initial penetrations wherever possible, else reduce to less than 30% of the defined gap)
4.Istf = 4 (Stiffness based on softer Segment)
5.Stmin = 1 kN/mm (Minimum stiffness in contact to avoid too soft contact.)
6.Idel = 2 (remove slave nodes from contact because of element deletion)
7.Iform = 2 (Frictional Forces are calculated on the basis of Stiffness parameter.)
Import starter file
Once the model is imported
Go to model browser >> Group >> Create >> Contact
Once created a new contact new tab will open their we have to select CARD IMAGE as TYPE 11
Under that, we have to select slave and master components
Select same components for slave and master because we are checking the results for tube not for a rigid body
Enter all recommended properties as shown above
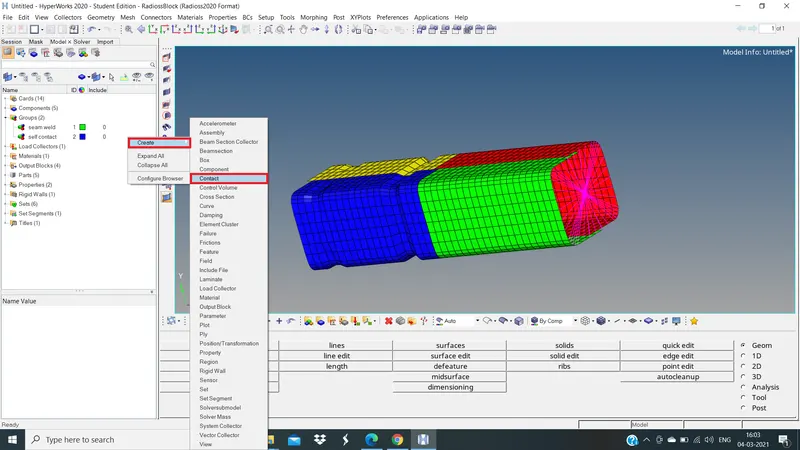
CREATING NEW CONTACT
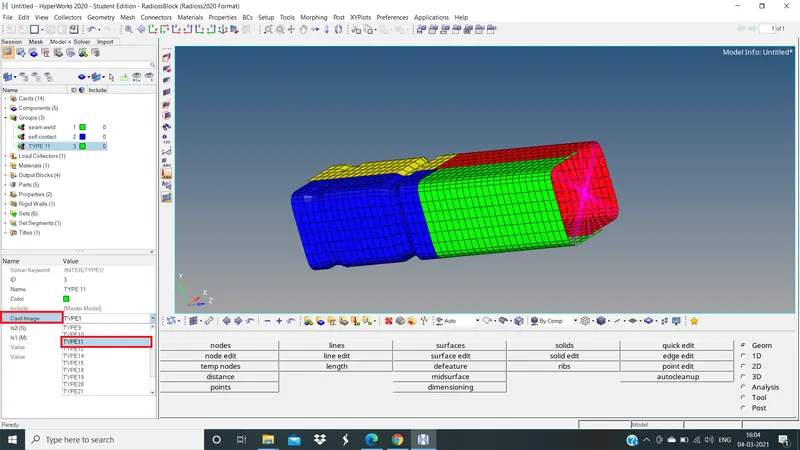
SELECTED TYPE 11
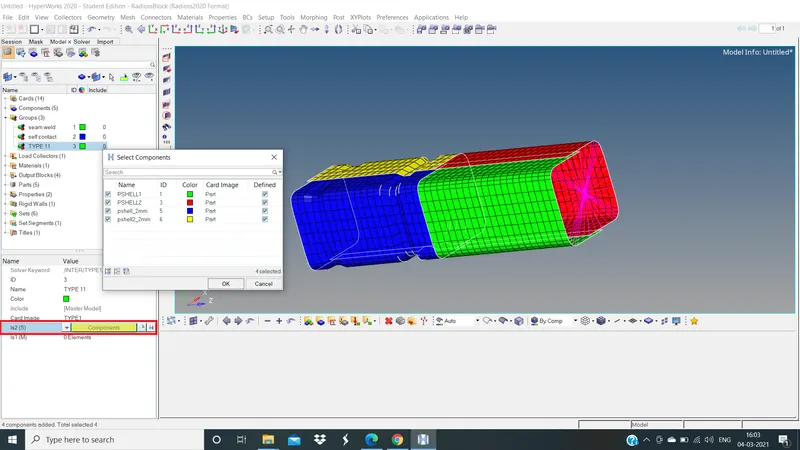
SELECTING SLAVE AND MASTER COMPONENTS
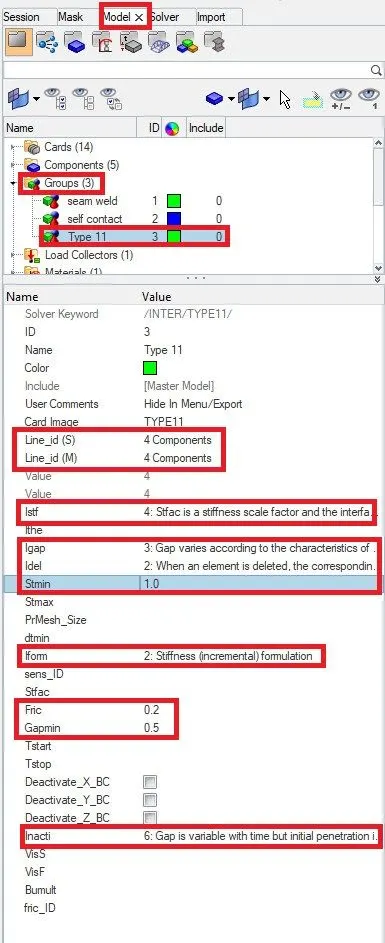
RECOMMENDED PROPERTIES
After changing properties save the model and run
Once the simulation is done, Open engine out file write down all the value
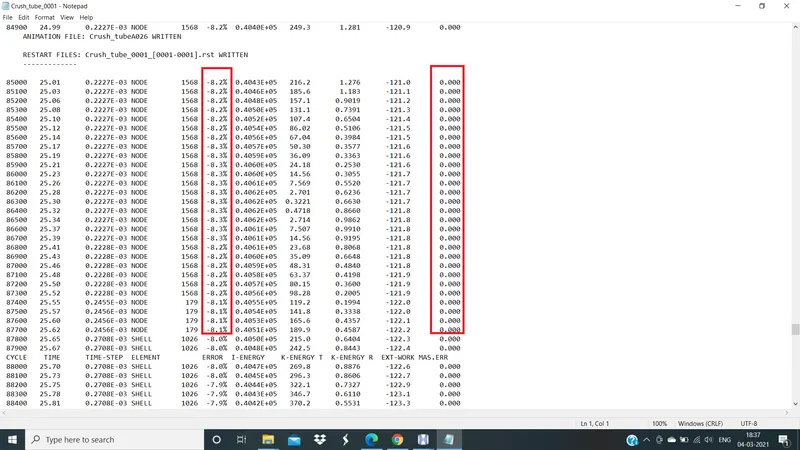
ENGINE OUT FILE
Now open the animation
For that
Go to Hyperveiw >> Select animation file >> Apply
To see von-mises
Go to contour in hyperveiw >> Select von-mises >> Select: Simple >> Apply
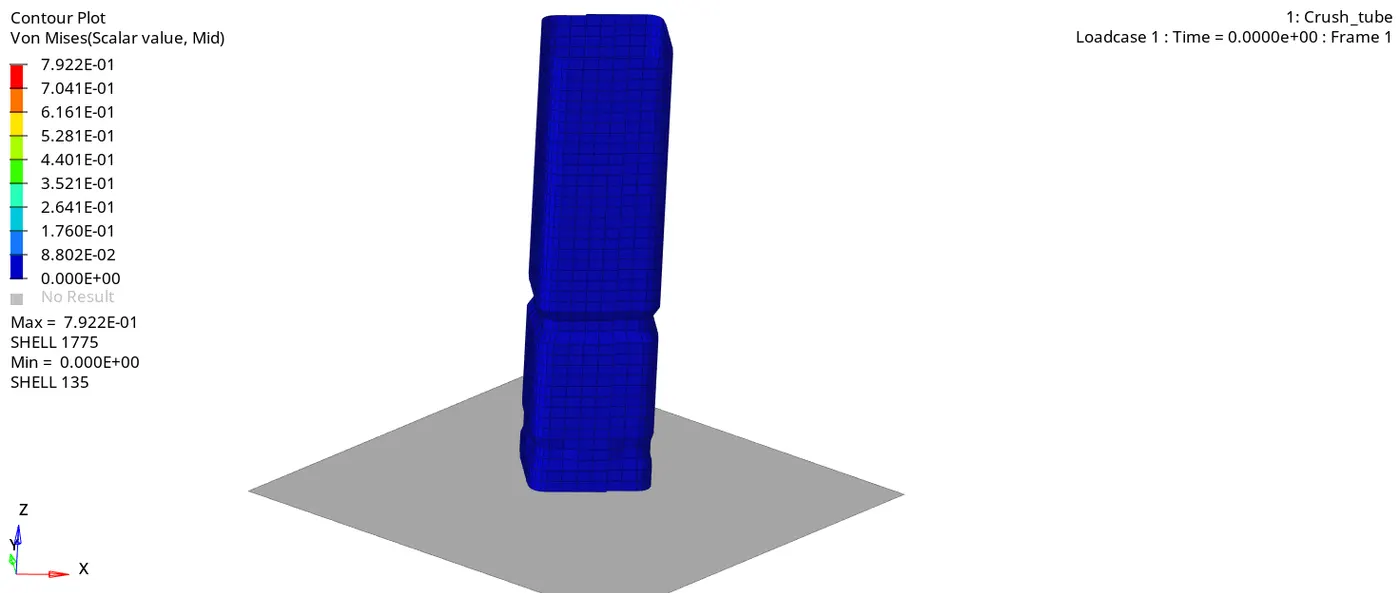
VON-MISES
After checking the animation file we have to plot the graphs
For that
Go to Hyper graph 2D >> Select T01(Time history file) >> Select x-type = Time >> Y-type = Global variable >> Y-request = Internal, kinetic, contact, Hour glass and Total energies >> MAG(Magnitude) >> Apply
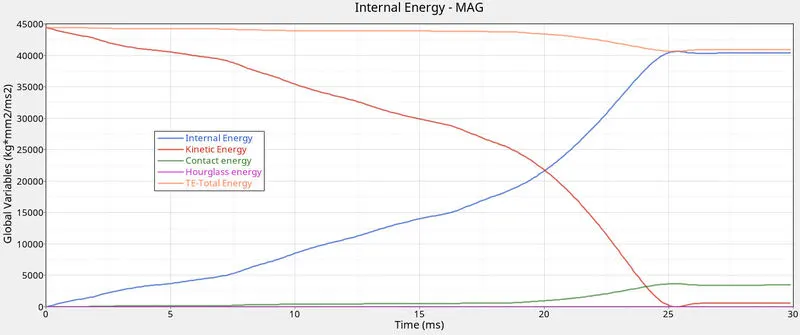
GLOBAL VARIABLE GRAPH
- From the Internal Energy graph, we can see that as the simulation progresses, the deformation in the elements is increasing and hence the internal energy is increasing. After a particular time there will be no more deformation in the Tube and hence the curve also goes on flat.
- So, internal increasing kinectic energy goes on decreasing
- Due to less contact energy produced to overcome interface is more so we can see the contact energy is more with less time
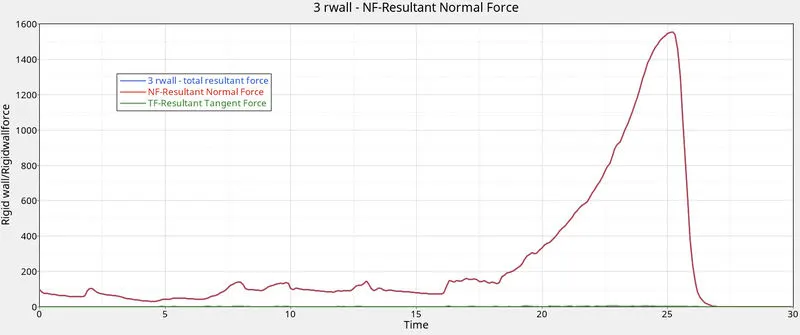
RIGID WALL FORCES
because Istiff = 4 Interface stiffness is the minimum of the master and slave stiffness.
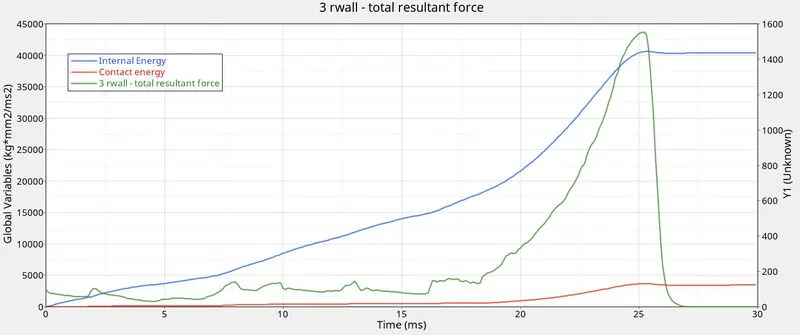
Because of minimum stiffness, we can see the velocity is moving fast and reach the peak of around 25 ms with the internal energy of 40617.32
Max kinetic energy = 44400.78 at time T=0
Max internal energy = 40617.32 at time T= 25.2
Conatct energy = 3690.94 at time T= 25.3
CASE 4: IMPORT THE STARTER FILE AND REMOVE ALL THE NOTCHES AND REMOVE BOUNDARY CONDITIONS
Import the model
After importing remove all the notches by using project and allign command and also remove boundry conidition
For that
Go to Solver browser >> Delete Boundry condition (BC) OR enable DOF's
Now save the file into the folder and run
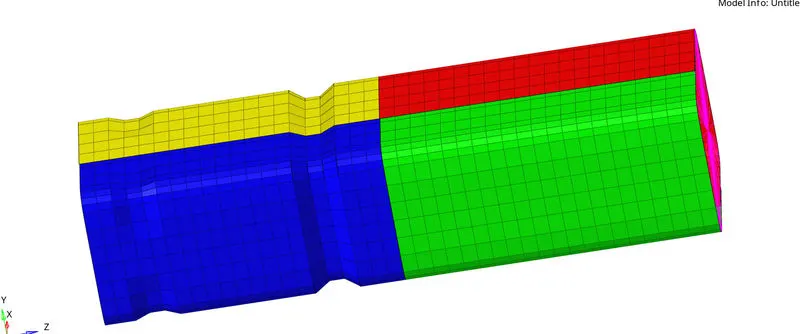
NOTCHES IN MODEL
Remove this two notches

PROJECT TAB

ALLIGN NODE
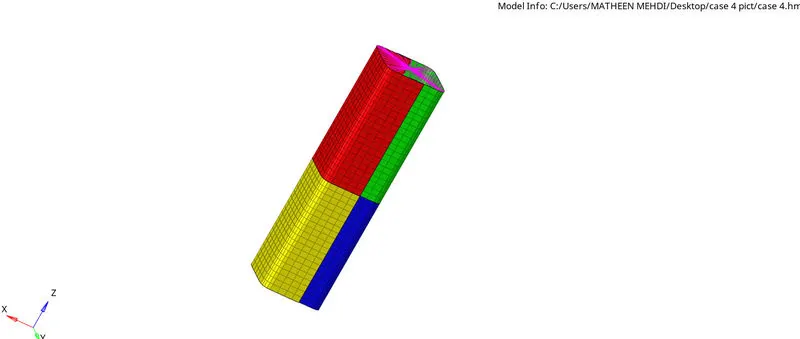
NOTCHES REMOVED
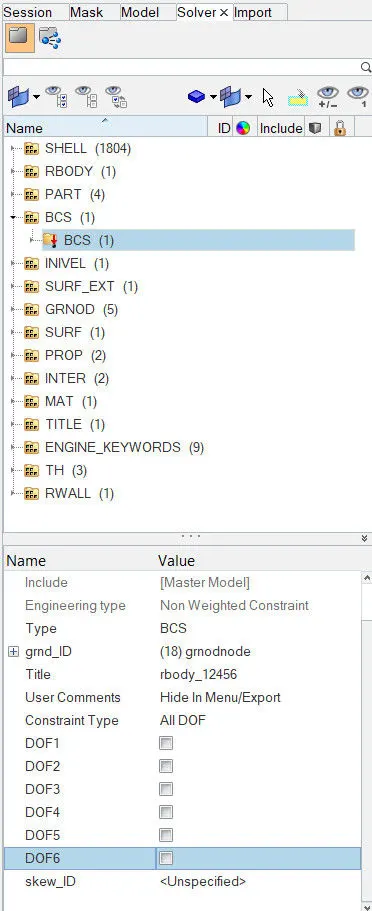
REMOVED BC
After removing boundry condition save the model and run
Once the simulation done, Open engine out file write down all the value
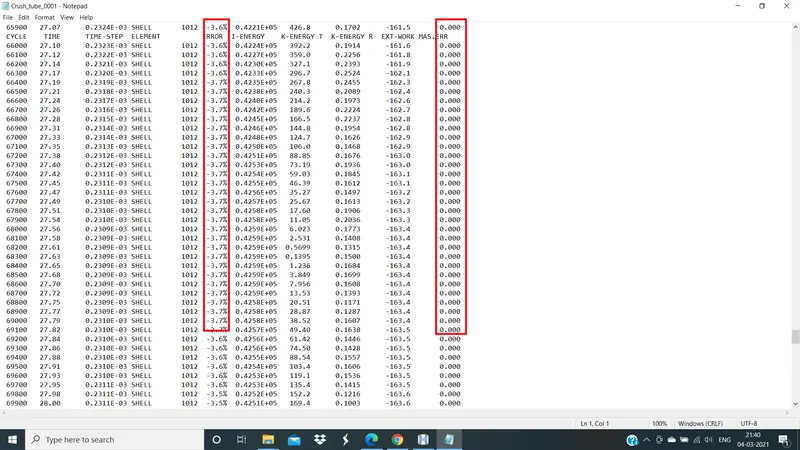
ENGINE OUT FILE
Now open the animation
For that
Go to Hyperveiw >> Select animation file >> Apply
To see von-mises
Go to contour in hyperveiw >> Select von-mises >> Select: Simple >> Apply
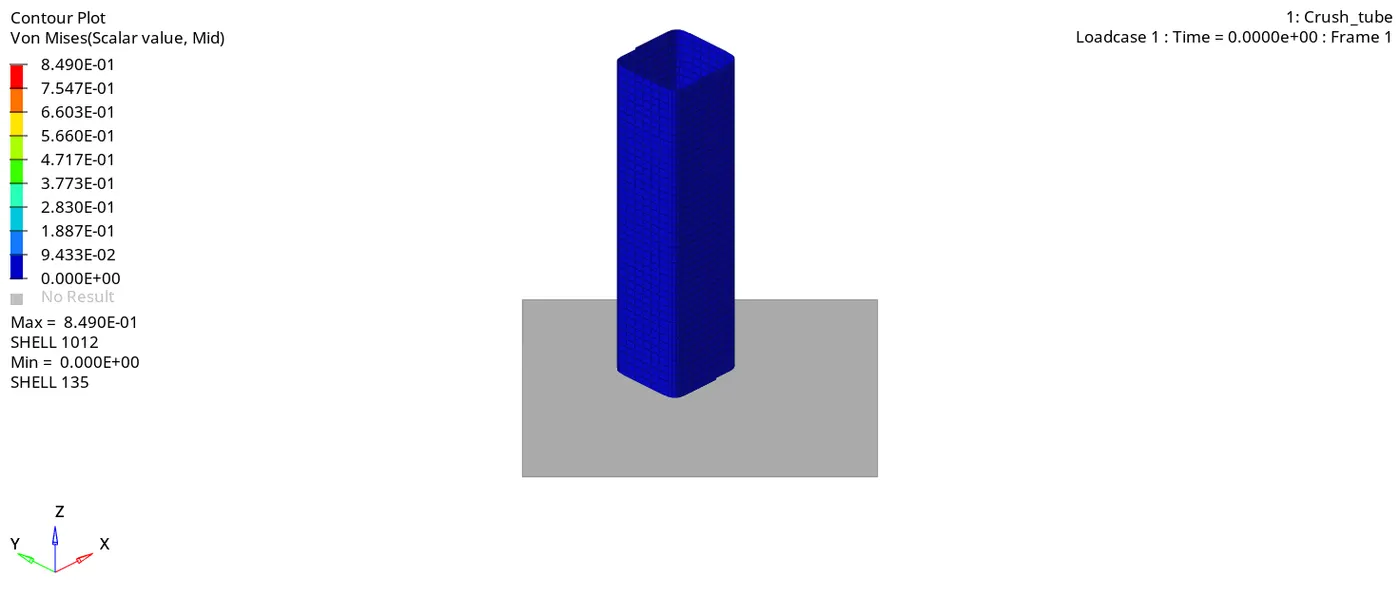
VON-MISES
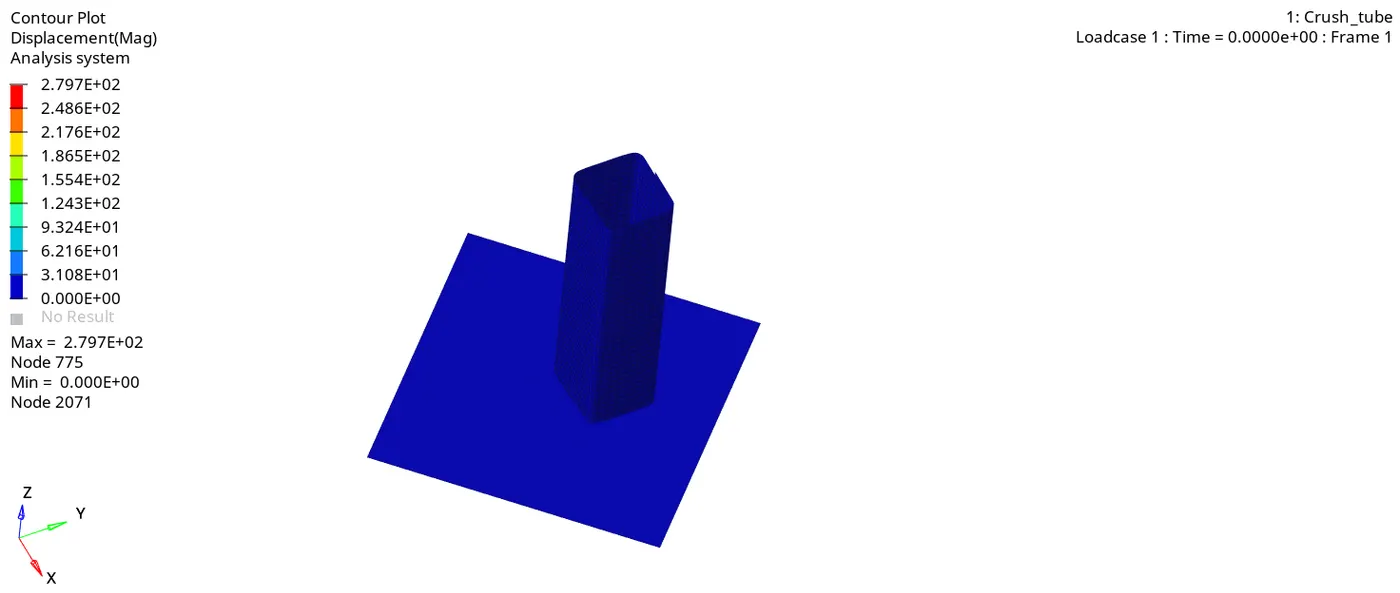
DISPLACEMENT
After checking animation file we have to plot the graphs
For that
Go to Hyper graph 2D >> Select T01(Time history file) >> Select x-type = Time >> Y-type = Global variable >> Y-request = Internal, kinetic, contact, Hour glass and Total energies >> MAG(Magnitude) >> Apply
Plot graphs for global variables and rigid wall forces:
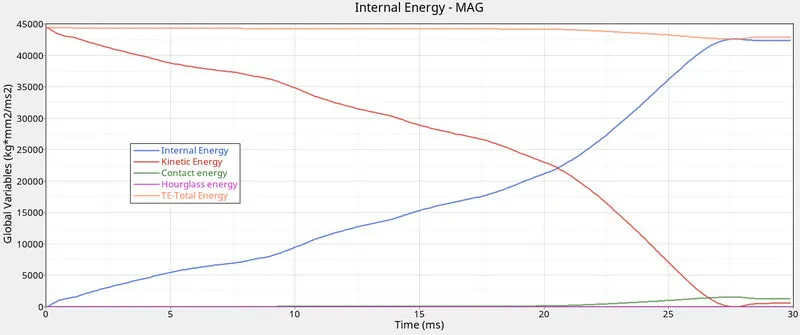
GLOBAL VARIABLES GRAPH
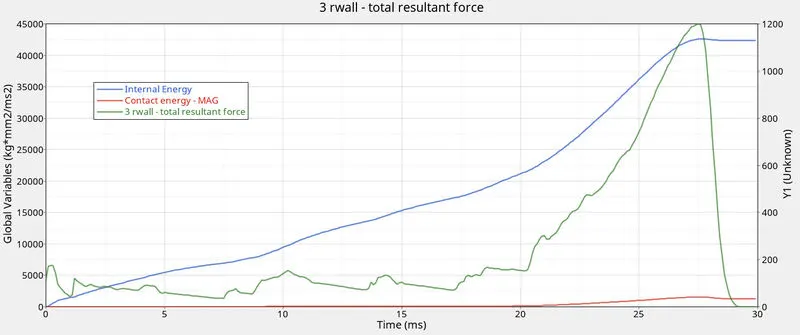
1. The peak value of the Internal energy in the simulation is around 42593.89mJ and once the maximum strain rate is achieved, the curve tends to flat.
2. The maximum magnitude of the Contact Energy is around 1561.65mJ and once the maximum deformation is reached the curve drops completely flatens out.
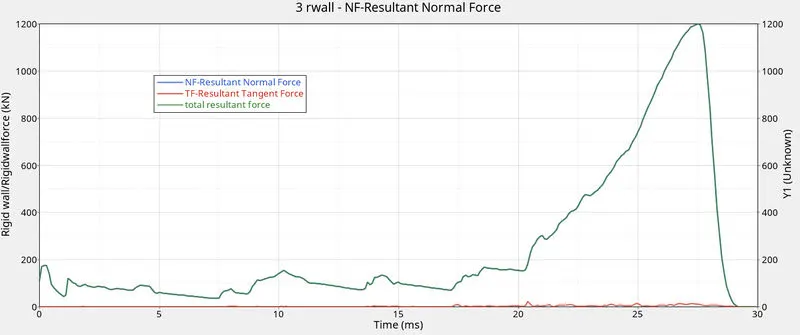
RIGID WALL FORCES
In the case of Rigid wall forces, the peak magnitude achieved is 1199.77kN
When the force with high velocity is acting on the crush tube, there will be a slight change in shape which is called deformation. When the deformation is taking place there will also be an opposite force acting from the rigid wall. There comes time, when the deformation on the body will be very high and the opposite force coming from the rigid wall will also be high. Once the deformation is maximum, the velocity will drop down to zero and in turn, the Rigid body force also drops down to zero. In this case the Rigid wall force is less compared to previous cases.
CASE 5: IMPORT THE STARTER FILE AND CREATE A MID NOTCH
Import the starter file and remove all the notches and then create a new notch at mid
To create a notch
Go to Allign node >> select previous notch node >> select frst and second node as previous notch >> Select Third node as where to create mid notch >> create

ALLIGN NODE TAB
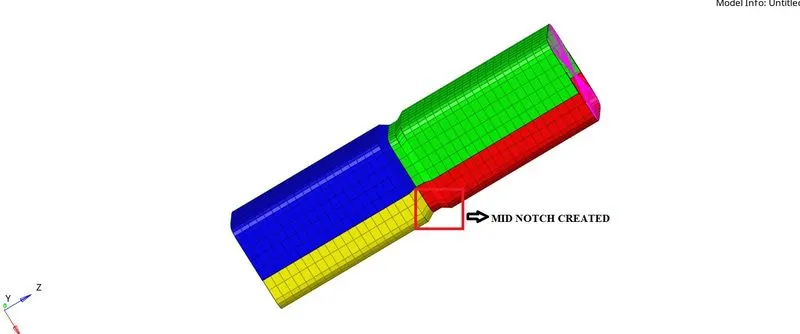
MIDDLE NOTCH CREATED
Now save the file into the folder and run
Once the simulation done, Open engine out file write down all the value
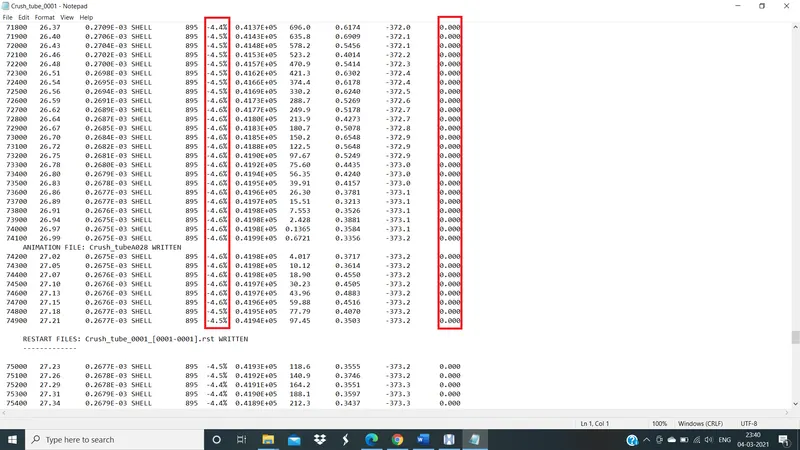
ENGINE OUT FILE
Now open the animation
For that
Go to Hyperveiw >> Select animation file >> Apply
To see von-mises
Go to contour in hyperveiw >> Select von-mises >> Select: Simple >> Apply
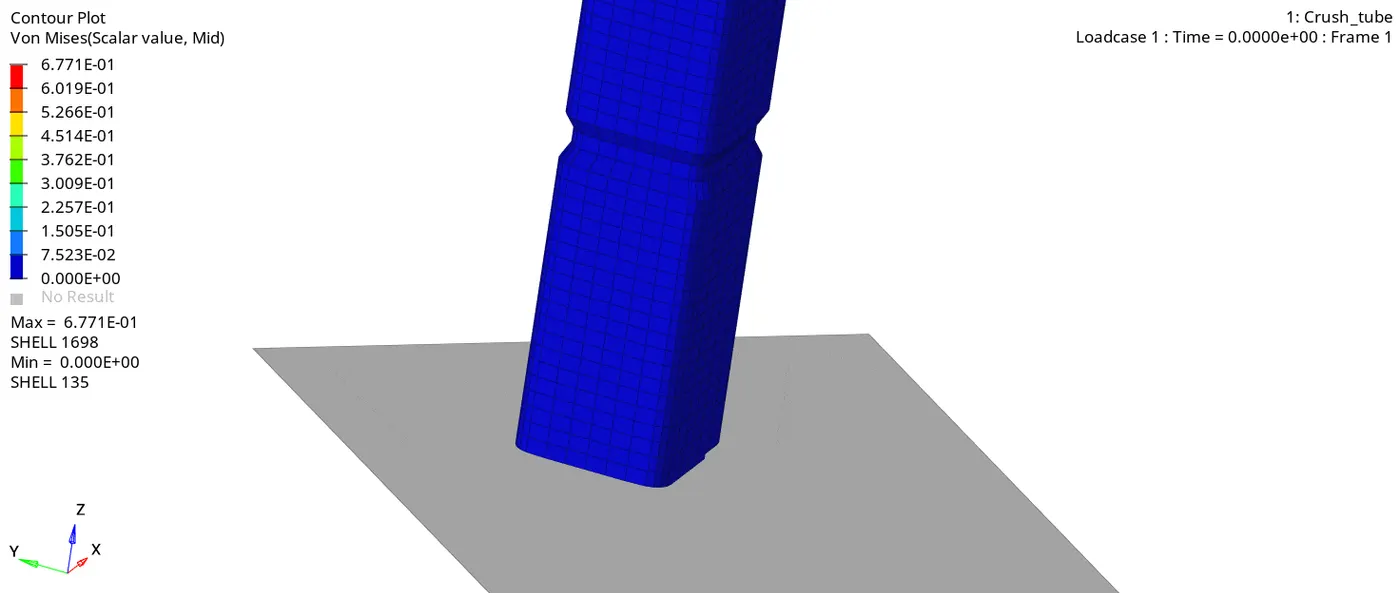
VON-MISES
After checking animation file we have to plot the graphs
For that
Go to Hyper graph 2D >> Select T01(Time history file) >> Select x-type = Time >> Y-type = Global variable >> Y-request = Internal, kinetic, contact, Hour glass and Total energies >> MAG(Magnitude) >> Apply
Plot graphs for global variables and rigid wall forces:
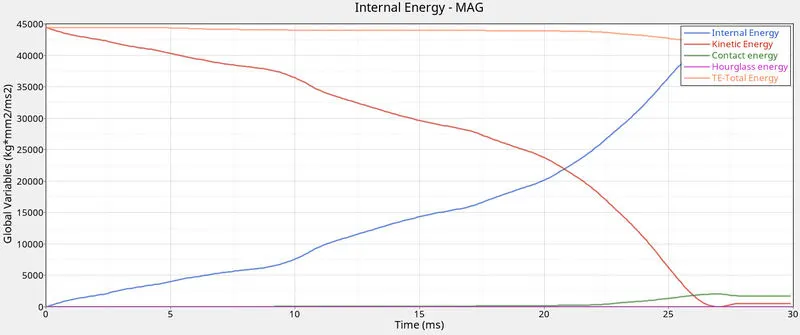
GLOBAL VARIABLE GRAPH
Contact energy:
Contact Energy is the energy acting opposite to the system to prevent the penetration acting on the system. When the force is applied on the body, the crush tube starts to deform but the penetration happening is low in the initial stage. The contact energy will below. Once the deformation is maximum, the elements will be forced to penetrate but the opposite force which is contact energy will also increase which helps in the prevention of penetration. Once the deformation ends, the contact energy will become zero and will stay constant thereafter. In this case, the contact energy incurred is more when compared to case 1 and case 2. This is due to only one notch at the centre which increases the rate of deformation, which intern increases the rate of penetration.
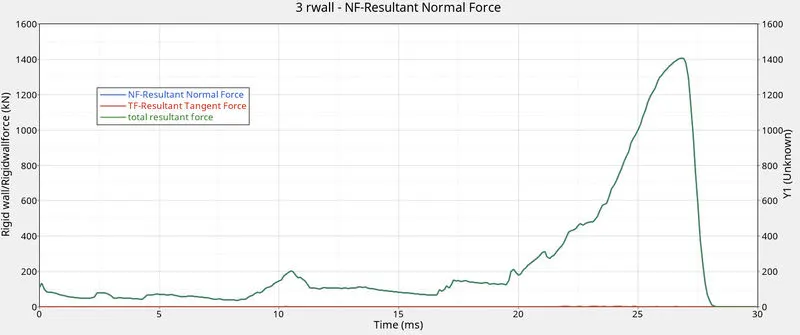
RIGID WALL FORCES
When the force with high velocity is acting on the crush tube, there will be slight change in shape which is called deformation. When the deformation is taking place there will also be an opposite force acting from the rigid wall. There comes time, when the deformation on the body will be very high and the opposite force coming from the rigid wall will also be high. Once the deformation is maximum, the velocity will drop down to zero and in turn the Rigid body force also drops down to zero.
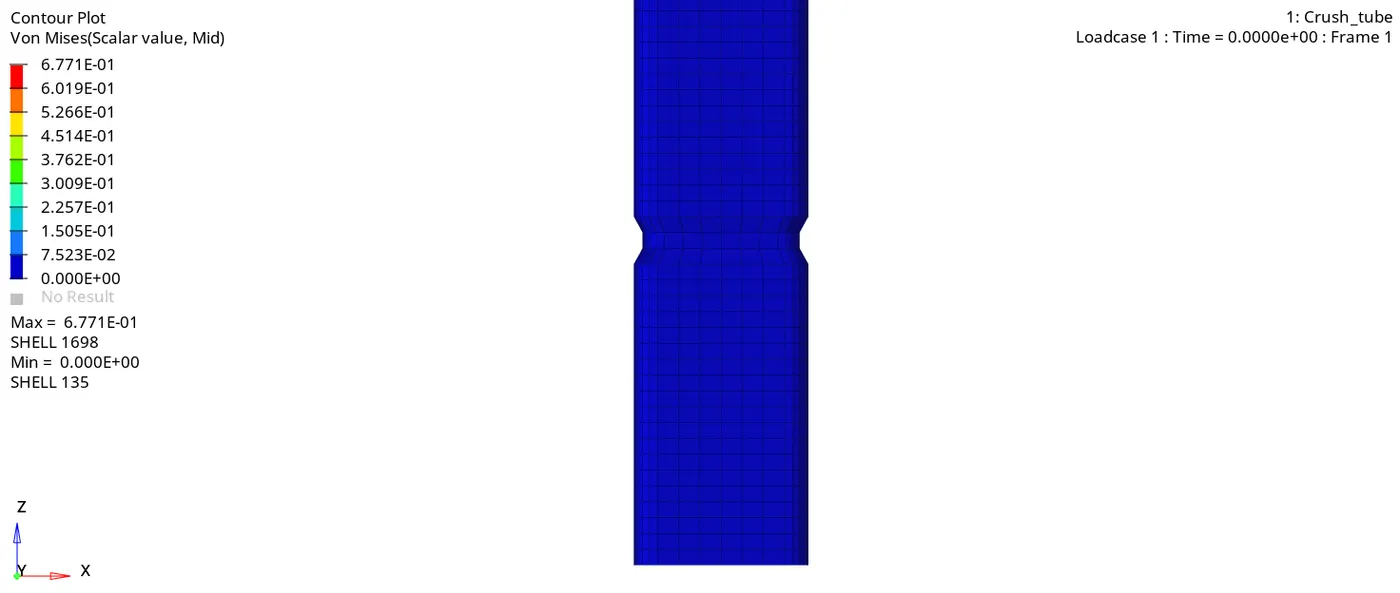
Max von Mises Stress: 6.771E-01 MPa
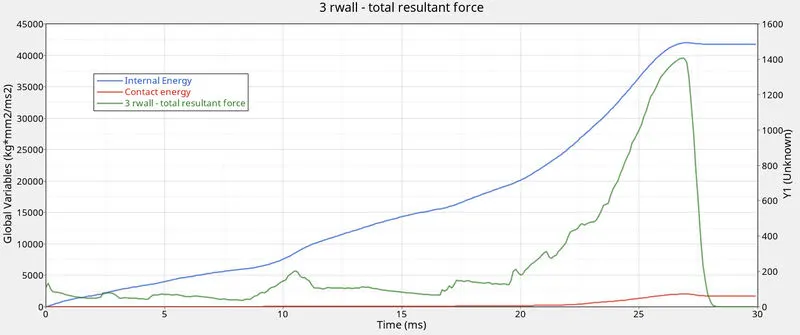
Max Internal Energy: 41984.9 kgmm2/ms2 at 27.1 ms
Max Contact Energy: 2034.73 kgmm2/ms2 at 27.1 ms
Rigid wall force: 1407 KN at 26.8 ms
CASE 6: IMPORT STARTER FILE AND CREATE OPPOSITE SIDE NOTCH
Import the starter file and remove all the notches and then create a new notch at mid
To create a notch
Go to Align node >> select previous notch node >> select frst and second node as previous notch >> Select Third node as where to create mid notch >> create
ALLIGN NODES
As explained in case 4 and case 5, create the notch only at the 2 faces of the tube as shown below
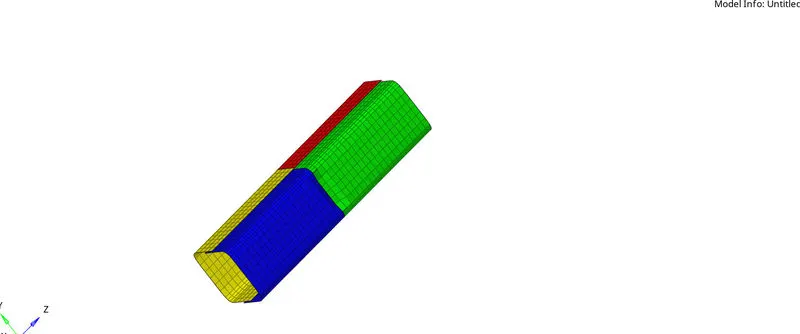
CREATED TWO OPPOSITE NOTCHES
At the end of the simulation, do the energy error and mass error checks and determine whether results would be acceptable
Open the save location file and click on the output file of the simulation to check for the Energy error and Mass error.
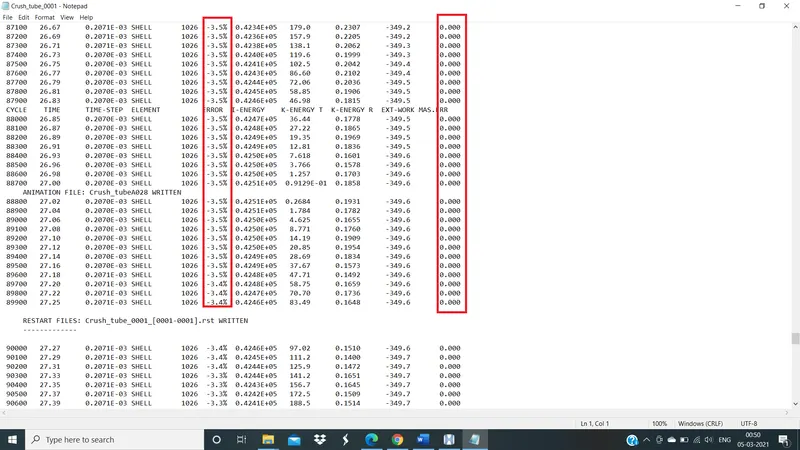
ENGINE OUT FILE
Now open the animation
For that
Go to Hyperveiw >> Select animation file >> Apply
To see von-mises
Go to contour in hyperveiw >> Select von-mises >> Select: Simple >> Apply
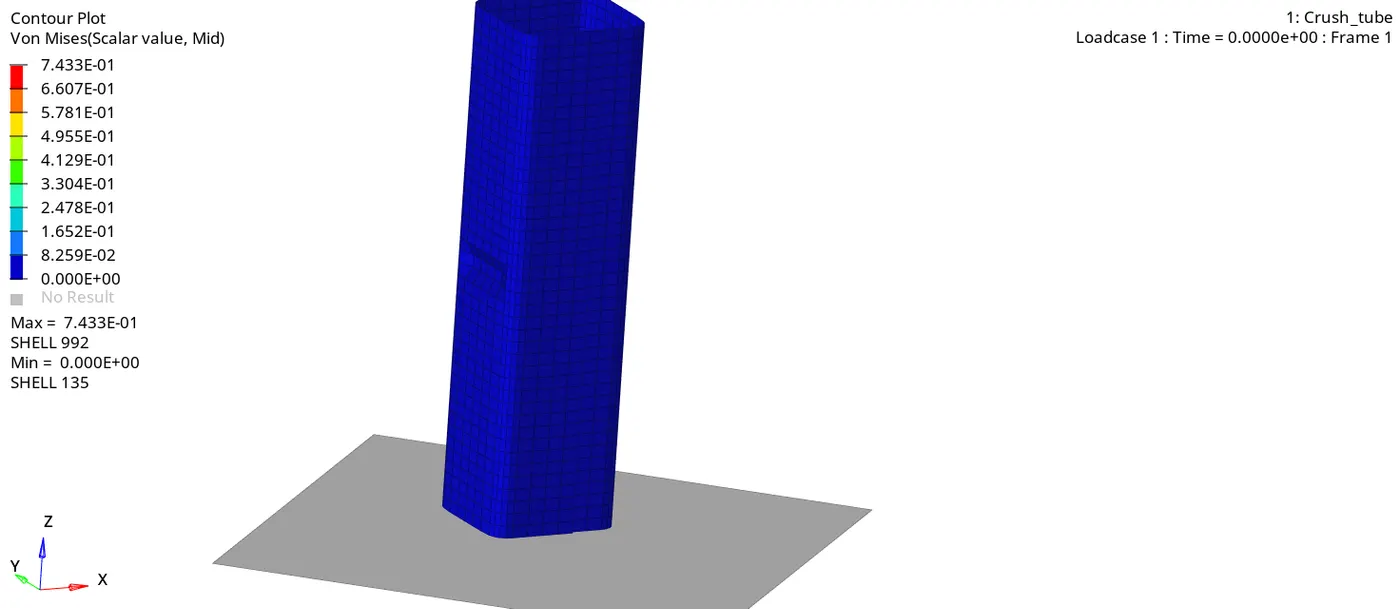
VON-MISES
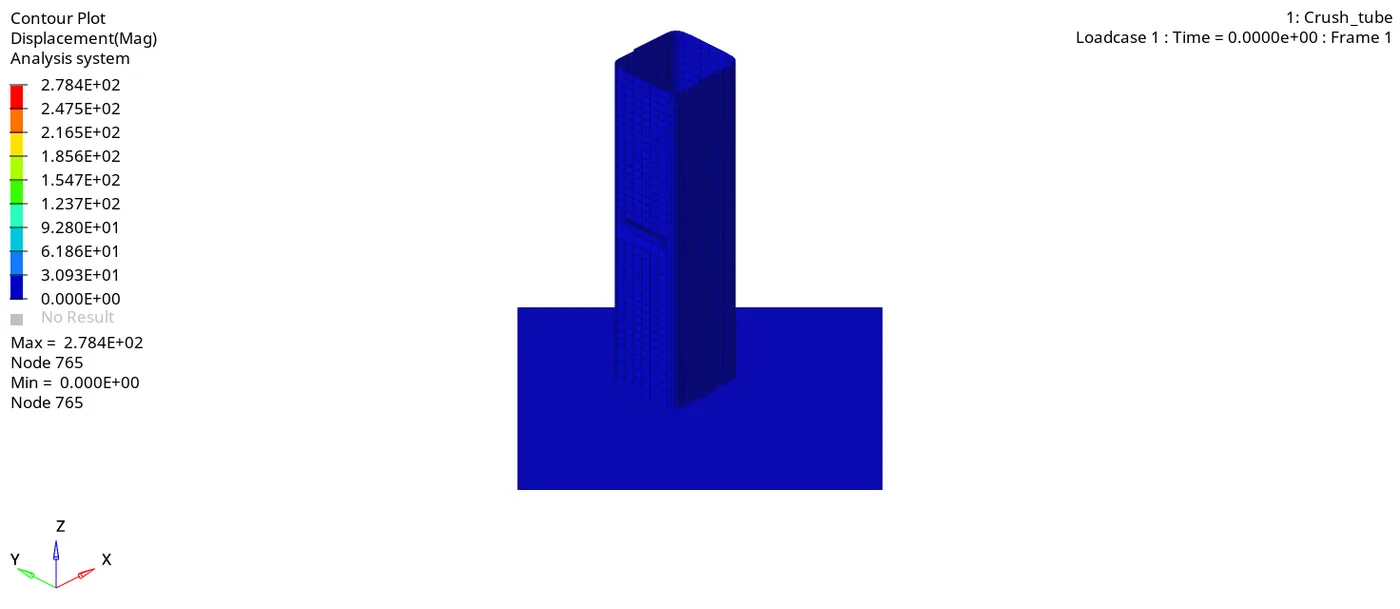
DISPLACEMENT
- Deformation takes at the middle notch of the model due to applied velocity due to stress concentration near the notch
- After complete deformation of the notch. The next deformation occurs at the bottom which is near to the Rigi wall is because the thickness is less at the bottom which is 2.1mm
After checking the animation file we have to plot the graphs
For that
Go to Hypergraph 2D >> Select T01(Time history file) >> Select x-type = Time >> Y-type = Global variable >> Y-request = Internal, kinetic, contact, Hourglass and Total energies >> MAG(Magnitude) >> Apply
Plot graphs for global variables and rigid wall forces:
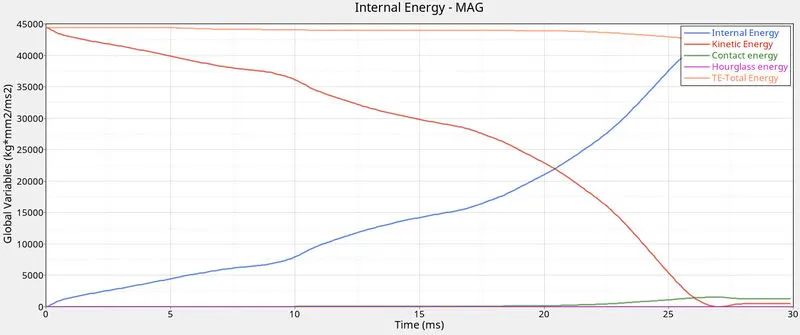
GLOBAL VARIABLES GRAPH
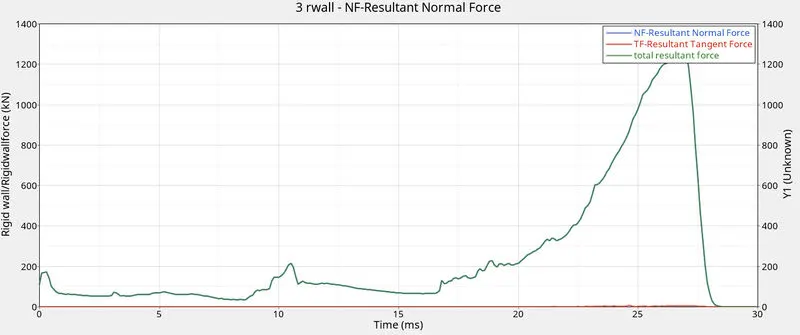
RIGID WALL FORCES
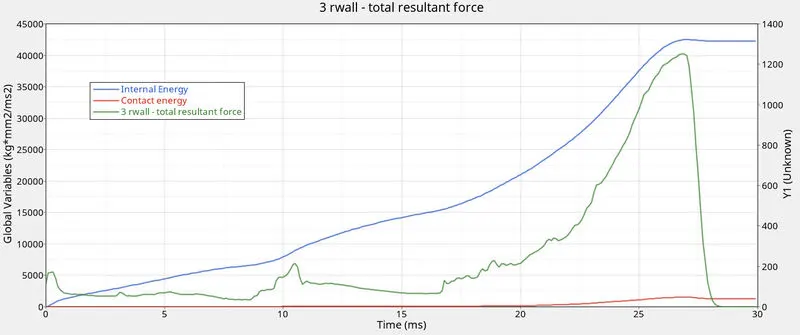
When the force with high velocity is acting on the crush tube, there will be a slight change in shape which is called deformation. When the deformation is taking place there will also be an opposite force acting from the rigid wall. There comes time, when the deformation on the body will be very high and the opposite force coming from the rigid wall will also be high at 27ms. Once the deformation is maximum, the velocity will drop down to zero and in turn, the Rigid body force also drops down to zero. The graph is similar to the previous case but there is a slight increase in the magnitude because the number of the notch is 2, hence the force required to deform the component is high when compared to case 5.
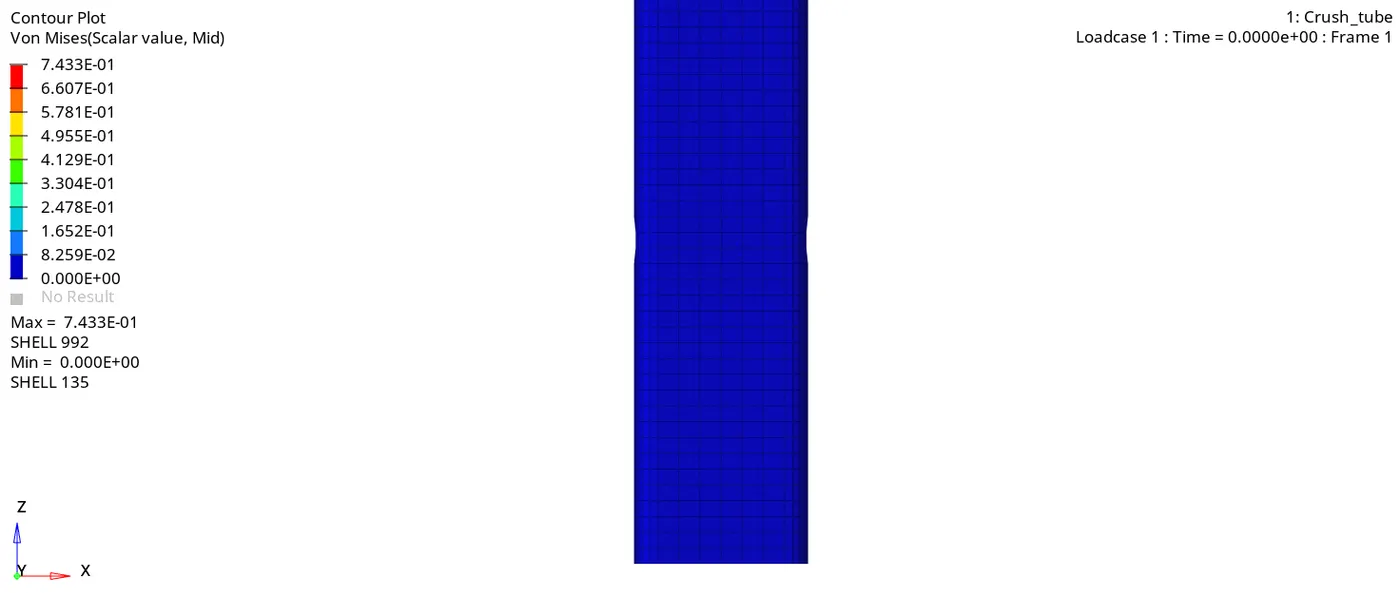
Max von Mises Stress: 7.433E-01. MPa
Max Internal Energy: 42506.10 kgmm2/ms2 at 26.9 ms
Max Contact Energy: 1544.82 kgmm2/ms2 at 27.0 ms
Rigid wall force: 1252.51KN at 26 ms
How does the notch affect the results?
Notch affects the results because without notch the structure behaves stiffer due to stiffer so we can see more stress.
COMPARISONS:
CASE 1 vs CASE 2:
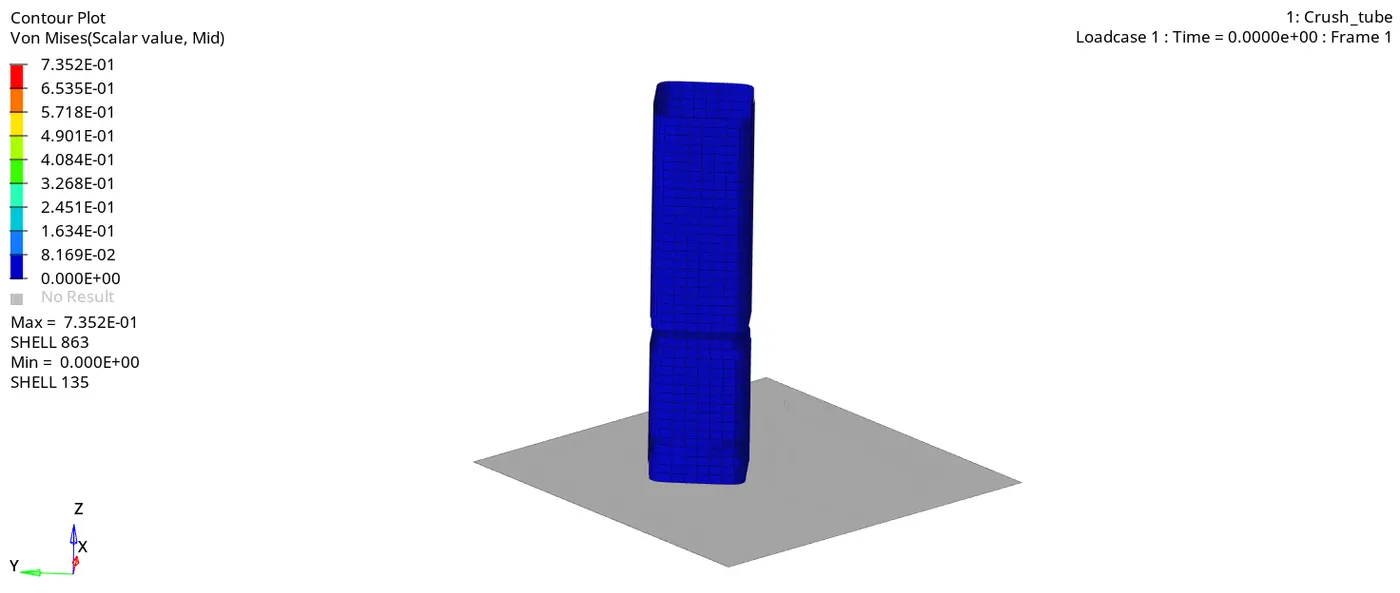
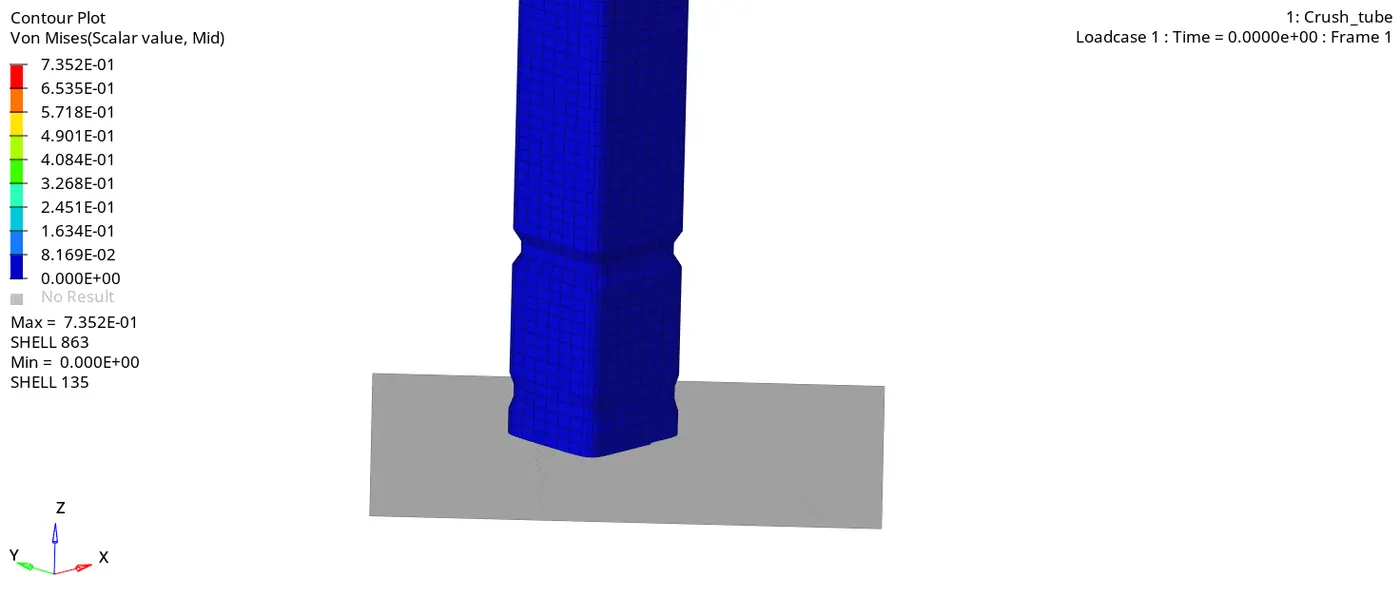
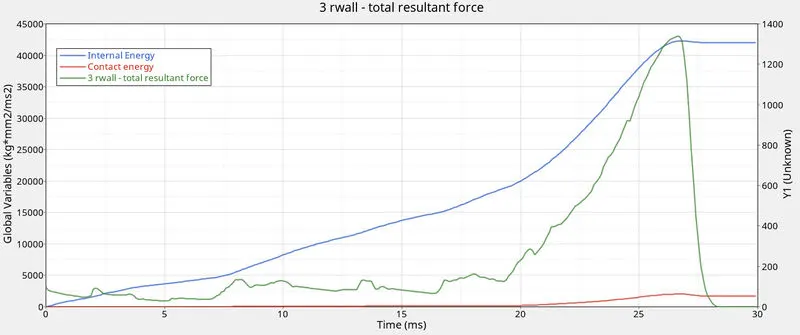
CASE 1 CASE 2
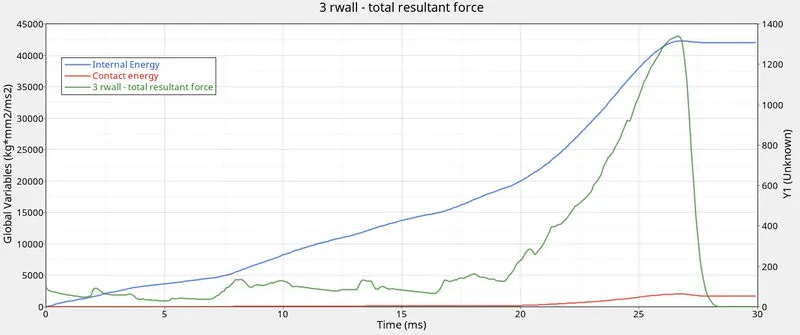
We can see and compare the difference in the number of energies that were recorded during the simulation. In Case1 we can see that the Internal Energy is around 42273 mJ whereas in Case2 it was recorded as same In the magnitude of The Contact energy and the Rigid wall forces, there is not much of a difference between them.
In both Case1 and Case2, we have recorded a Contact Energy of 2029.77mJ and a Rigid Wall Force of 1338 kN.
In terms of the property changed, we have only changed the property of Inacti and changed the value of it to 6. Since there were no penetrations in either Case1 and Case2
Case 1 took 400 sec to run the simulation where case 2 took 417 sec somehow both are the same
CASE 3 vs CASE 4:
CASE 3 CASE 4
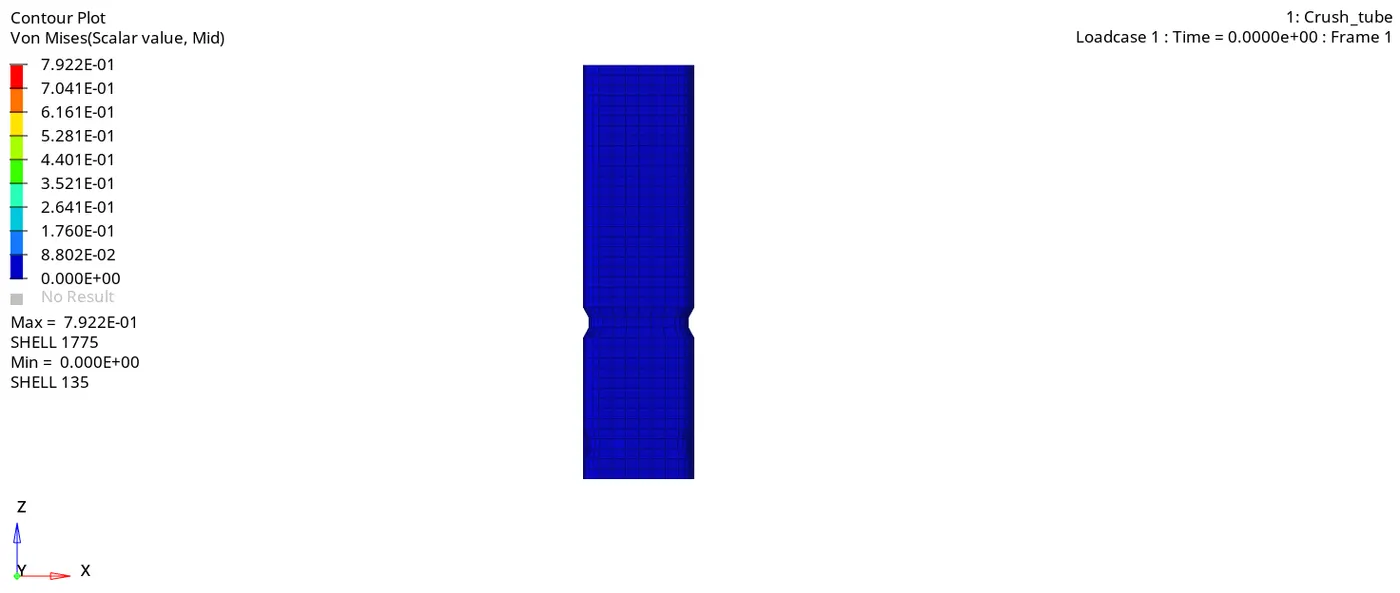
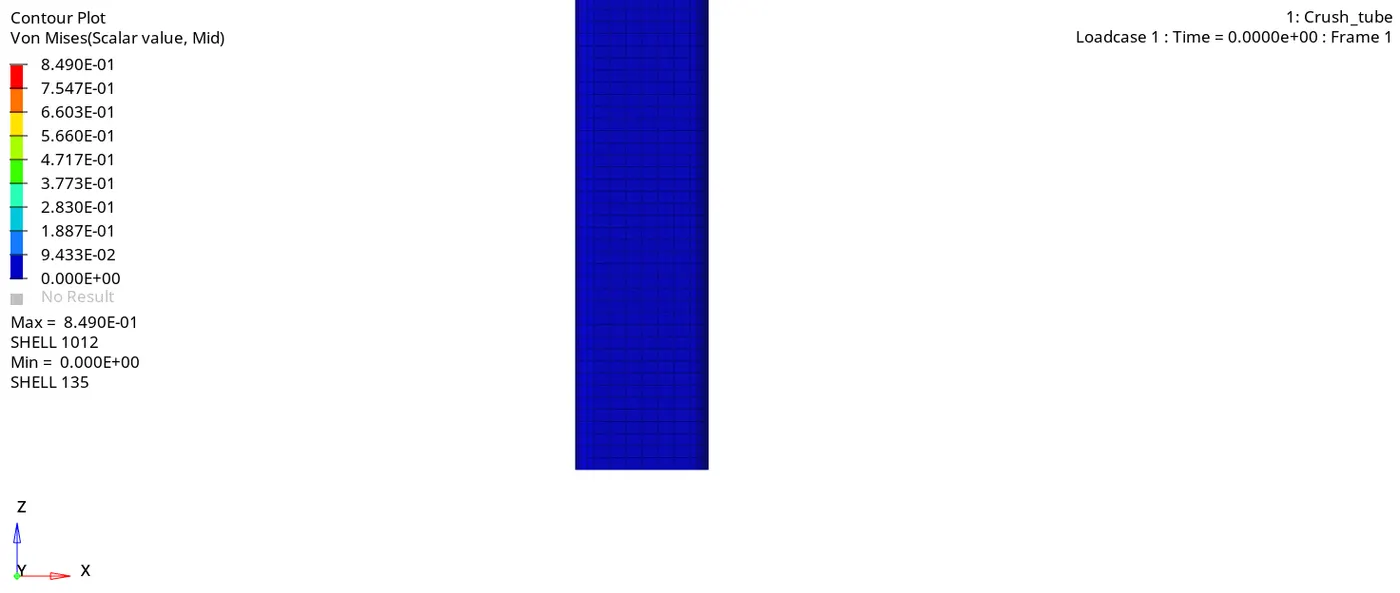
We can see a change in the energies when we compare these two cases. In the case of Internal Energy in the two cases, the peak values are very much comparable. In case3 the Internal Energy peaked at 40617mJ and in Case4 the energy peaked a 42593.89mJ. In Case4, the deformation is also much more uniform as well. In Case3, the specimen starts to buckle earlier than in Case4.
Since we have removed the notches and the Boundary conditions, we get a lesser value of Rigid Wall forces.
From this, we can conclude that Notches help in creating a region of Stress Concentration in the tube and when we remove the notches, the specimen is bound to fail earlier.
Case 3 took 922 sec to run the simulation where case 4 took 174 sec here case 3 took more time but in case 4 we remove boundary condition and notches so it took less time to run
CASE 5 vs CASE 6:
CASE 5 CASE 6
We can see a difference in the internal energy of the two cases. In Case5 we have the Internal Energy peaked at 41984mJ but whereas in Case6, the internal Energy has peaked at around 42506mJ both are having same range
But when we compare the Contact energies of the two cases we have a different view. In Case5 we have a Contact Energy of approximately 2034.73mJ but whereas in Case6, we have the contact energy peaked at 1544.83mJ. From this, we can say that Case5 has much more deformation than in Case6.
In the Rigid Wall Forces for both the cases we see it decreasing from 1409kN in Case5 to 1252kN in Case6. This can indicate that the Specimen is applying more force onto the Rigid wall in Case5 than in Case6.
In case 5 the simulation time is 395 sec whereas case 6 took 504 sec to run the simulation
Conclusion :
All the required cases have been simulated with recommended data. From the above simulation, case 1 and case 2 are similar. In case 3 the notch was removed and simulation was run, where the stiffness of the material is more and the amount of energy absorbed was comparatively less. In cases 4,5 and 6 the notches were reworked which resulted in variation in internal energy.