Sensitivity Analysis on combustion of methane using GRI-MECH
Objective:
To find the 'n' reactions in GRI-MECH 3.0 to which a given component is most sensitive to using Cantera.
Theory:
Sensitivity analysis is used to get a quantitative measurement of how changes in an input parameter to a mathematical model (which takes many inputs) change a given output. In simple words, sensitivity analysis helps in finding the input parameter, changing which will vary the output most.
This can be used to find reactions (inputs) to which temperature (output) is most sensitive during the combustion (mathematical model) of methane. By adjusting the rate of these reactions we can easily alter the temperature rise & hence the ignition delay.
Cantera (a python package) has the capability to find the sensitivity of a given output parameter. The ODEs describing the output parameter are solved and the difference between the output parameter values at the previous and current time step with respect to a given input parameter gives the sensitivity.
Coding approach:
- All the functionality needed to get reactions to which a component is sensitive is wrapped up in the 'sensitivity_wrt()' function.
- The function takes the 'component' name (output parameter), an initialized gas object, and a number of top 'n' reactions to which the 'component' is sensitive to.
- Inside the function, first, the reactor network is made with ideal gas constant pressure reactor. Then sensitivity reactions are enabled for each reaction in the reaction mechanism.
- Next, the combustion is simulated from `0` to `2` `ms` with a time step of `0.005` `ms`. After each time step, the sensitivity of temperature to each reaction in the mechanism is computed & saved into a solution array.
- Now, a class 'sen_rxn' is made for storing data related to a reaction.
- In the subsequent 'for loop', a list of 'sen_rxn' objects are made. Each object in the list stores the reaction equation, absolute component (e.g. temperature) sensitivity and component (e.g. temperature) sensitivity.
- Next, the list is sorted according to absolute maximum component (e.g. temperature) sensitivity, and then the sensitivity values are normalized with respect to the highest absolute sensitivity.
- Finally, the results are plotted in a horizontal bar chart.
#=======================================================================================
import matplotlib.pyplot as plt
import cantera as ct
import numpy as np

#%%
def sensitivity_wrt(component: str, gas, n: int):
    """Finds top 'n' most sensitive reactions to 'component' in reaction mechanism of 'gas'"""
    # Input validations
    if component not in ['mass', 'temperature', *gas.species_names]:
        raise TypeError("'Component' should be 'mass', 'tempearture' or a species in reaction mechanism of 'gas'")
    if n > gas.n_reactions or n < 1:
        raise TypeError(f"The 'gas' object reaction mechanism has {gas.n_reactions} reactions so, 'n' should be 1 < n < {gas.n_reactions}.")

    if not isinstance(n, int):
        raise TypeError("Improper input 'n'. Should be an integer")

    # Making reactor network
    r = ct.IdealGasConstPressureReactor(gas, name='R1')
    sim = ct.ReactorNet([r])

    # Enables sensitivity with respect to the rates of all reactions in reaction mechanism
    for i in range(gas.n_reactions):
        r.add_sensitivity_reaction(i)

    # setting tolerances for solution
    sim.rtol = 1.0e-6
    sim.atol = 1.0e-6
    # Setting tolerances for sensitivity equations
    sim.rtol_sensitivity= 1.0e-6
    sim.atol_sensitivity= 1.0e-6
    # Solving
    states = ct.SolutionArray(gas, extra=['t', 'C_sen'])
    dt = 5e-6
    for t in np.arange(0, 2e-3, dt):
        sim.advance(t)

        C_sen = [] # stores 'component' sensitivity to the i th reaction
        for i in range(gas.n_reactions):
            # Sensitivity of 'component' with respect to
            # 'i' th reaction in the reaction mechanism of 'gas'
            C_sen.append(sim.sensitivity(component, i))

        states.append(r.thermo.state, t=1000*t, C_sen=C_sen)

    # Class for storing reaction
    class sen_rxn():
        def __init__(self, abs_max_sen, sen, name) -> None:
            self.abs_max_sen = abs_max_sen
            self.sen = sen
            self.name = name

        def __repr__(self) -> str:
            return f"{self.name}, abs_max_sen:{self.abs_max_sen}, sen:{self.sen}"

    lst = []
    for i in range(gas.n_reactions):
        abs_max = 1e-30
        for num in states.C_sen[:, i]:
            if abs_max <= abs(num):
                abs_max = abs(num)
                sen = num

        # Name of reaction
        name = sim.sensitivity_parameter_name(i).split(': ')[1]

        s = sen_rxn(abs_max, sen, name)
        lst.append(s)

    # Sorting based on absolute max sensitivity
    lst.sort(key= lambda s:s.abs_max_sen, reverse= True)
    # Normalising
    for rxn in lst:
        rxn.sen = rxn.sen/lst[0].abs_max_sen

    # Plotting
    _, axs = plt.subplots(1,1, figsize=(14,8), layout='tight')

    for rxn in list(reversed(lst[0:n])):
        axs.barh(rxn.name, rxn.sen, color=(0.2, 0.6, 0.9, 0.6))
        ha = 'left' if rxn.sen < 0 else 'right'               # horizontal alignment of datatip
        va = 'center'                                         # vertical alignment
        plt.text(rxn.sen, rxn.name, f" {rxn.sen: .3f} ", ha=ha, va=va) # text in datatip

    axs.set_ylabel('Reaction', fontsize=16)
    axs.set_xlabel(f"{component} sensitivityn(normalized) $\longrightarrow$", fontsize=16)
    plt.show()

#%%
# Driver code
gas = ct.Solution('gri30.yaml')
gas.TPX = 1500, ct.one_atm, {'CH4':1, 'O2':2, 'N2':7.52}

sensitivity_wrt('temperature', gas, 10)
#=======================================================================================
Inferences:
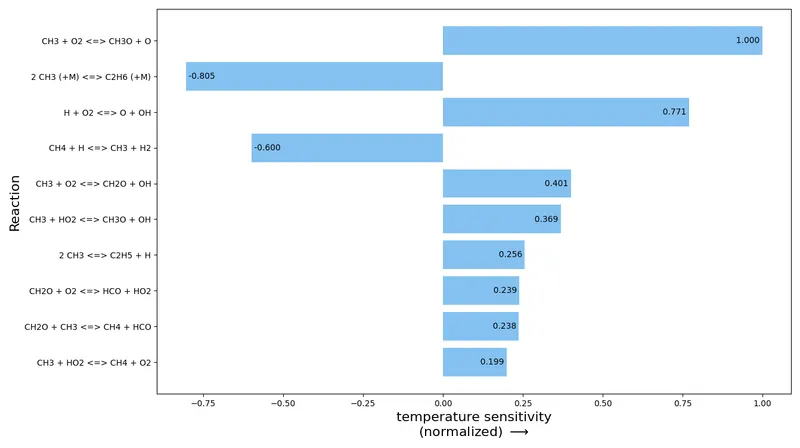
- From the above plot, it can be seen that temperature has the most positive sensitivity to reaction `CH_3 + O_2 <=> CH_3`. An increase in the rate of this reaction will cause a rise in temperature which will decrease ignition delay.
- Temperature has most negative sensitivity to reaction `2CH_3(+M) <=> C_2H_6(+M)`. An increase in rate of this reaction will cause a fall in temperature which will increase ignition delay.
- The same is true for other reactions in the chart. So, by fine tuning the reaction rates of the above reactions we can fine-tune the ignition delay during combustion.