Week 9 - Senstivity Analysis Assignment
[SENSITIVITY ANALYSIS REPORT]
AIM:-Sensitivity analysis of each reaction with respective to Ignition Delay.
Objective:-
- Write a code that takes all the reactions from the GRI mechanism and calculates 10 most sensitive reactions.
- The sensitivity parameter should be with respect to the Temperature.
- Consider the initial conditions as shown in the video.
- Program should show the reaction strings in the order of greatest sensitivity to the least sensitivity of the respective Reactions.
Theory:-
As we have seen in the Previous challenge Ignition Delay is the function of the Temperature, Pressure and the Equivalence ratio of the fuel and As we know that in any reaction Mechanism there will be involvement of Elementary reactions, The rate of these reactions effects the entire Mechanisms. So, we have to figure out which reaction affects the Ignition Delay that is why we perform Sensitivity analysis.
Sensitivity basically, is the process to get relationship between the Parameters and the Output's of a Model (example:- Effect of each Reaction on the Temperature or rate of species concentration).
A Generic ODE System's is represented as:-
`(dZ)/dt = f(Z,t,a)` a = represents here, differents reaction's
`Z = (T, Y1, Y2.....Yk)^T`
Z = Variable vector of species and Temperature
`W(j,i) = (dZj)/(dai)` First order sensitivity
j = Independent variable
i = number of reactions
a = Net reaction rate multiplier (perturbation factor)
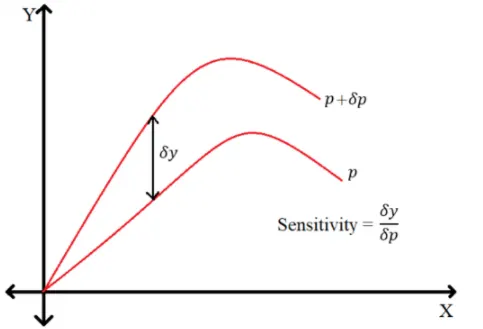
Suppose 'P' is the parameter and Consider output as y, So, the rate of change of y depends in the change of p.
Sensitivity = `(dy)/(dp)`
Sensitivity Analysis on Temperature from GRI Mechanism.
When sensitivity coeffcient is positive means reaction begins faster to ignite and when the Sensitivity coefficient is negative It means reaction takes longer time to Ignite. The upper parts of the reactions should be decreased sensitivity coefficients to decrease the Ignition delay and the lower part reactions should be increased the Sensitivity coeffcient to decrease the Ignition delay.
Python code that takes all the reactions from the GRI mechanism and calculates 10 most sensitive reactions:-
"""
Sensitivity analysis code with respect to Temperature
"""
import numpy as np
import cantera as ct
import matplotlib.pyplot as plt

gas = ct.Solution('gri30.xml')
T = 1500
P = ct.one_atm
gas.TPX = T,P,{'CH4':1,'O2':2,'N2':7.52}
r = ct.IdealGasConstPressureReactor(gas)
sim = ct.ReactorNet([r])

#Extracting the reactions data for methane from GRI mechanism
reactions = gas.reaction_equations()

#number of reactions in GRI mechanism
n = gas.n_reactions

#enable sensitivity with respect to the rates of the first 10 reactions through(0 to 9)
for i in range(n):
	r.add_sensitivity_reaction(i)

#set the tolerance for the Solution and for the sensitivity coefficients
sim.rtol = 1e-6 #relative change in solution should be less than this number
sim.atol = 1e-15 #absolute change in solution should be less than this number

sim.rtol_sensitivity  =1e-6 #relative change in solution should be less than this number
sim.atol_sensitivity = 1e-6 #absolute change in solution should be less than this number

#Creating an array to store the sensitivity values of all reactions
s_max = [0]*n

states = ct.SolutionArray(gas,extra = ['t']) #creating states array of the each reactor

reactions_num = np.arange(1,n+1)

for t in np.arange(0,2e-3,5e-6):
	sim.advance(t)

	states.append(r.thermo.state,t = 1000*t)

	for i in range(n): # i loop for sensistivity to define greatest to lowest
		s = sim.sensitivity('temperature',i)
		if abs(s)>abs(s_max[i]):
			s_max[i] = s

s_abs = np.abs(s_max)

#storting and zipping the data to extract the top 10 reactions
reactions = [a for b, a in sorted(zip(s_abs,reactions), reverse=True)]
reactions_num = [ a for b, a in sorted(zip(s_abs,reactions_num), reverse=True)]
s_max = [ a for b, a in sorted(zip(s_abs,s_max), reverse=True)]

n = 10 #top 10 reactions

max_r = reactions[0:n]
max_n = reactions_num[0:n]
max_s = s_max[0:n]

sensitive_reactions = [0]*n

#print the 10 most sensitive reactions
print('10 most sensitive reactions')
for k in range(n):
	sensitive_reactions[k] = sim.sensitivity_parameter_name(reactions_num[k])
	print('s=',max_s[k],'for reaction',sensitive_reactions[k])

# bar garph for Sensitivity with respect to Temperature
plt.figure(1)
plt.barh(max_r,max_s)
plt.gca().invert_yaxis()
plt.xlabel('Sensitivity')
plt.title('Sensitivity with respect to temperature')

#plot the results
plt.figure(2)
plt.subplot(2,2,1)
plt.plot(states.t, states.T)
plt.xlabel('time (ms)')
plt.ylabel('Temperature (K)')

plt.subplot(2,2,2)
plt.plot(states.t, states('OH').X)
plt.xlabel('time (ms)')
plt.ylabel('OH Mole fraction')

plt.subplot(2,2,3)
plt.plot(states.t, states('H').X)
plt.xlabel('time (ms)')
plt.ylabel('H Mole fraction')

plt.subplot(2,2,4)
plt.plot(states.t, states('CH4').X)
plt.xlabel('time (ms)')
plt.ylabel('CH4 Mole fraction')
plt.tight_layout()
plt.show()
Coding Approach:-
- First of all we have to import all the neccesary modules to Python like Cantera, numpy and matplotlib.pyplot.
- Initialising by creating a gas as a object or instance of Class = Solution from GRI mechanism.
- Setting up the all Initial conditions like Temperature, Pressure and Mole concentrations of 'CH4', 'O2' and 'OH' by TPX method that is already stored in Cantera.
- Then creating instance 'r' of a IdealGasConstPressure reactor = class of the GRI mechanism and after that we create the Reactor network by passing the instance 'r'.
- After that Extracting all the reactions involved in the Methane Combustion from the GRI file.
- Then add all the equations to the sensitivity reaction by add.sensitivity_reaction.
- Add all the relative and Absolute tolerance values for both ODE's and sensitivity to define convergence when we integrate time and all species.
- Creating state object of solution array class to store all the parameters data or thermodyanic properties like temperatrue for each time steps.
- Then Use sim.advance method to intregate the system at each time steps 5e-6 for a simulation time 2e-3 by passing the 't= time' loop.
- After that Append all the states by using append method .
- Inisde the same 't = time' loop for all the reactions Calculating the sensitivity by using .sensitivity method with respect to temperature and the species.
- After that extract the maximum sensititvity for all the reactions by ziping command then we sorting and Ziping the data upto 10 reactions.
- Then plot and print the sensitivity values for top 10 most sensitive reactions.
Output:-
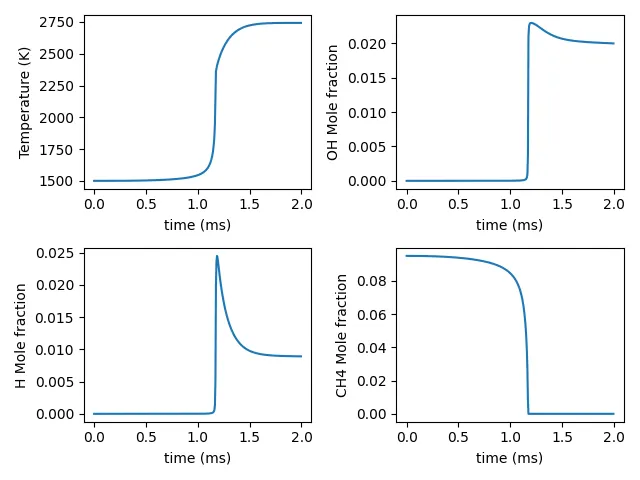
From the above data we can conclude that the Temperature almost constant equal to initial temperature upto 1ms and after the Ignition takes place. It raises immediately and reaches Adiabatic Flame temperature. And we see In the OH plot It remains constant at the initial stage or before Auto-Ignition or almost zero and then when Ignition takes place It raises immediately and after certain time it drops. In the Plot of 'CH4' fuel ignite at low temperature at initial stage Then as the temperature reaches at high temperature Fuel get burnts and mole fraction of 'CH4' goes almost zero which makes sense.
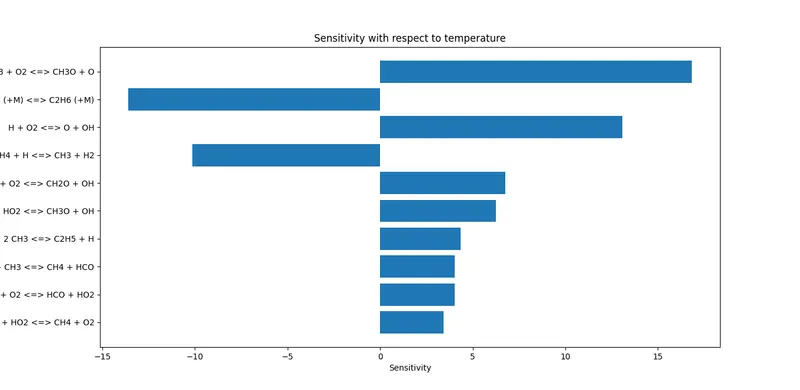
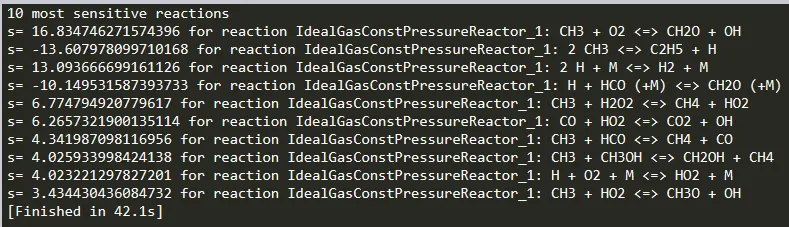
As you see the Sensitivity analysis data on Cantera of the most 10 sensitive reactions from the GRI.30 Mechanism. When sensitivity coeffcient is positive means reaction begins faster to ignite and when the Sensitivity coefficient is negative It means reaction takes longer time to Ignite. As the positive sensitivity tells us the increase in the Initial temperature will also increase the rate of reaction and negative sensitivity means decrease the reaction rate. If the reactions need to takes place rapidly, by tuning the positive sensitivity parameters increase the reaction rates.