Project 1 - Parsing NASA thermodynamic data
AIM:- write a function on MATLAB that extracts the 14 coefficients and calculate the enthalpy, entropy and specific heats for all the species with the help of file parsing concept. In this data we will be reading the 'NASA thermodyanmic data'.
OBJECTIVE:-
- function that extracts the 14 coefficients and calculate the enthalpy, entropy and specific heats for all the species.
- calculate the moelcular weight of each species and display it on window.
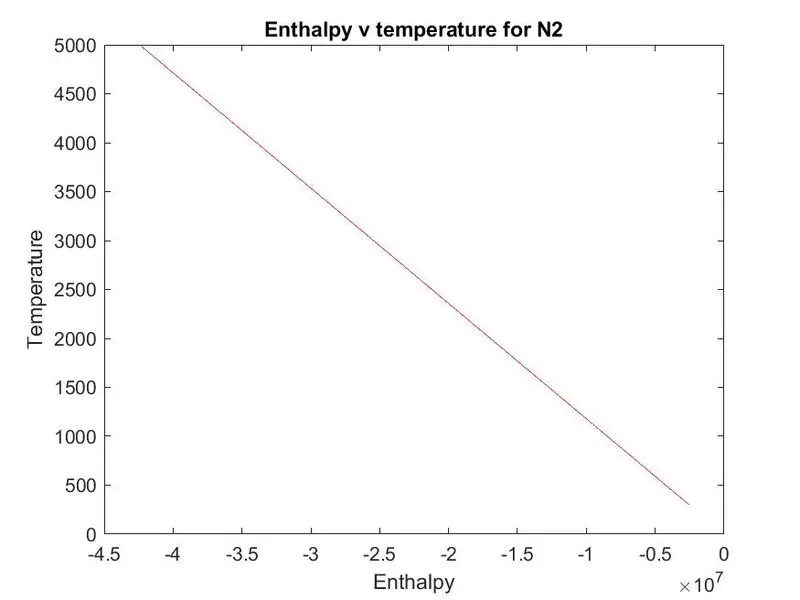
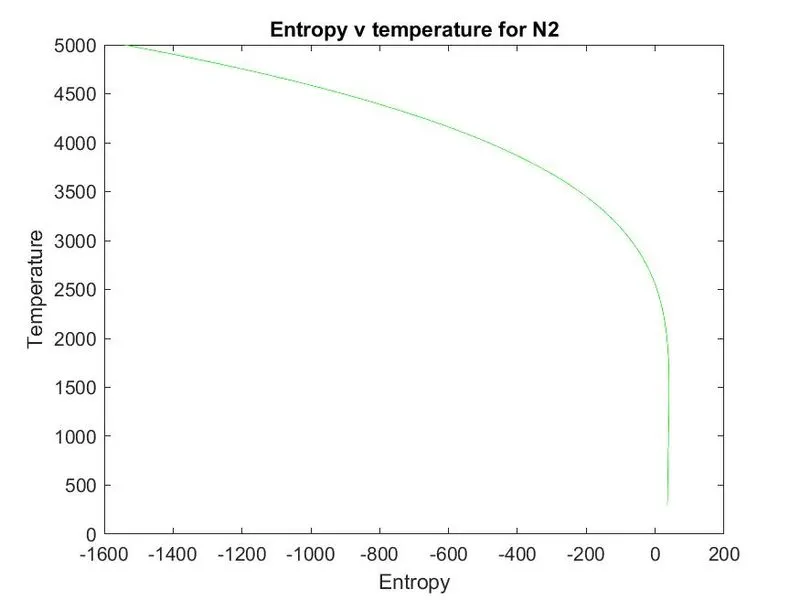
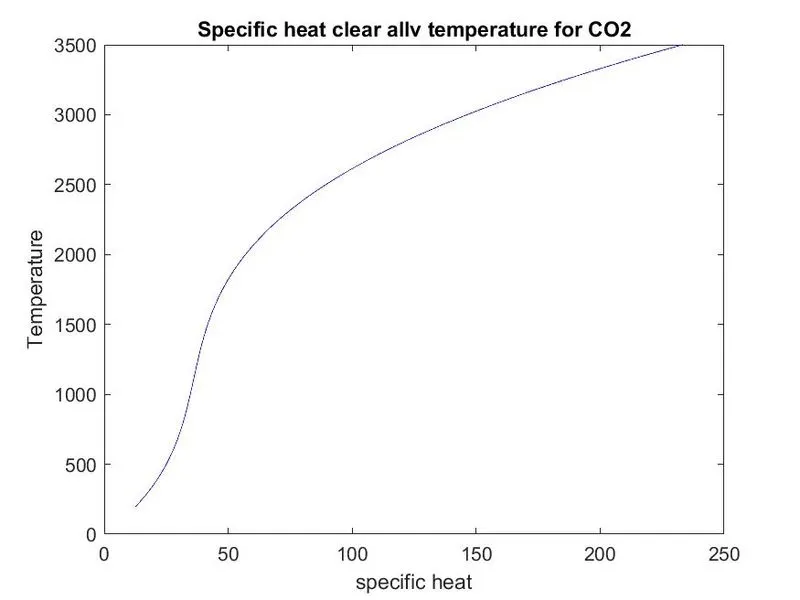
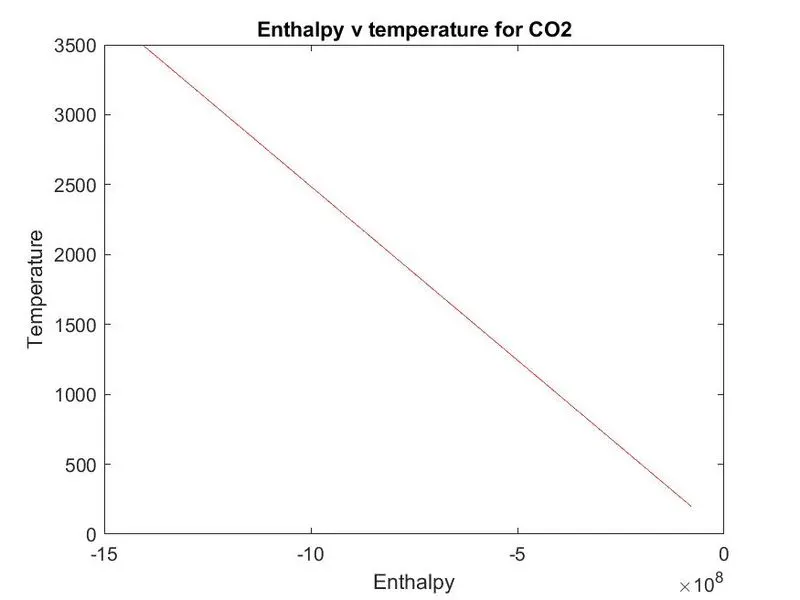
- plot the graphs of cp, enthalpy, entropy for local temperature range (low tempertaure : high temperature) specific for all species.
- save the plots as images with the appropiate names and dump them into a seperate folder fro each species with the situable names. All these will be generated automatically.
- main program that is submit just take 'THERMO.dat' file as input and generate cp ,h and s plots.
THEORY:-
concept of file parsing:- file parsing refers to reading or writing a data stream of some sort and building an in memory model of the semantic content of that data. Parsing splits a file or other input into pieces of data that can be easily stored or manupulated its a very essential technique to read or write any data in MATLAB software.
NASA THERMODYNAMIC FILE:-
NASA thermodynamic file which is 'THERMO.dat' file in which there are global and local temperature ranges and it contains 53 species and each species contains 14 coeffients and local temperature ranges. We have to parse this data and extract all 14 coefficients to calculate the specific heat , entropy and enthalpy.
where,
R = universal gas constant ( J/K-mol)
T = temperature(K)
cp = specific heat(KJ)
s = entropy(KJ/mol-K)
h = enthalpy(KJ/mol)
specific heat:-
The specific heat is the amount of heat per unit mass required to raise the temperature by one degree celsius. The relationship between heat and temperature change is usually expressed in the form of cp
cp = R*(a1+a2*T+(a3*(T).^2)+(a4*(T).^3)+(a5*(T).^4))
Entropy:-
Entropy, the measure of a system’s thermal energy per unit temperature that is unavailable for doing useful work. Because work is obtained from ordered molecular motion the amount of entropy is also a measure of the molecular disorder, or randomness, of a system. The concept of entropy provides deep insight into the direction of spontaneous change for many everyday phenomena.
s = R*(a1*log(T)+a2*T+((a3*(T).^2)/2)+((a4*(T).^3)/3)+((a5*(T).^4)/4))+a7)
Enthalpy:-
Enthalpy, the sum of the internal energy and the product of the pressure and volume of a thermodynamic system. Enthalpy is an energy-like property or state function—it has the dimensions of energy(and is thus measured in units of joules ), and its value is determined entirely by the temperature,pressure and composition of the system.
s = R*T*(a1+(a2*T/2)+((a3*(T).^2)/3)+((a4*(T).^3)/4)+((a5*(T).^4)/5))+(a6/T))
Main code is here:
%program on file parsing and extracting all 14 coefficents in this file


clear all
close all
clc

f1 = fopen('THERMO.dat', 'r');             %to open the file
tline = fgetl(f1);                         %to read the file

%Universal gas constant(J/K mol)
R = 8.314;

%Loop to run the first 4 lines of the data file         %for skipping the first 4 lines
for i = 1:4

    fgetl(f1);

end

%Loop to obtain data and get the plots for each species
for i = 1:53

    %Obtaining the name of the species and converting to a string value
    %for convenience
    tline1 = fgetl(f1);        %to read the species first line
    a = strsplit(tline1, ' ');
    species_cell = a(1);
    species = char(species_cell);       %read the name of species

    %Finding the local values of temperature for each species
    str1 = strfind(tline1, '.');          %finding the string from the line
    low_temp_range = str2num(tline1(str1(1)-4:str1(1)+3));
    high_temp_range = str2num(tline1(str1(2)-4:str1(2)+3));
    mid_temp_range = str2num(tline1(str1(3)-4:str1(3)+3));

    %Obtaining the coefficients from the subsequent three lines
    tline2 = fgetl(f1);
    str = strfind(tline2, 'E');
    a1 = str2num(tline2(1:str(1)+3));            %assigning the variable 'a'
    a2 = str2num(tline2(str(1)+4:str(2)+3));
    a3 = str2num(tline2(str(2)+4:str(3)+3));
    a4 = str2num(tline2(str(3)+4:str(4)+3));
    a5 = str2num(tline2(str(4)+4:str(5)+3));

    tline3 = fgetl(f1);
    a6 = str2num(tline3(1:str(1)+3));
    a7 = str2num(tline3(str(1)+4:str(2)+3));
    a8 = str2num(tline2(str(2)+4:str(3)+3));
    a9 = str2num(tline3(str(3)+4:str(4)+3));
    a10 = str2num(tline3(str(4)+4:str(5)+3));

    tline4 = fgetl(f1);
    a11 = str2num(tline4(1:str(1)+3));
    a12 = str2num(tline4(str(1)+4:str(2)+3));
    a13 = str2num(tline4(str(2)+4:str(3)+3));
    a14 = str2num(tline4(str(3)+4:str(4)+3));

    %a1-a7 are low temperature coefficients, a8-a14 are high temperature
    %coefficients

   %Calculating molecular weight of each species
    Molecular_weight = m_wt(species);
    sprintf('Molecular weight of %s = %d',species, Molecular_weight)

    %Defining T
    T = low_temp_range:high_temp_range;

    %Obtaining the values for Cp, enthalpy and entropy using the coefficients
    if (T>mid_temp_range)
        %specific heat
        Cp = R*(a1 + (a2*T) + (a3*(T.^2)) + (a4*(T.^3)) + (a5*(T.^4)));
        %Enthaply
        H = R*(a1 + (a2*T/2) + (a3*(T.^2)/3) + (a4*(T.^3)/4) + (a5*(T.^4)/5) + (a6*(T)));
        %Entropy
        S = R*((a1*log(T)) + (a2*T) + (a3*(T.^2)/2) + (a4*(T.^3)/3) + (a5*(T.^4)/4) + a7);

    else

        %specific heat
        Cp = R*(a8 + (a9*T) + (a10*(T.^2)) + (a11*(T.^3)) + (a12*(T.^4)));
        %Enthaply
        H = R*(a8 + (a9*T/2) + (a10*(T.^2)/3) + (a11*(T.^3)/4) + (a12*(T.^4)/5) + (a13*(T)));
        %Entropy
        S = R*((a8*log(T)) + (a9*T) + (a10*(T.^2)/2) + (a11*(T.^3)/3) + (a12*(T.^4)/4) + a14);

    end
     %Creating the folder for the species
        t = sprintf('%s', species);
        mkdir(t);              % to make directory

        %Going in to the folder of the species to save the plots
        cd(t)


        %Plotting the curves
        %Cp v temperature plot
        figure(1)
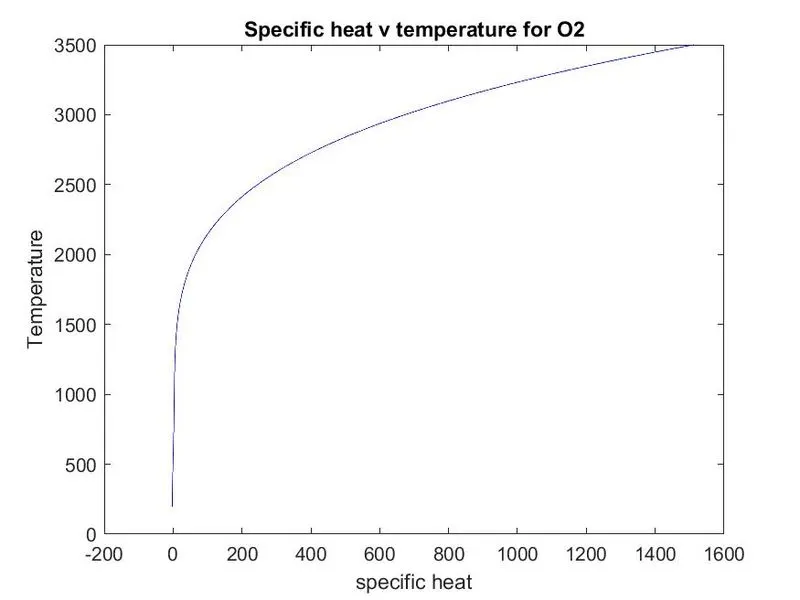
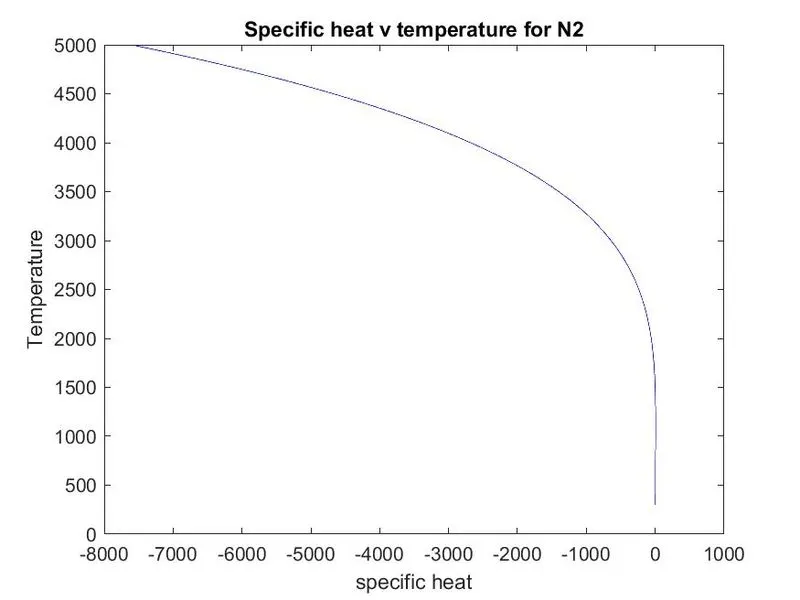
        plot(Cp,T, 'b');
        xlabel('specific heat')
        ylabel('Temperature')
        Cp_text = sprintf('Specific heat v temperature for %s', species);
        title(Cp_text);
        saveas(gcf, 'Cp.jpg');      %to saving the plots

        %Enthalpy v temperature plot
        figure(2)
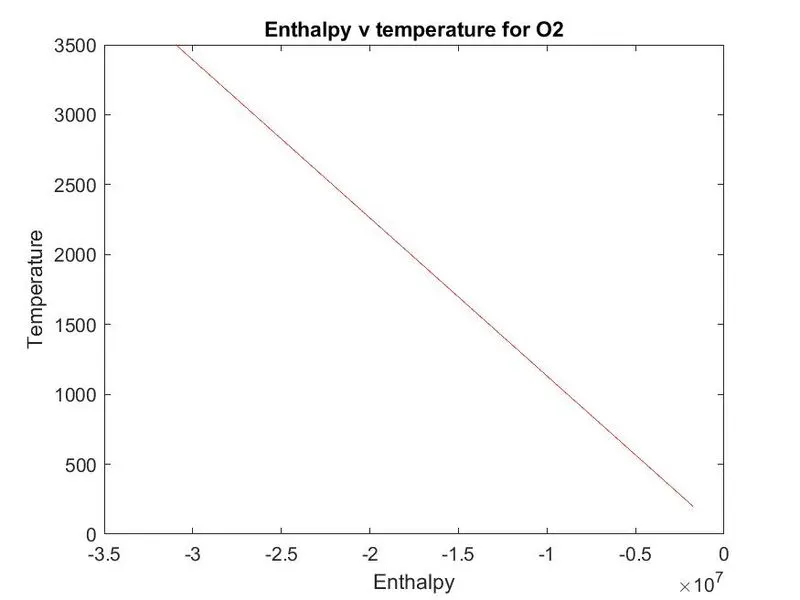
        plot(H, T, 'r');
        xlabel('Enthalpy')
        ylabel('Temperature')
        H_text = sprintf('Enthalpy v temperature for %s', species);
        title(H_text);
        saveas(gcf, 'H.jpg');

        %Entropy v temperature plot
        figure(3)
        plot(S, T, 'g');
        xlabel('Entropy')
        ylabel('Temperature')
        S_text = sprintf('Entropy v temperature for %s', species);
        title(S_text);
        saveas(gcf, 'S.png');

         %Going back to the previous directory
        cd ..;

end
Procedure:
- The program begans with usually clear all , close all and clc to free up the command window and the workspace.
- Then we will parsing a file first we use the fopen command to open the file and then we will use fgetl command to read a file.
- After we use the fopen command we will assigning to the variable called f1.
- now, we will be skipping first 5 lines to enter the pattern of vaues of repective species and for this we will be use for loop coammnd for doing the same.
- The name of the species we will be find out by the strfind command and we will going to find the value of expoential 'E' and by finding out this we know the value of coefficients that we are going to use further.
- The local temperatures for the respective element species is found similarly by strfind command and we are going to locate the string and these strings is converted into numbers by using str2num command.
- now we are going to extract the 53 species and for this we will be using for loop command to get the proeperties (cp,h and s) of 53 species one by one that is varying with temperature.
- we will use fgetl command to read the first line that is assigning (tline1) of spcecies and then we use the strfind command for same purpose that is mentioned above.
- then we will be assigning the variable 'a' to the coeffients and again we are using str2num command to convert strings into numbers.
- again we use fgetl command that we are going to assign it this time tline2 for read the 2nd line of species and doing it repeatedy untill we get 14 coeffcients.
- after we got all 14 coefficients we are going to calculate the enthalpy(h), entropy(s) and specific heat(cp) of each species for we use as a function these properties in this program to make it not tough or ugly.
- The for loop command is used to calculate these peroperties such as h,s and cp and the if-else command is used to find out the required values if the temperture below the mid temperature or above the mid temperature.
- we are also going to calculate the molecular weight of each species and this program we will explain it further and we are going to use as a function name as m.wt
- now, we are going to create a folder by mkdir command and where all the plots of each species are going to save by saveas command.
- after that we are going to plot all the plots of all properties of each species by plot command.
Molecular weight program is here:
function [out] = m_wt(spec)

%Defining the elements
elements=['H','C','N','O','R'];

%Atomic weights of each element
Atomic_Weight = [1 12 14 16 40];
out=0;    %moelculare weight starting range

%Looping for each element inside each species and finding the atomic weight
for i=1:length(spec)
    for j=1:length(elements)
        if strcmp(spec(i),elements(j))
            out= out + Atomic_Weight(j);
            p=j; %p    defining the position
        end
    end

    %loop to multiply the coefficients of the elements if greater than 1.
    n=str2double(spec(i));
    if n>1
        out = out + (Atomic_Weight(p))*(n-1);
    end
end

end
Procedure:
- first we are defining it is a function that is going to use in main code and it is assgning it by name of m.wt(spec)
- This function take as species name(spec) as an input and gives out the molecular weight.
- now, we are going to make array of elements and atomic weight by using this sign [ ]
- molecular weight starting range is set a zero by using out = 0
- we are using for loop command to run the code for each elements and species and now we are going to compare these two strings by using strcmp command.
- The input string is compared with character array , when match occurs associated atomic weight is taken and this atomic weight is going to add with moelcular weight and we got atomic weight.
- if-else command is used checks if a molecule in species has more than one molecule and increases its molecular weight accordingly.
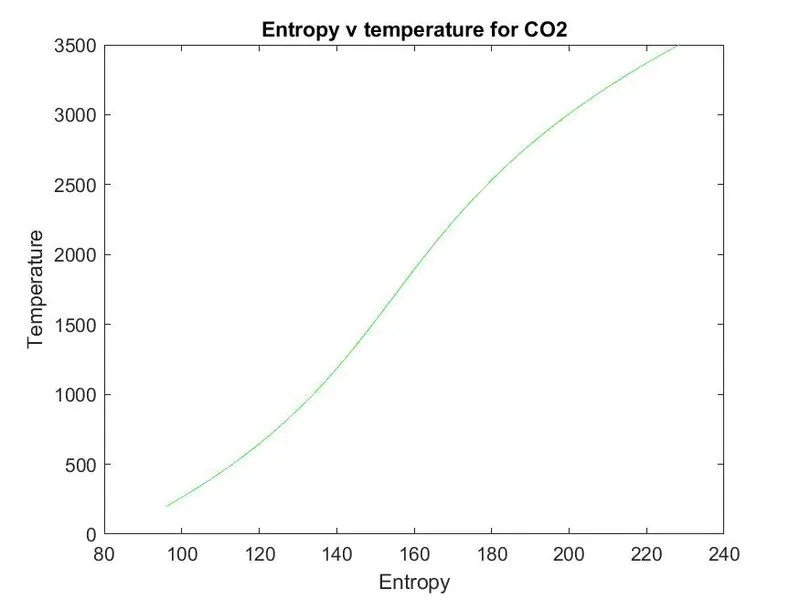
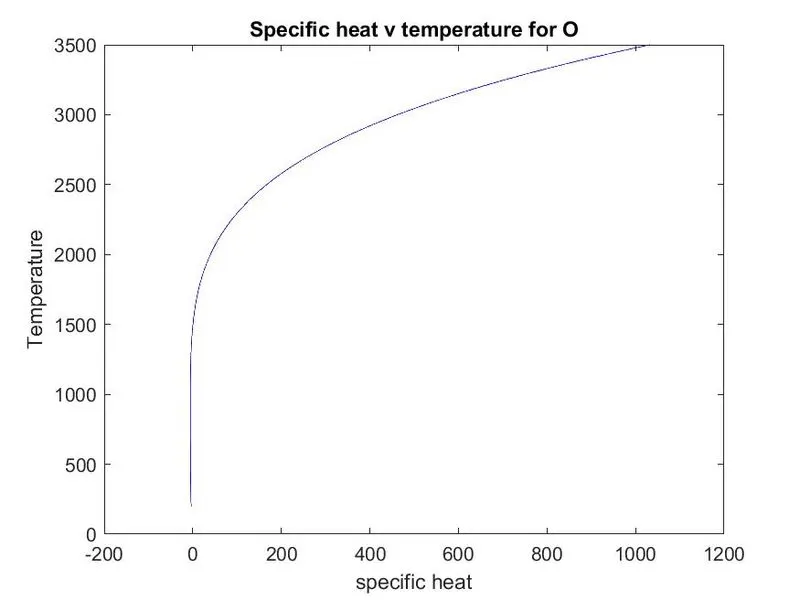
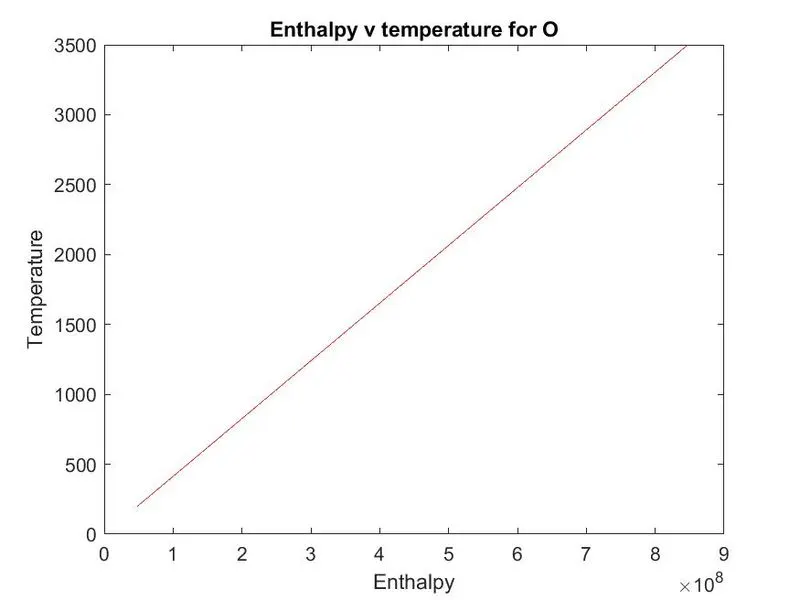
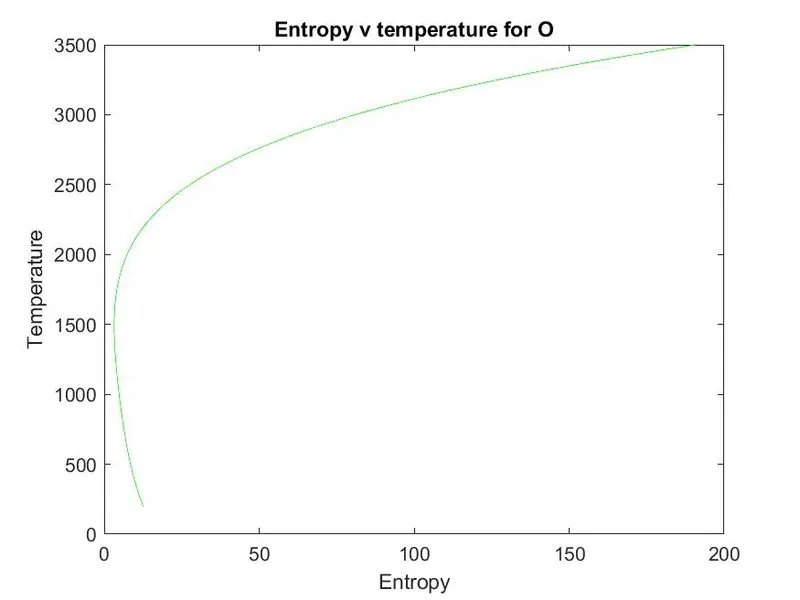
here are the plots of some species:
P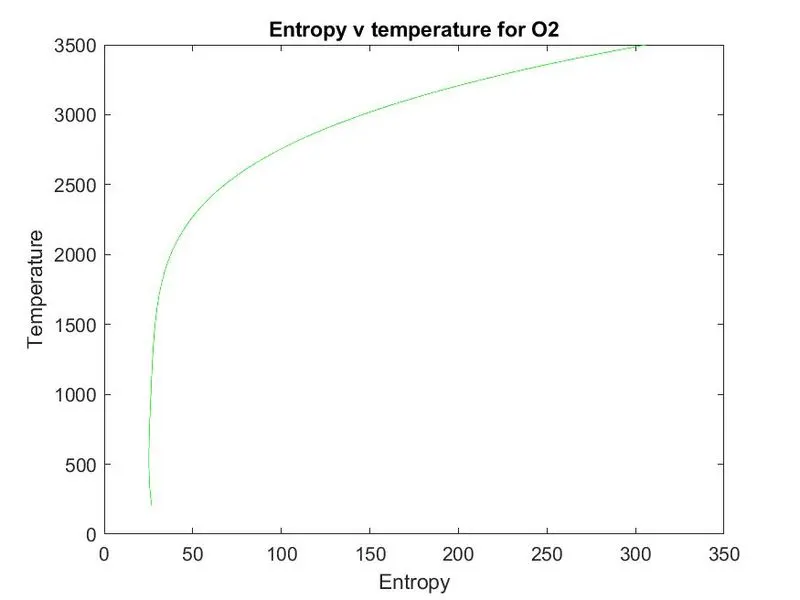 lot of O2
Plot of N2
Plot for CO2
Plot of O
screenhot of window where all the plots are saved

Errors that i was facing during my project
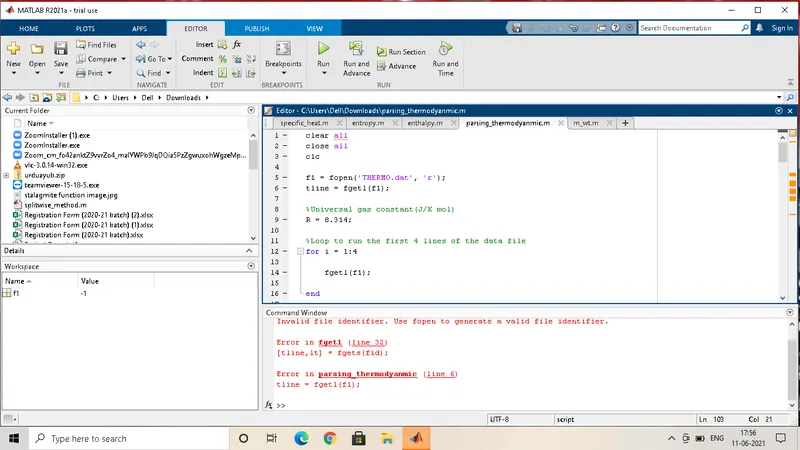
This error is due to i had save the file as a wrong name and when i read the file it shows this error