Week 9 - Senstivity Analysis Assignment
Sensitivity Analysis:
Aim:
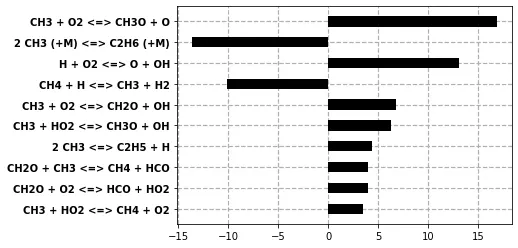
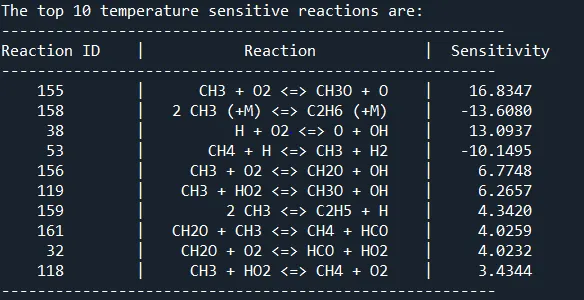
To write a code that takes all the reactions from the GRI-3.0 mechanism and calculates 10 most sensitive reactions with respect to the Temperature and show the reaction strings in the order of greatest sensitivity to the least sensitivity.
Theory:
Every reaction is represented by a global reaction. But in reality, every global reaction takes place through thousands of elementary reactions. Each reactions takes place at different rates at different operating conditions. All these equations together decide the rate of a global reaction. But among all the reactions, there will be some reactions which have a lot more influence on the reaction rate or rate of change of temperature etc. In order to control the reactions, we can change parameters like temperature, pressure, species, concentration etc that have a direct impact on the rate of a particular reaction.This influence of a particular input parameter on the particular ouput parameter is called sensitivity analysis. Higher the sensitivity, greater the impact of any change in the parameters on the output.
sensitivity is defined as
sensitivity = `(delx)/(dely)`
This implies variation of the output parameter 'x' on the input parameter 'y'.
Code:
The following code is used to obtained desired sensitivity analysis plot.
"""
This program is used to find out top 'N' most temperature sensitive reactions
"""
from numpy import *
from matplotlib.pyplot import *
import cantera as ct

# Initial conditions for the reaction mechanism
gas = ct.Solution('gri30.cti')
T0 = 1500
P0 = ct.one_atm
gas.TPX = T0,P0,{'CH4':1,'O2':2,'N2':7.52}

# initializing the reactor and the reactor network
r = ct.IdealGasConstPressureReactor(gas)
sim = ct.ReactorNet([r])
reactions = gas.reaction_equations()

# Extraction and adding reactions from the mechanism to sensitivity analysis
n = gas.n_reactions
rid = linspace(1,n,n).astype(int)
N = 10 #Number of sensitive reactions to be displayed
for i in range(n):
    r.add_sensitivity_reaction(i)

# setting the relative and absolute tolerances for the solver
sim.rtol = 1e-06
sim.atol = 1e-15
sim.rtol_sensitivity = 1e-06
sim.atol_sensitivity = 1e-06

#Initializing the maximum temperature sensitivities of each reaction
sT_max = [0]*n

# Initializing a solution array to store reaction properties at each time step
states = ct.SolutionArray(gas,extra = ['t_in_ms'])

# Creating a time domain for the reaction network
t = linspace(0,2e-3,401)

# Outer time loop
for i in range (len(t)):
    sim.advance(t[i])
    states.append(r.thermo.state,t_in_ms = t[i]*1e3)
    # storing the maximum sensitivities of each reaction
    for j in range (n):
        sT = sim.sensitivity('temperature',j)
        if abs(sT) >= abs(sT_max[j]):
            sT_max[j] = sT

# Sorting the reactions and reaction IDs based on absolute values of sensitivity
reactions = [r for s,r in sorted(zip(np.abs(sT_max),reactions),reverse = True)]
rid = [r for s, r in sorted(zip(np.abs(sT_max),rid),reverse=True)]
sT_max = [sT for abs_sT,sT in sorted(zip(np.abs(sT_max),sT_max),reverse = True)]

# Extracting the top 10 sensitive reactions
rplot = reactions[0:N]
rid_plot = rid[0:N]
splot = sT_max[0:N]

# rinting the results
print("The top %d temperature sensitive reactions are:"%(N))
print("--------------------------------------------------------")
print("%8s %4s %18s %12s %12s" %('Reaction ID','|','Reaction','|','Sensitivity'))
print("-------------------------------------------------------")
for i in range(N):
    print("%7d %8s %26s %4s %10.4f" %(rid_plot[i],'|',rplot[i],'|',splot[i]))
print("-------------------------------------------------------")

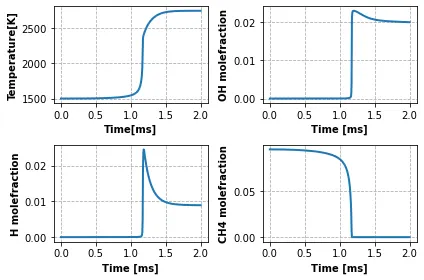
# Extracting mole fractions OH,H , CH4
OH = states.X[:,states.species_index('OH')]
H = states.X[:,states.species_index('H')]
CH4 = states.X[:,states.species_index('CH4')]

# plotting the results
fig1,ax1 = subplots()
y_pos = arange(len(rplot))
grid('both',linestyle='--',linewidth = 1.2)
ax1.set_axisbelow(True)
ax1.barh(y_pos,splot,0.5,align = 'center',color='black')
ax1.set_yticks(y_pos)
ax1.set_yticklabels(rplot,rotation=0,fontweight = 'bold')
ax1.invert_yaxis()
xticks = [-20, -15, -10, -5, 0, 5 , 10, 15, 20]
ax1.set_xticklabels(xticks,rotation=0,fontsize = 12)
ax1.set_xlabel('Temperature Sensitivity',fontsize = 18,fontweight = 'bold')
title('10 most temperature sensitive reactions fro GRI mechanism',fontsize = 20,fontweight = 'bold')
savefig('temperature_sensitivity_ranks.png')
show()

fig2,ax2 = subplots(2,2)
subplot(2,2,1)
plot(states.t_in_ms,states.T, linewidth = 2)
grid('both',linestyle = '--',linewidth = 0.8)
xlabel('Time[ms]', fontweight = 'bold')
ylabel('Temperature[K]', fontweight = 'bold')
subplot(2,2,2)
plot(states.t_in_ms,OH,linewidth = 2)
grid('both',linestyle = '--',linewidth = 0.8)
xlabel('Time [ms]', fontweight = 'bold')
ylabel('OH molefraction', fontweight = 'bold')
subplot(2,2,3)
plot(states.t_in_ms,H,linewidth = 2)
grid('both',linestyle = '--',linewidth = 0.8)
xlabel('Time [ms]', fontweight = 'bold')
ylabel('H molefraction', fontweight = 'bold')
subplot(2,2,4)
plot(states.t_in_ms,CH4,linewidth = 2)
grid('both',linestyle = '--',linewidth = 0.8)
xlabel('Time [ms]', fontweight = 'bold')
ylabel('CH4 molefraction', fontweight = 'bold')
tight_layout()
savefig('Sensitivities.png')
show()
Output and Results: