Week 9 - Senstivity Analysis Assignment
Objective :
1. To write a code that takes all the reactions from the GRI mechanism and calculates 10 most sensitive reactions .
- The sensitivity parameter should be with respect to the Temperature (It should find the sensitivity with respect to the temperature not 'OH' as shown in the video) .
- Your program should show the reaction strings in the order of greatest sensitivity to the least sensitivity .
2. Program should be parametric, It is should be intuitive and easy to obtain 'n' number of sensitive reactions with respect to the asked parameter, by simply changing a number .
3. Must plot additional points plot a graph of sensitivities vs the reactions .
Introduction :
Complex mathematical models have been used from the very beginnings of reaction kinetics for the description of dynamic phenomena. The greatest practical problem, the numerical solution of stiff differential equations, was solved in the early seventies, and then new questions were raised: What is the nature of the connections between solution and parameters and would it not be possible to describe the
phenomena by fewer parameters? These are the topics of sensitivity analysis.
Sensitivity :
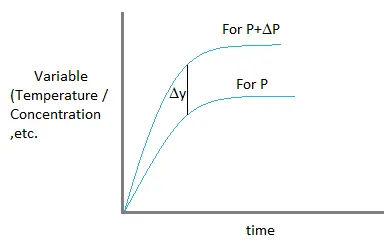
Here,
`P+DeltaP`= Small perturbations of the reaction rate constant .
`Deltay`= Change in the variable .
The graphs show the a parameter 'P' plotted against time .
By changing the lower curve `P` by a quantity of `Delta P` we obtain the upper curve `P+DeltaP`.
Now at any given location ,the parameter has changed by an amount of `Delta y`,this change variable has been caused by the change in parameter P to `P+Delta P`.
So here the ratio of change in variable over the change in parameter is ,
`(Deltay)/(DeltaP)`
This `(Deltay)/(DeltaP)` will give us the sensitivity of 'y' with respect to 'P'.
For the whole system we have a sensitivity matrix ie., we will be finding out the sensitivity of Temperature & each of the species concentration with respect to all the reaction rate parameters.
General form of sensitivity :
`(dZ)/dt=F(Z,t=a)`
`Z=(Temperature,Y_1,Y_2,............Y_n)^T`
`w_(j,i)=(delZ_j)/(dela_i)`
here ,
j is an independent variable .
i is the raection .
a is the net reaction rate multiplier (perturbation factor) .
Code :
import sys
import numpy as np
import cantera as ct
import matplotlib.pyplot as plt

gas = ct.Solution('gri30.xml')
temp=1500
pres=ct.one_atm

gas.TPX=temp,pres,'CH4:1,O2:2,N2:7.52'
r=ct.IdealGasConstPressureReactor(gas,name='R1')
sim=ct.ReactorNet([r])

#reaction equations
reaction=gas.reaction_equations()

"""R = ct.Reaction.listFromFile('gri30.cti')
print(R)"""

N=gas.n_reactions
n=10
S_max=[0]*N # prints zero
label=[]

for i in range(N):
	r.add_sensitivity_reaction(i)

# tolerances
sim.rtol=1e-6
sim.atol=1e-16
#
sim.rtol_sensitivity=1e-6
sim.atol_sensitivity=1e-6

states=ct.SolutionArray(gas,extra='t')
reac_num=np.arange(1,N+1)

for t in np.arange(0,2e-3,5e-6):
	sim.advance(t)
	states.append(r.thermo.state,t=t*1000)

	for j in range(N):
		#calculation of sensitivity with respect to temperaure
		s=sim.sensitivity('temperature',j)
		print('S values = '+str(s))


		# for storing maximum sensitivity value as the reactor network advances
		""" If s=0 & S_max=0 here the value won't be printed
		But is s=3.26e-16 & s=0 now this new value will be appended to the S_max arry of zeros
		S_max is found out for each of the 325 reactions
		"""
		if np.abs(s)>np.abs(S_max[j]):
			#print('values of s = ' + str(abs(s)))
			S_max[j]=s
		#print(S_max)

#print('values of s = ' + str(abs(s)))

#sorting
S_abs=np.abs(S_max)
reaction=[a for b, a in sorted(zip(S_abs,reaction),reverse=True)]
reac_num=[a for b, a in sorted(zip(S_abs,reac_num),reverse=True)]
S_max=[a for b, a in sorted(zip(S_abs,S_max),reverse=True)]

max_r=reaction[0:n]
print('max_r'+str(max_r))
max_n=reac_num[0:n]
print('max_n'+str(max_n))
max_s=S_max[0:n]
print('max_s'+str(max_s))

print("The top %d temperature sensitive reactions are :" %(N))
print("----------------------------------------------------------------")
print("%8s %4s %18s % 12s % 12s" % ('Reaction ID','|','Reaction','|','Sensitivity'))
print("----------------------------------------------------------------")

for i in range(len(max_n)):
	print("%7d %8s %26s %4s %10.4f" % (max_n[i],'|',max_r[i],'|',max_s[i]))

# mole fraction
H_conc=states('H').X
OH_conc=states('OH').X
CH4_conc=states('CH4').X

plt.figure(1)
plt.barh(max_r,max_s,0.3)
plt.xlabel('Temprature Sensitivity')
plt.grid(linestyle=':',color='black')
plt.title('Highest temperature sensitivity reaction in GRI30 for stoichiomteric combustion of methane')
plt.tight_layout()
plt.show()

plt.figure(2)
plt.subplot(2,2,2)
plt.plot(states.t,H_conc)
plt.xlabel('Time [ms]')
plt.ylabel('H Mole fraction')
plt.grid(True)
plt.subplot(2,2,1)
plt.plot(states.t,states.T)
plt.xlabel('Time [ms]')
plt.ylabel('Temperature [K]')
plt.grid(True)
plt.subplot(2,2,3)
plt.plot(states.t,OH_conc)
plt.xlabel('Time [ms]')
plt.ylabel('OH Mole fraction')
plt.grid(True)
plt.subplot(2,2,4)
plt.plot(states.t,CH4_conc)
plt.xlabel('Time [ms]')
plt.ylabel('CH4 Mole fraction')
plt.grid(True)
plt.tight_layout()
plt.show()
Code explaination :
- We first create a gas object in 'ct' module where 'Solution' is a class used to create an 'instance object' called gas .
- We also declare Temperature ,Mole fractions & Pressure values as attributes for gas object .
- We will next create a reactor object ,that takes temperature ,pressure and mole fraction as its input .
- Reactor 'r' object is created which takes this gas object as an input .
https://cantera.org/documentation/docs-2.4/sphinx/html/cython/zerodim.html#idealgasconstpressurereactor . - For this reactor object ,ReactorNet has been initialised where 'r' is an input .
- We call for all the reactions from the 'gri30' file by using "gas.reaction_equations()" .
https://cantera.org/documentation/docs-2.4/sphinx/html/cython/kinetics.html#cantera.Kinetics.reaction_equations . - n_reactions gives - Number of reactions in the reaction mechanism.
n=10 ,gives the number of sensitivity reactions we are supposed to record .
S_max=[0]*N ,gives an array of zeros . -
add_sensitivity_reaction(self, m)
Specifies that the sensitivity of the state variables with respect to reaction m should be computed. m is the 0-based reaction index. The reactor must be part of a network first. Specifying the same reaction more than one time raises an exception.
-
- 'rtol' & 'atol' values are specified .
'rtol_sensitivity' & 'atol_sensitivity' are specified .
https://cantera.org/documentation/docs-2.4/doxygen/html/d7/def/classCantera_1_1ReactorNet.html#a4d7bd81259e8942445eab714e947490b .
- 'rtol' & 'atol' values are specified .
-
- The 'SolutionArray' gives you an object which describes the states of your reactor object .
The reactor has different states ie., at each time the reactor states are different ,it has different Temperature ,Pressure & so on ... - https://cantera.org/documentation/docs-2.5/sphinx/html/cython/importing.html#representing-multiple-states .
- 12.The 'for' loop here is used to run a time advance method on the system .
- https://cantera.org/documentation/docs-2.1/doxygen/html/classCantera_1_1ReactorNet.html#a279deada6c346b722995ef0afcc736d2 .
- The 'SolutionArray' gives you an object which describes the states of your reactor object .
13.Now we are appending the state of the reactor at the end time 5e-6 at this particular value of 'n'.
State of the reactor contains all the data ,it contains Temperature ,Pressure ,Concentration etc .,
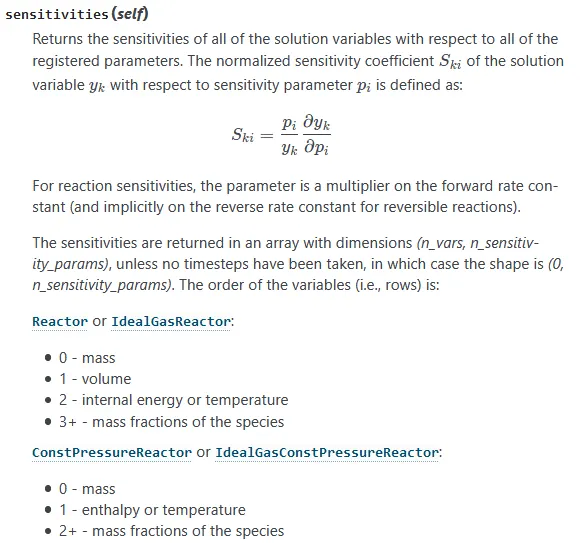
14.sensitivity(self, component, int p, int r=0)
-
Returns the sensitivity of the solution variable component in reactor r with respect to the parameter p. component can be a string or an integer. See
component_indexandsensitivitiesto determine the integer index for the variables and the definition of the resulting sensitivity coefficient. If it is not given, r defaults to the first reactor. Returns an empty array until the first time step is taken.
15. The 'if' loop is used to record all the values of sensitivities whose absolute values are greater than zero .
16. The sorting part of the program will deal with arranging data generated into an array of values .
17. The top 10 most sensitive reactions are chosen and their subsequent values are printed in form of a table as shown below .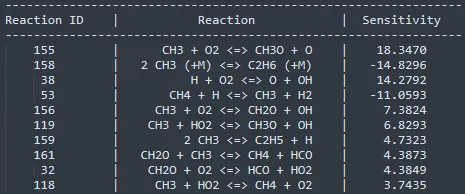
18. The mole fractions of H,OH & CH4 species values are initialised .
19. The values are plotted in form of a figure in the subsequent lines of code .
Plots :
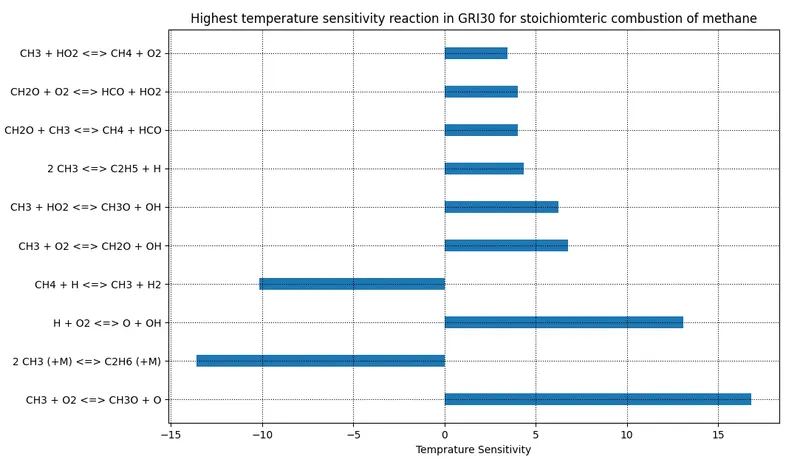
The tabular form of representing the top 10 sensitive reactions are given above ,these reactions are responsible for the effect of temperature .
The sensitivities whose values are positive promote the increase in temperature whereas the negative sensitivity values decrease the chances of temperature increase .
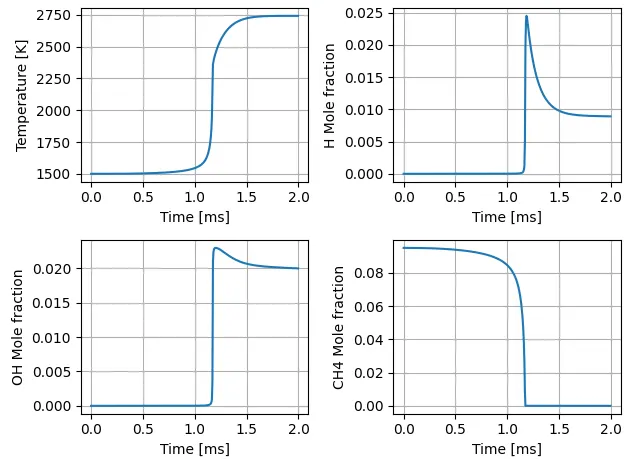
The above plots show us the values values of concentrations of species against time .
Realted links :
https://cantera.org/documentation/docs-2.4/doxygen/html/d7/def/classCantera_1_1ReactorNet.html