Week 9 - Parametric study on Gate valve.
AIM:
Parametric study on Gate valve
objectives:
For this challenge, you will have to perform a parametric study on the gate valve simulation by setting the opening from 10 % to 80%.
- Obtain the mass flow rates at the outlet for each design point.
- Calculate the flow coefficient and flow factor for each opening and plot the graph.
- Discuss the results of the mass flow rate and flow coefficient.
theory:
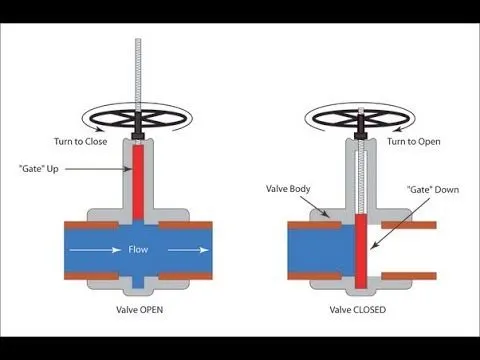
A gate valve, also known as a sluice valve, is a valve that opens by lifting a barrier out of the path of the fluid. Gate valves are used to shut off the flow of liquids rather than for flow regulation. When fully open, the typical gate valve has no obstruction in the flow path, resulting in very low flow resistance.
parametric study:
parametric study is the one by which we can chnage the dimensions for a selected part to visulaize how the output getting changes with change in geometry of the selected part. here i am performing parametric study on gate valve by setting the opening of the gate valve from 10 % to 80 % to visualize how the mass flow rate getting changes.
geometry:
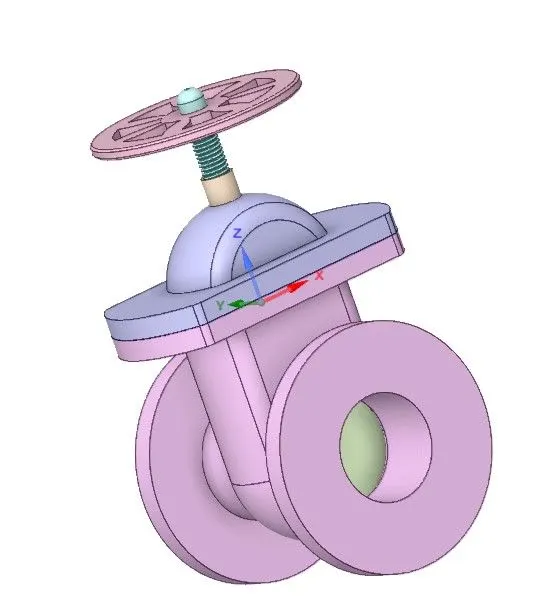
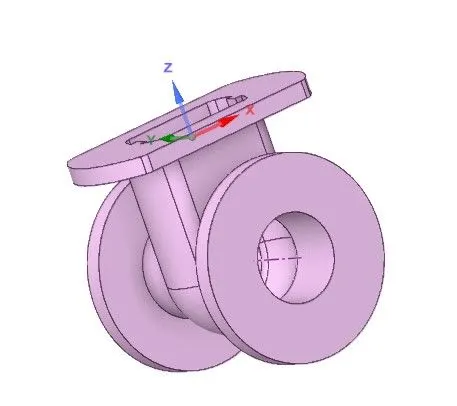
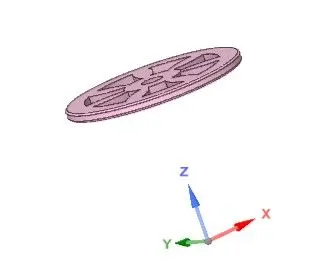
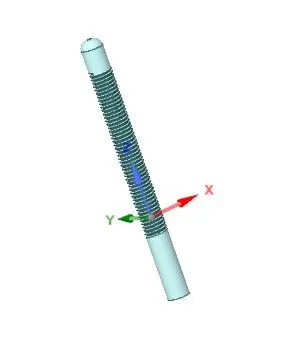
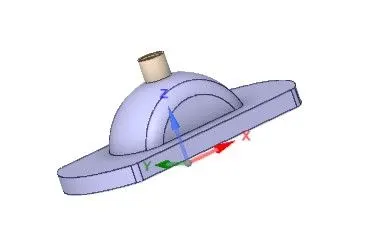
parts of gate valve:
bottem- gate disc-
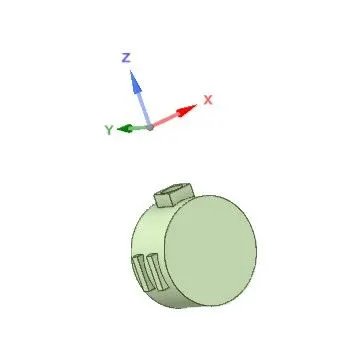
hand wheel- spindle- bannot-
for 10% opening (12 mm)-
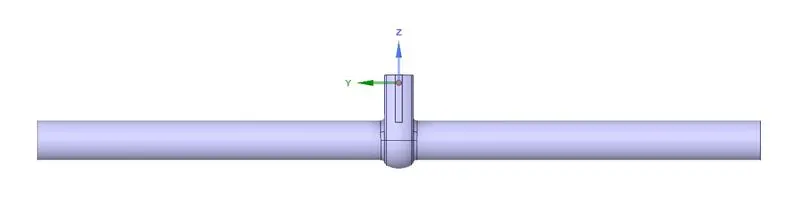
now create the fluid volume by using prepare tool in space claim. also extend the length of inlet and outlet of the gate valve by using pull tool so that we can visualize how the fluid travels along the pipe and along the gate valve. the length of inlent and outlet is taken as 800 mm. the diameter of gate disc is 120mm. now we have to lift the gate disc by 12 mm (that is 10 % opening) upwards by using move tool in the space claim. then create the group for 12mm for parametric study, so that we can change the the value for different openings of the gate disc. now update the volume of fluid by clicking update the context. then finally supress the parts of the gate valve.
sectional view of 10% opening-
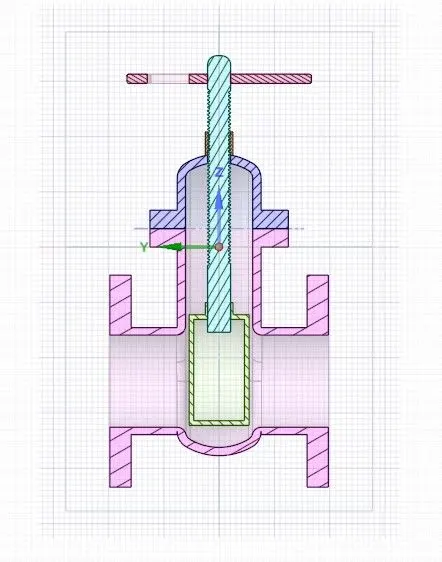
fluid volume-
mesh:
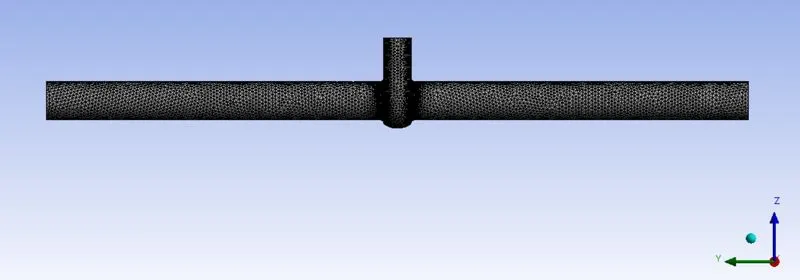
here i have taken element size is 10mm with default mesh methods. i have named the left and righ side faces as outlet and inlet. there are total 192824 tetrahedral cells are generated.
setup:
solver type - pressure based
time- steady
gravity- -9.81 m/s^2 in z direction
viscuous model- k epsilon realization model
fluid- water
initialization - standard
boubdary conditions:
inlet - pressure inlet type with 10 pascals gauge pressure
outlet- pressure outlet type with 0 pascals gauge pressure
now create mass flow rate plot and pressure plot at outlet. while creating the plots, create report plot, report file, output parameter.
solution:
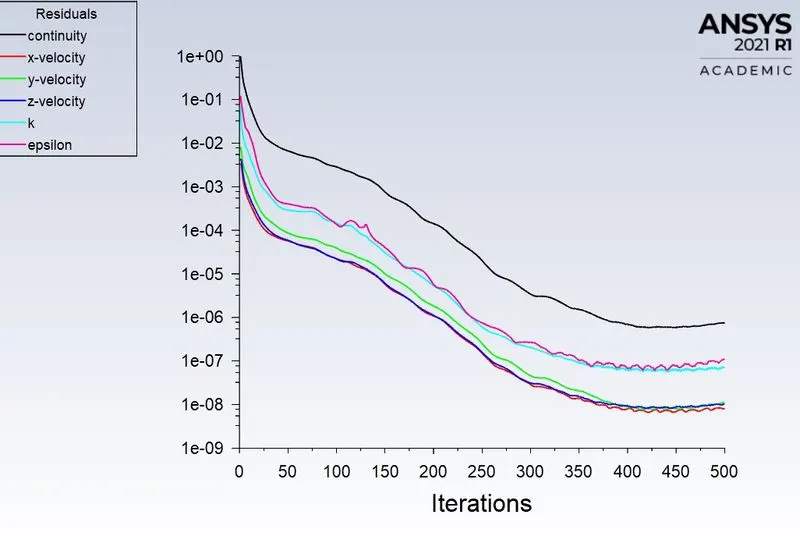
residuals plot-
mass flow rate plot at outlet plot-
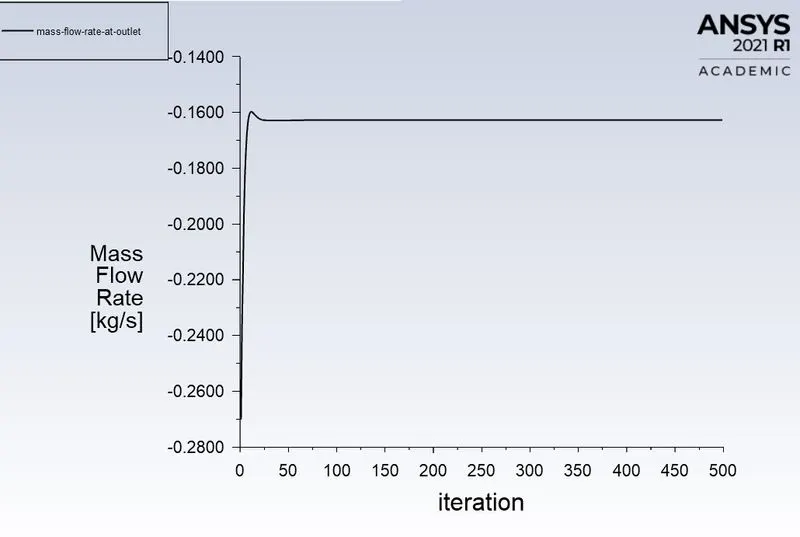
the mass flow rate at outlet is -0.16724 kg/s. here negative sign is obtained because the mass flow rate is at outlet, that is the fluid is out of the fluid volume.
velocity contour plot-
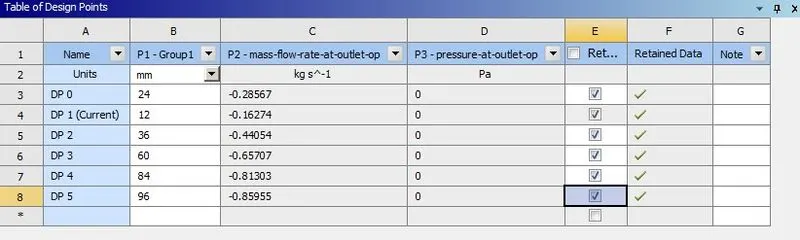
for other openings calculation, we can directly find the solutions by opeing the parameters in work bench. after opening we can see the table of design points. there we can give the different opening positions by clicking update projects.
for 20% opening (24 mm)-
residuals plot-
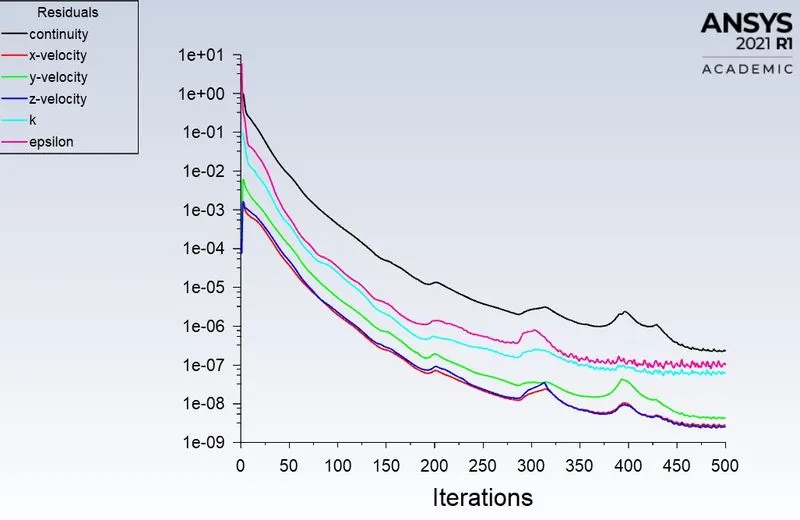
mass flow rate at outlet plot-
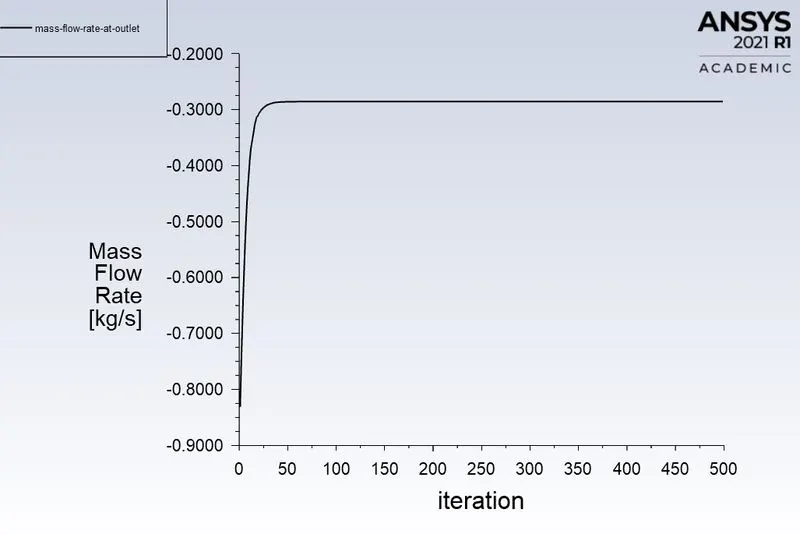
the mass flow rate at outlet is -0.28567 kg/s.
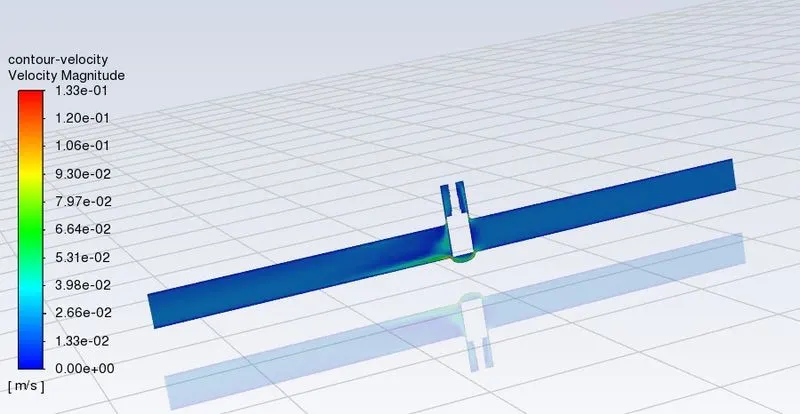
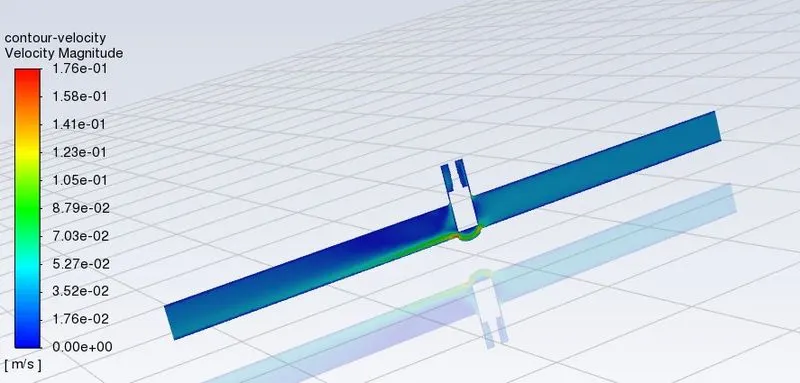
velocity contour plot-
for 30 % opening (36 mm)-
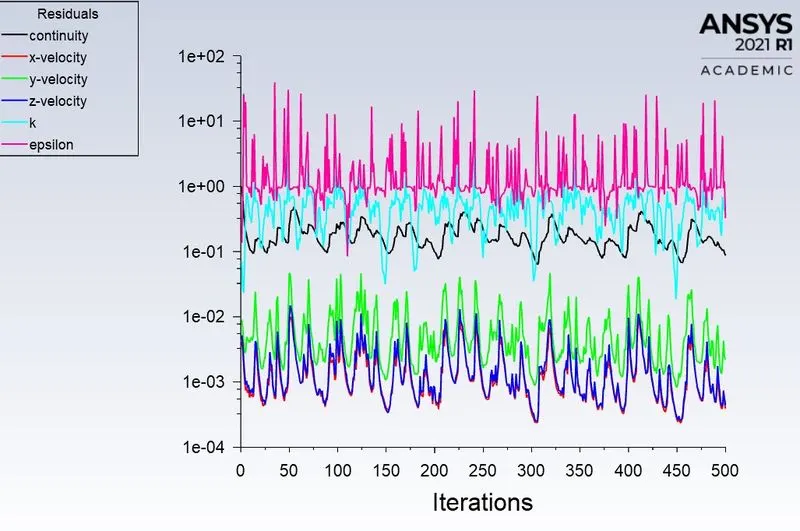
residuals plot-
mass flow rate at outlet plot-
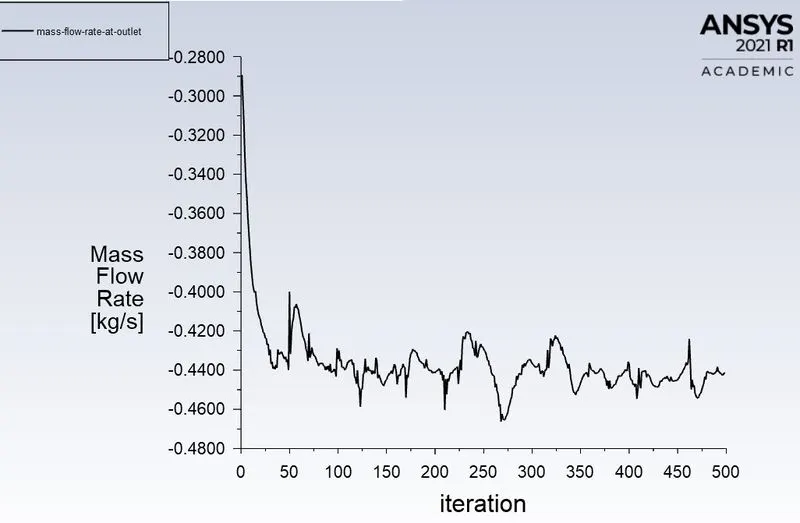
the mass flow rate at outlet is -0.44054 kg/s.
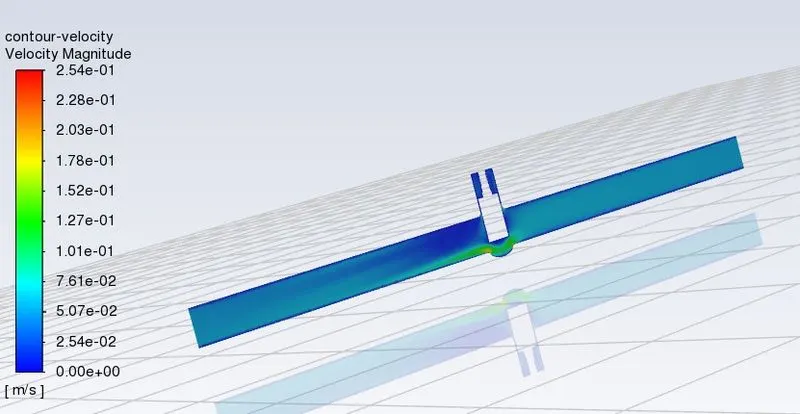
velocity contour plot-
for 50 % opening (60 mm)-
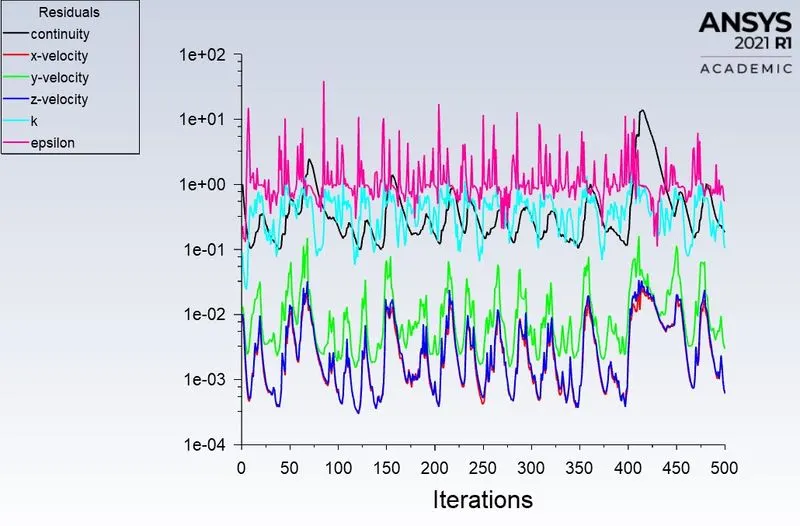
residuals plot-
mass flow rate at outlet plot-
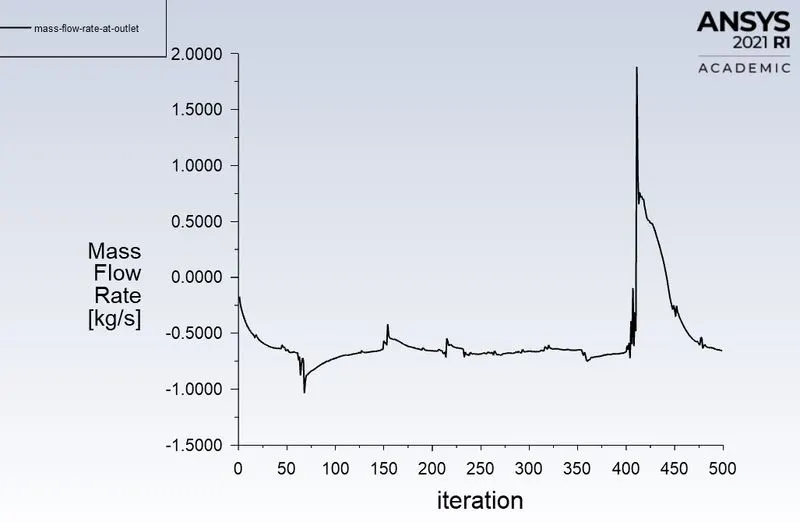
the mass flow rate at outlet is -0.65707 kg/s.
velocity contour plot-
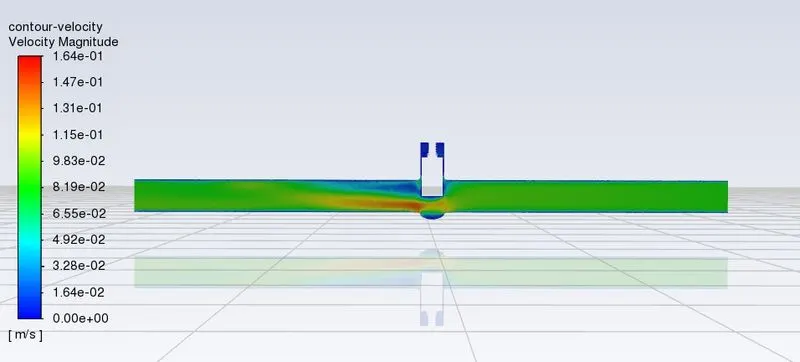
for 70 % opening ( 84 mm )-
residulas plot-
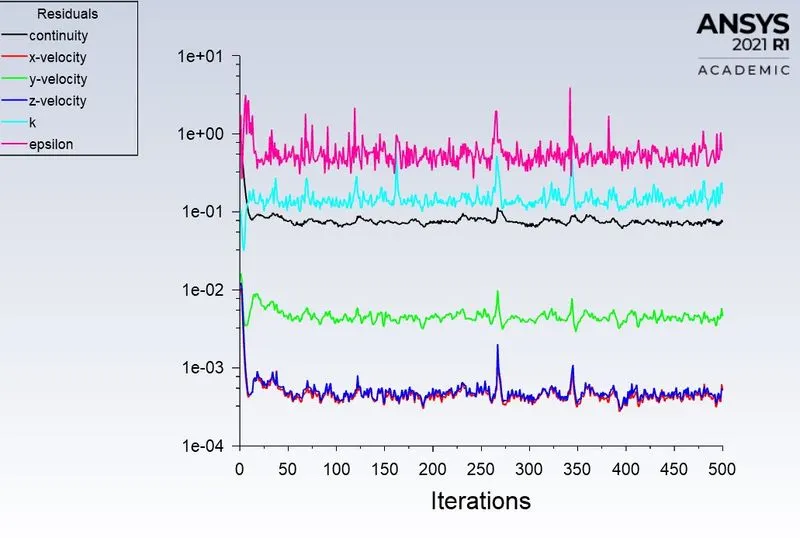
mass flow rate at outlet plot-
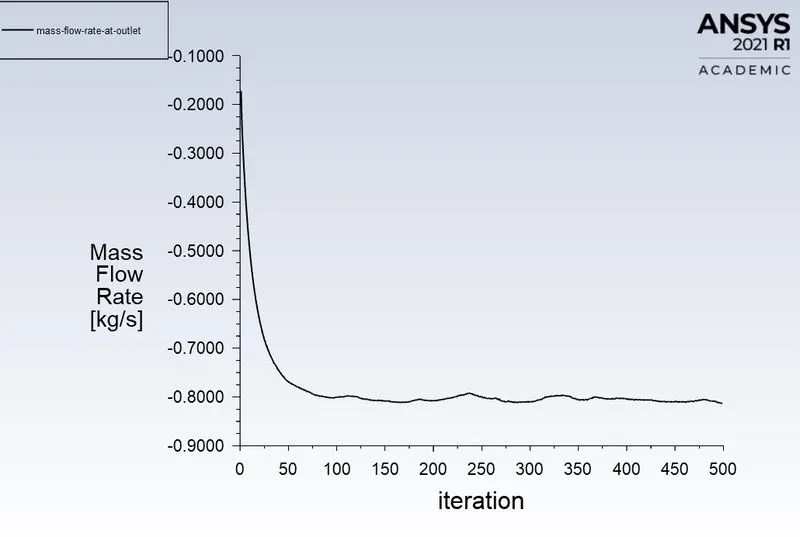
the mass flow rate at outlet is -0.81303 kg/s.
velocity contour-
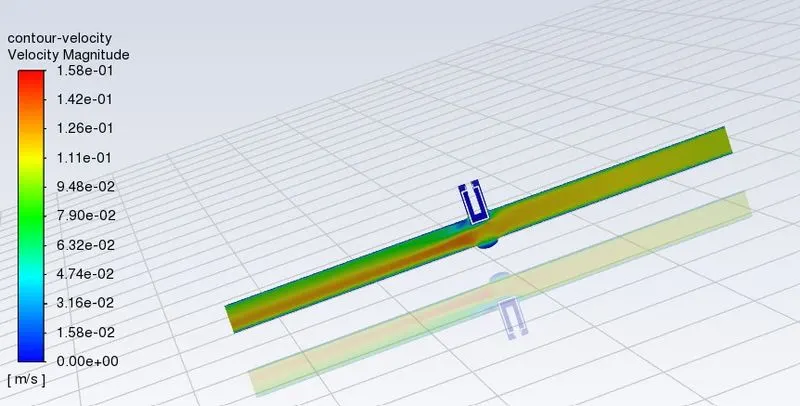
for 80 % opening ( 96 mm )-
residuals plot-
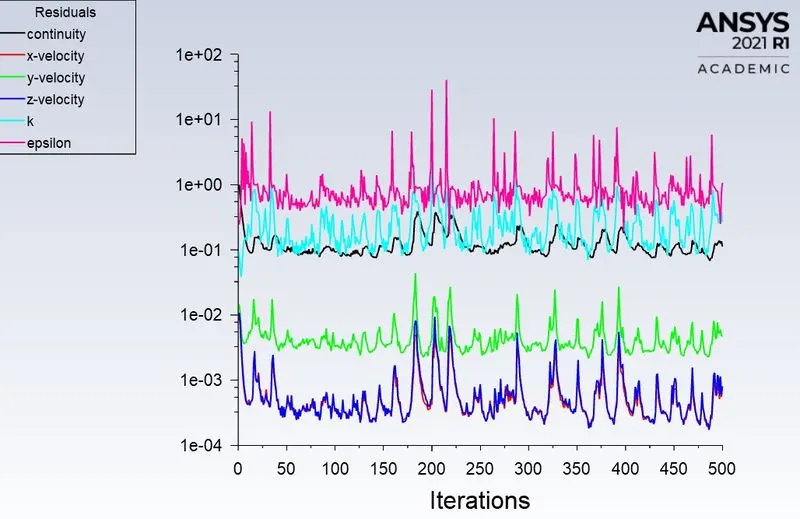
mass flow rate at outlet plot-
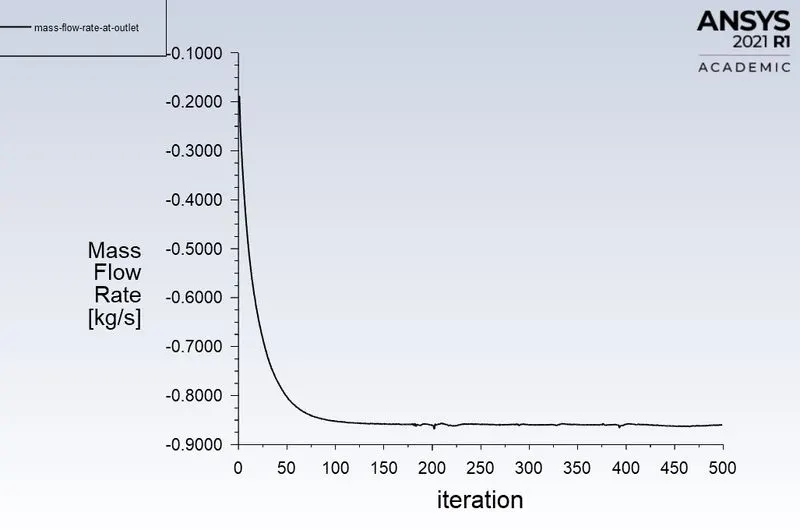
the mass flow rate at outlet is -0.85955 kg/s.
velocity contour-
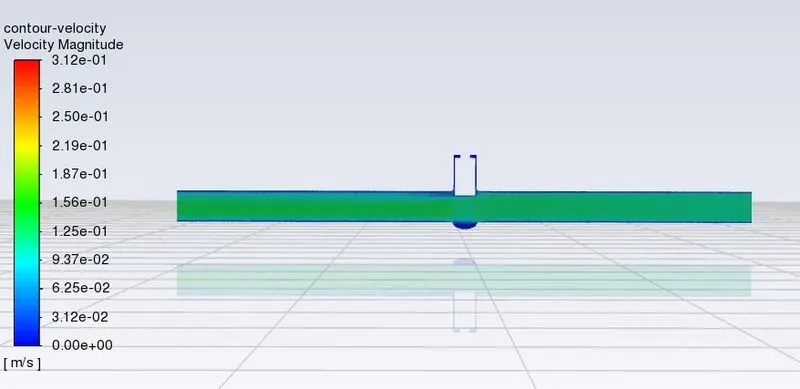
final table of design points-
flow coefficent:
Flow Coefficient (Cv) is a valve’s capacity for a liquid or gas to flow through it. Flow coefficient also represents the ease for a fluid flow to pass through the device. Similarly low coefficient indicates higher resistance to the passage of flow and high coefficient indicates lower resistance to the passage of flow. It is defined as the flow rate in US Gallons per minute [gpm] of water at a temperature of 60 degree fahrenheit with a pressure drop across the valve of 1 psi ( 1 psi = 6894.76 pascals ).
formula for flow coefficent (Cv)-
`C_v = Q√(SG)/(∆P)`
where
Q = water flow (US gallons per minute)
SG = specific gravity (1 for water)
∆P = pressure drop, psi ( pressure at inlet - pressure at outlet )
flow factor:
flow factor (Kv) is the flow coefficient in metric units. It is defined as the flow rate in cubic meters per hour [m3/h] of water at a temperature of 16 degrees celsius with a pressure drop across the valve of 1 bar. Cv is the flow coefficient in imperial units ( british imperial units). To calculate the Kv factor for liquids, the flow rate in l/min or m3/h, the density of the medium upstream of the valve and the pressure drop across the valve must be known, i.e. the difference between input pressure and back pressure. flow factor term is used in europe and asia.
formula for flow factor (Kv)-
Kv = 0.865 * Cv
calculations of flow coefficent and flow factor for each opening-
here we are going to convert the mass flow rate units kg/s into gallons per minute, 1 kg/s = 21.44 gallons per minute
the pressure at inlet = 10pascal
pressure at outlet = 0 pascals
pressure drop = 10 - 0 = 10 pascals.
by converting pascals into pounds per square inch (psi), 10 pascals = 0.00145038 psi
| percentage of opening | Q (gallons per minute) | pressure drop (psi) | flow coefficent (Cv) | flow factor (Kv) |
| 10% | 3.49 | 0.00145038 | 91.6 | 79.234 |
| 20% | 6.12 | 0.00145038 | 161 | 139.26 |
| 30% | 9.44 | 0.00145038 | 248 | 214.52 |
| 50% | 14.09 | 0.00145038 | 370 | 320.05 |
| 70% | 17.43 | 0.00145038 | 458 | 396.17 |
| 80% | 18.43 | 0.00145038 | 484 | 418.66 |
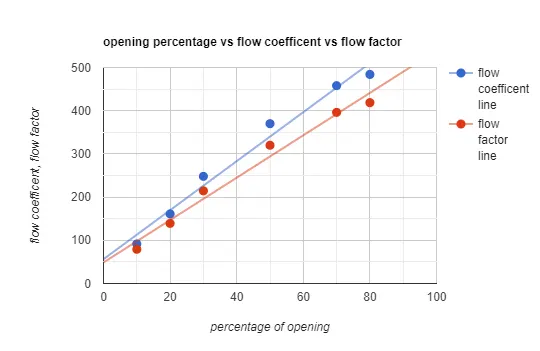
percentage of gate opening vs flow coefficent vs flow factor plot-
conclusion:
- by increasing the percentage of opening of gate disc, the velocity of getting increases at outlet because the flow restricted by gate disc is reduced.
- also the velocity at the area of gate opening is higher at 30 % opening compared to other openings because at that place, the area is minimum for the fluid to flow, which increases the velocity of the fluid.
- by increasing the percentage of opening of gate disc, the mass flow rate getting increases because the velocity is increasing during the flow.
- by increasing the percentage of opening of gate disc, the both flow coefficent and flow factor getting increases.
- parametric study helped in reducing the time while calculationg solutions for each opening.