Week 9 - Parametric study on Gate valve.
AIM:
- Perform a parametric study on the gate valve simulation by setting the opening from 10 % to 80%.
- Obtain the mass flow rates at the outlet for each design point.
- Calculate the flow coefficient and flow factor for each opening and plot the graph.
- Discuss the results of the mass flow rate and flow coefficient.
INTRODUCTION:
A gate valve is a type of valve used to control the flow of fluid in a pipeline. It is named after the gate-like mechanism inside the valve that controls the opening and closing of the flow passage. Gate valves are mainly used in industries to shut the flow of a fluid rather than flow regulation. They can be found in petrochemical industries, power plants and widely in the pipeline industries.
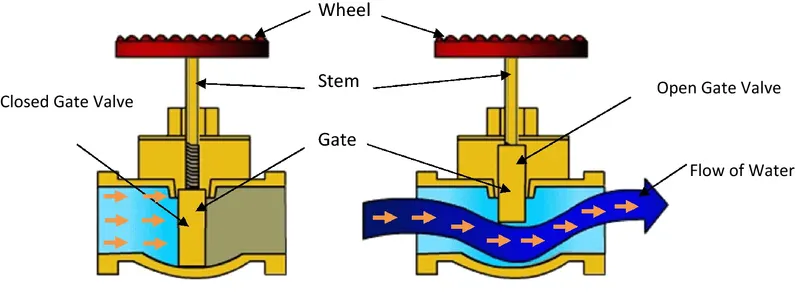
Figure of Gate Valve
THEORY:
Mass Flow Rate:
The mass flow rate is a fundamental concept in fluid dynamics that refers to the amount of mass that passes through a given cross-sectional area per unit of time. It represents the rate at which mass is transported by a fluid flowing in a system or a conduit.
Mathematically, the mass flow rate (ṁ) is calculated as:
ṁ = ρ * A * V
where,
ṁ is the mass flow rate (in kg/s or any mass unit per unit of time),
ρ is the density of the fluid (in kg/m³), A is the cross-sectional area through which the fluid is flowing (in m²),
V is the velocity of the fluid perpendicular to the cross-sectional area (in m/s).
The formula states that the mass flow rate is equal to the product of the density of the fluid, the cross-sectional area, and the velocity of the fluid.
Flow Coefficient (Cv):
The flow coefficient, often denoted as Cv, is a dimensionless parameter that represents the flow capacity of a valve or a similar fluid control device. It is used to quantify the relationship between the pressure drop across the device and the resulting flow rate of the fluid.
The flow coefficient is defined as the flow rate of water (in gallons per minute, GPM) that will pass through the device under a specific pressure drop of 1 pound per square inch (psi). Mathematically, it can be expressed as:
Cv = Q / √(ΔP)
where,
Cv is the flow coefficient,
Q is the flow rate of water in GPM,
ΔP is the pressure drop across the device in psi.
Flow Factor (Kv):
The flow factor Kv, also known as the valve flow coefficient, is a parameter used to characterize the flow capacity of a valve or a similar flow control device. It is commonly used in the field of fluid dynamics and is particularly relevant for valves used in the control of liquids or gases.
The flow factor Kv represents the flow rate of water (in cubic meters per hour, m³/h) that will pass through the valve under a specific pressure drop of 1 bar. Mathematically, it can be expressed as:
Kv = Q / √(ΔP)
where,
Kv is the flow factor in cubic meters per hour (m³/h),
Q is the flow rate of water in cubic meters per hour (m³/h),
ΔP is the pressure drop across the valve in bar.
SOLVING & MODELING APPROACH:
In this simulation, fluid i.e.,water is allowed to flow through the gate of the gate valve, which is lifted from 10 mm to 80 mm to obtain the mass flow rates as well as Flow coefficient(Cv) and Flow factor(Kv) respectively. Realizable K-epsilion model will be used for this simulation as it gives better results in free flow of the fluid.
PRE-PROCESSING AND SOLVER SETTING:
Geometry:
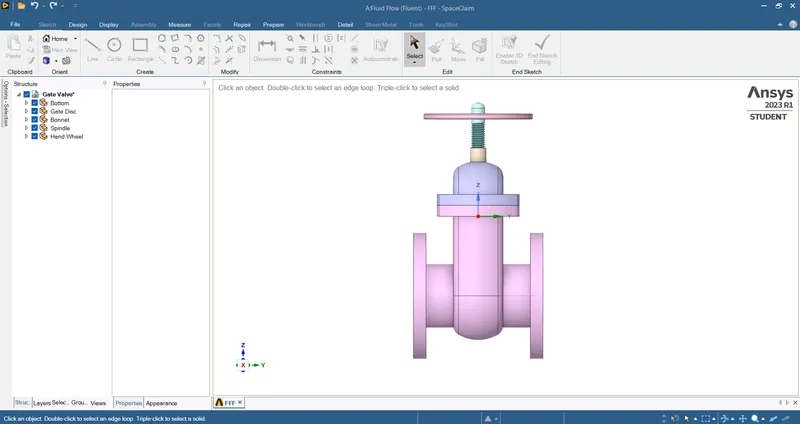
- Run ANSYS 2023 R1 student version and drag Fluid Flow (Fluent) in the project Schematic and then run ANSYS Space Claim by selecting it from Geometry. Import the Gate Valve CAD model by using the option File>Open>Gate Valve.STEP
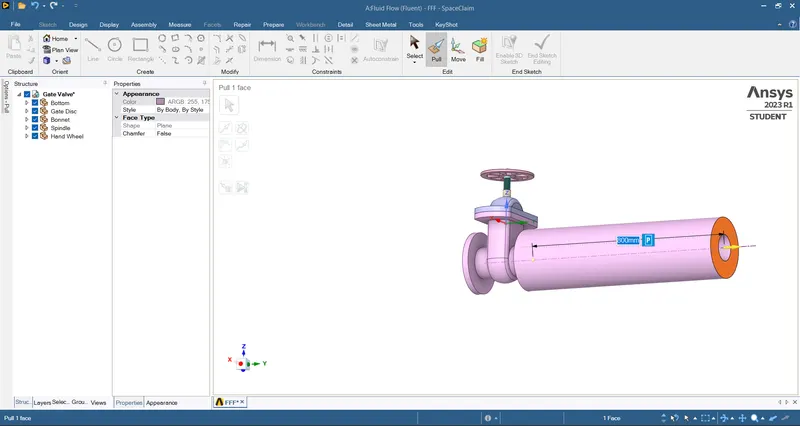
- Select Pull tool under sketch menu bar and then select the external faces of the gate valve and pull it through the axis with an appropriate length.
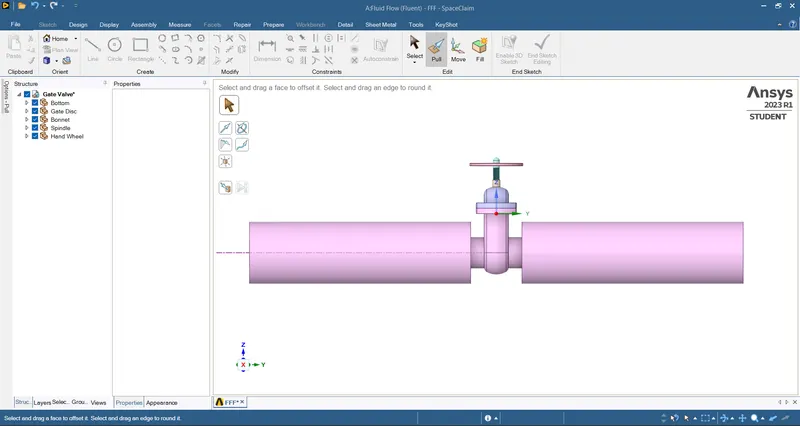
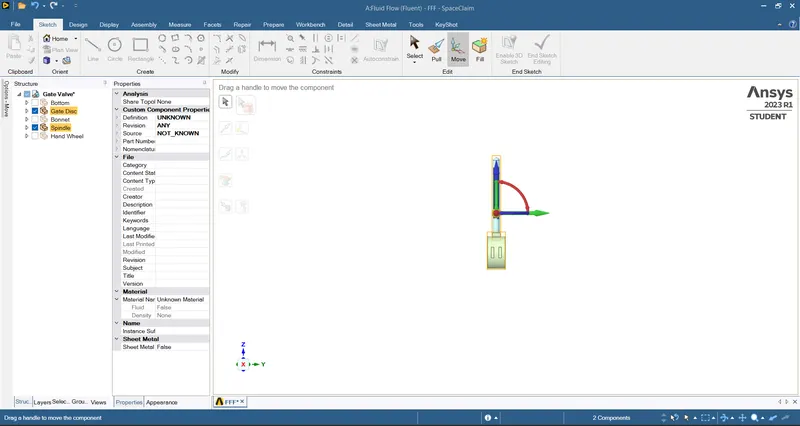
- Select Move tool under sketch menu bar and select the Gate Disc and spindle by making a box selection and then pull the spindle avobe to lift the gate disc by an appropriate length such as 10 mm, 20 mm etc.
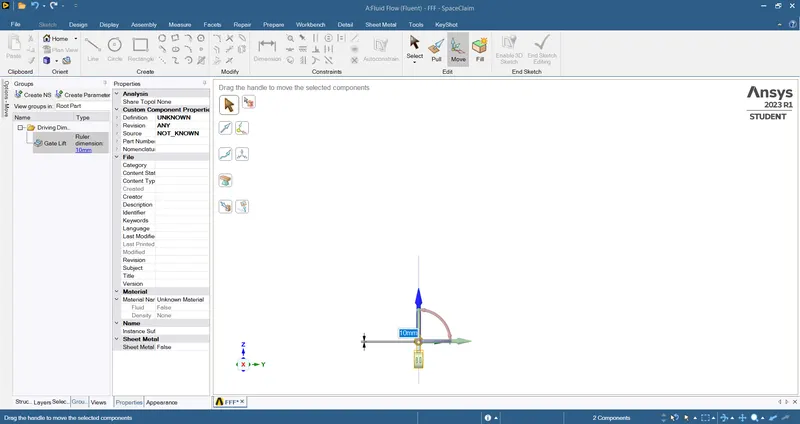
- Select groups from the bottom menu and create group parameter and name it as suitable, so that the ruler dimension can be changed as necessary.
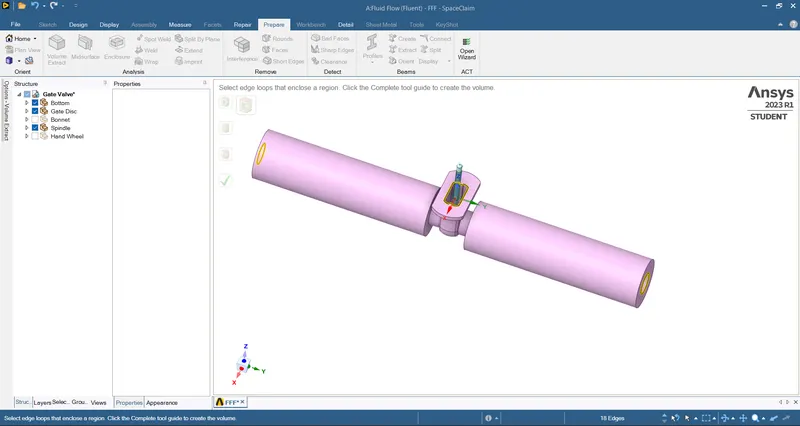
- Extract the fluid volume by using volume extract tool under Prepare menu and then select the appropriate edges and then extract it.
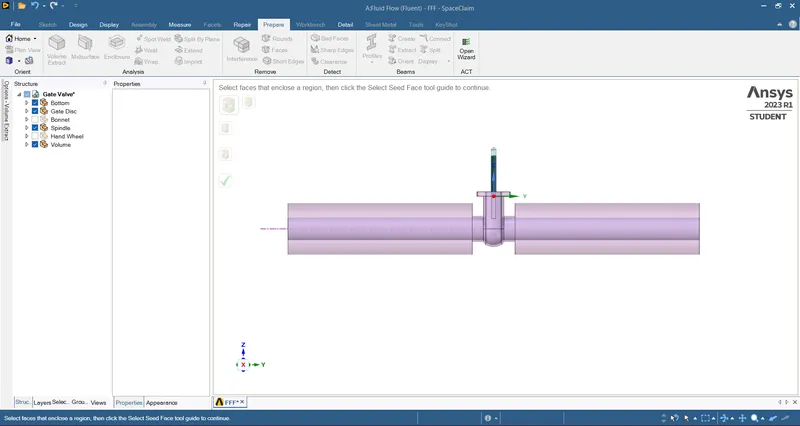
- Check the sectional view to ensure that the volume is extracted properly by using the section tool under Design menu.
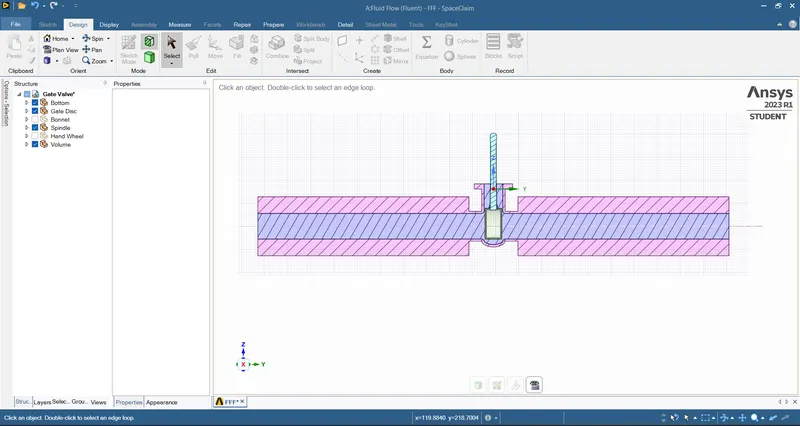
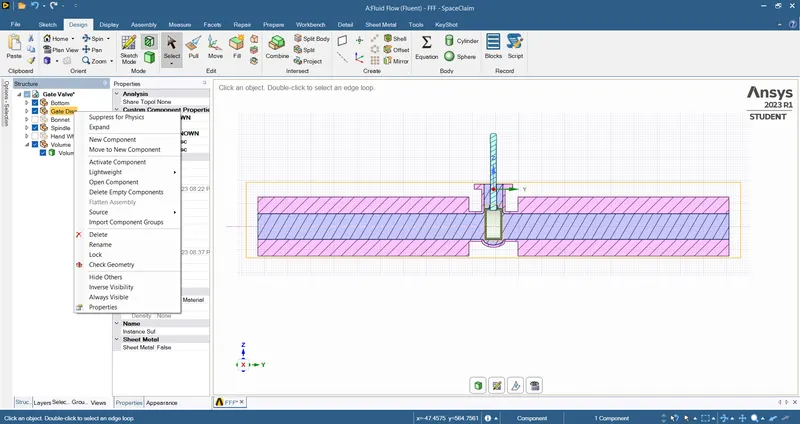
- Except fluid volume suppress all the other parts by selecting the parts and then suppress for physics as it is not necessary for simulation.
Mesh:
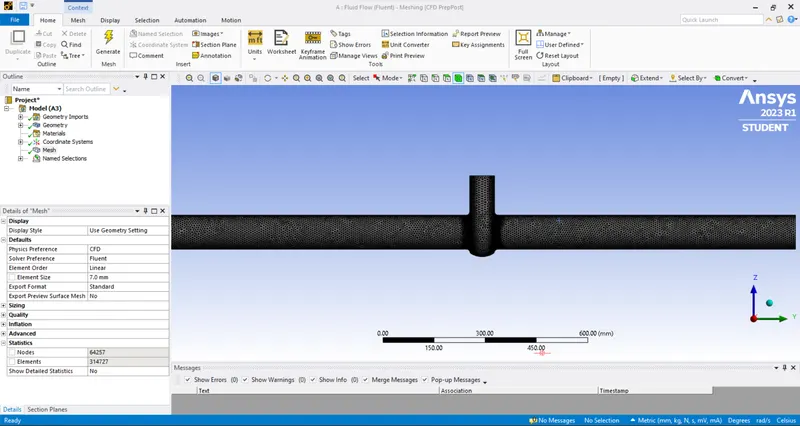
- Assign mesh element size as 7 mm for the body and then Generate mesh.
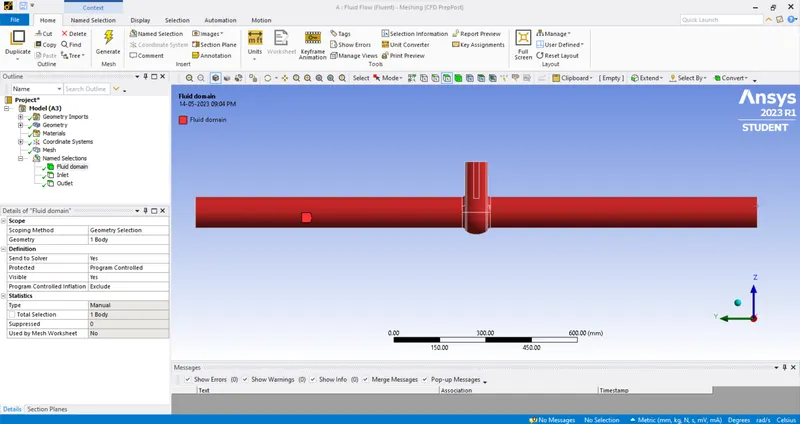
- Create named selections by using the 'N" button and naming the parts appropriately.
Setup:
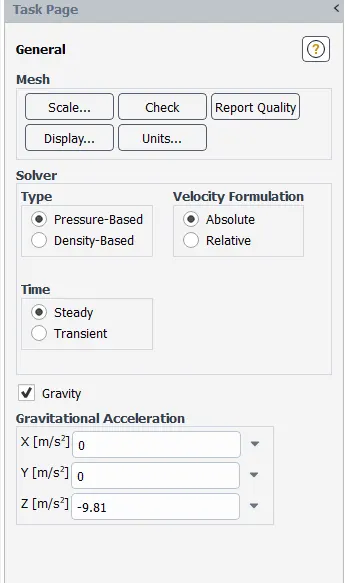
- Under general settings, select pressure-Based type solver, Steady time, Gravity and assign Gravitational acceleration as -9.81 m/s² in the Z-axis.
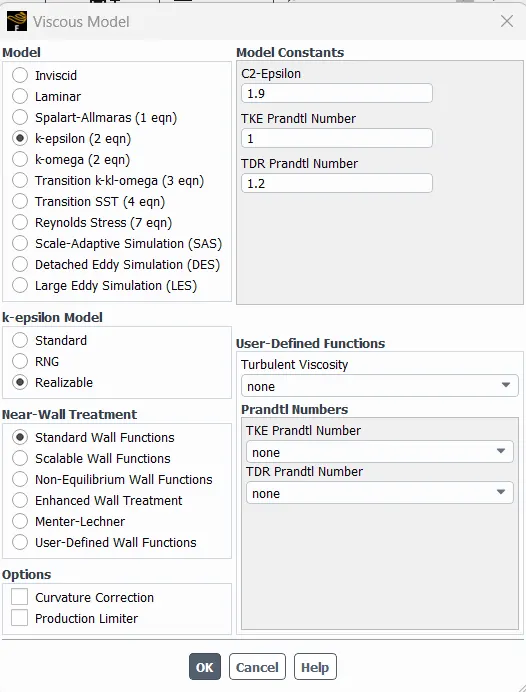
- Under Viscous Model select Realizable K-Epsilon model.
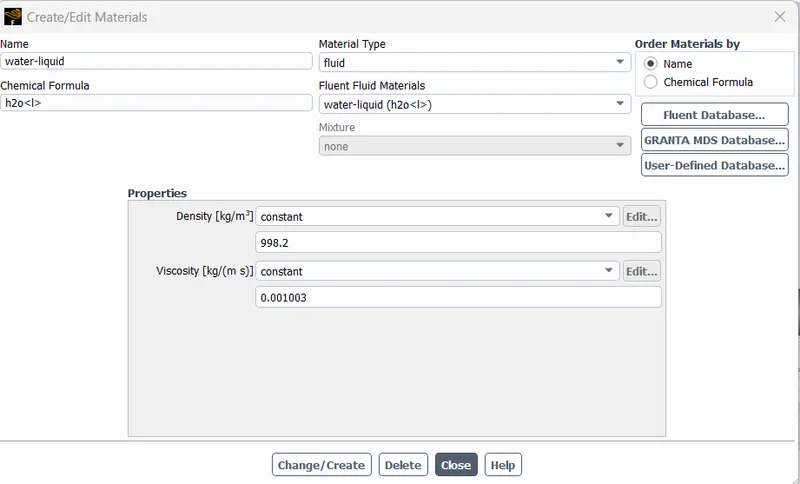
- Under Create/Edit Materials select fluid as water for simulation.
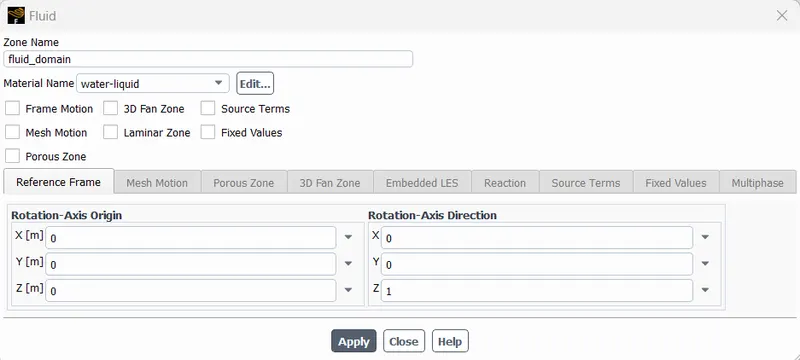
- Assign cell zone for fluid domain as water-liquid.
- Select pressure inlet for Boundary Condition for inlet.
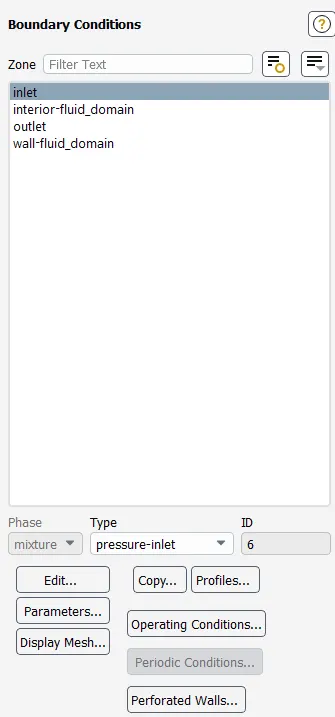
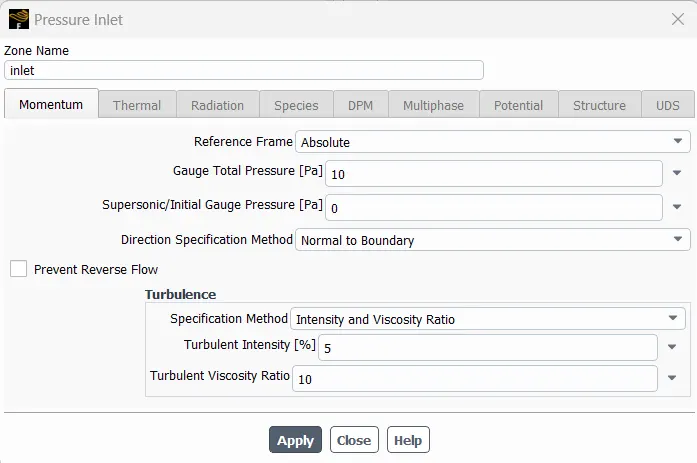
- Assign Total Gauge Pressure under Inlet Boundary Conditions.
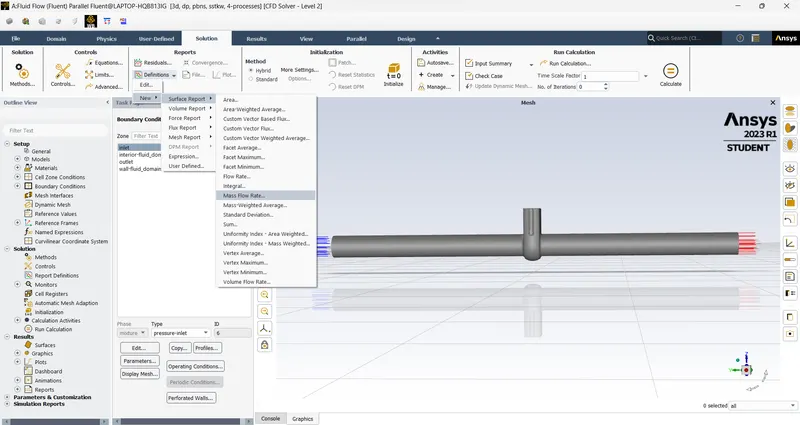
- Create mass flow rate plot report by selecting Definitions>New>Surface Report>Mass flow rate.
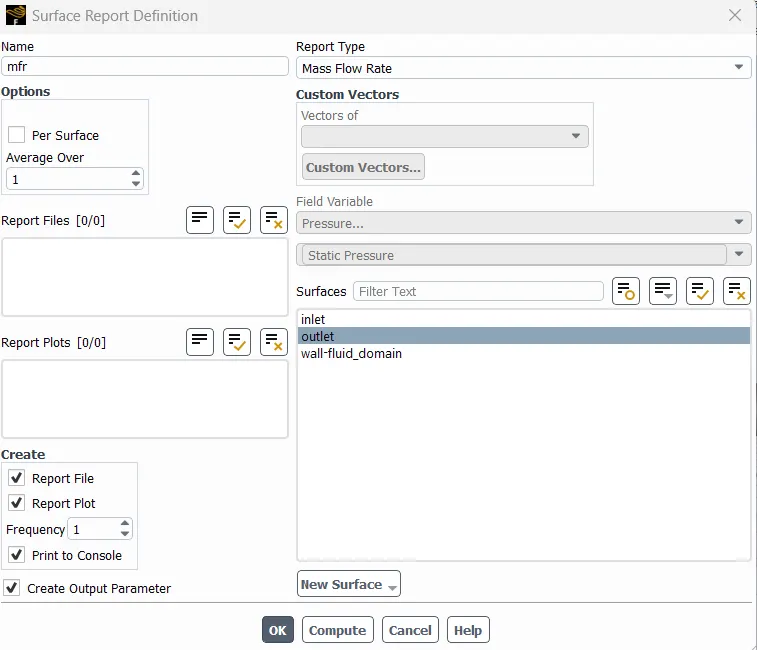
- For mass flow rate report select outlet as surface and also create output parameter.
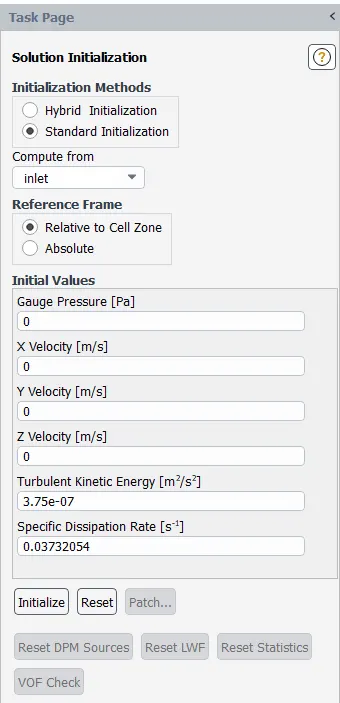
- Under Solution Initialization, select Standard Initialization computing from inlet and click Initialize.
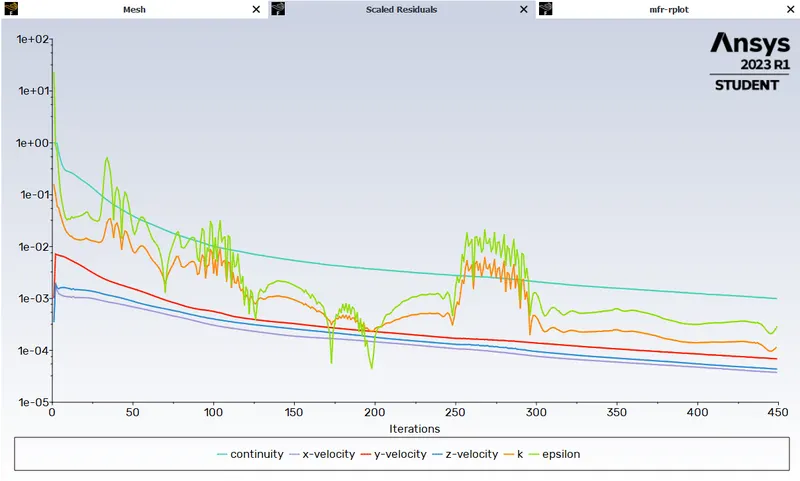
- Run calculation using appropriate number of iterations until the solution is converged.
RESULTS:
Results for some of the simulations is shown below:
1) Setting the opening of the gate valve disc as 10 mm.
Scaled Residuals:
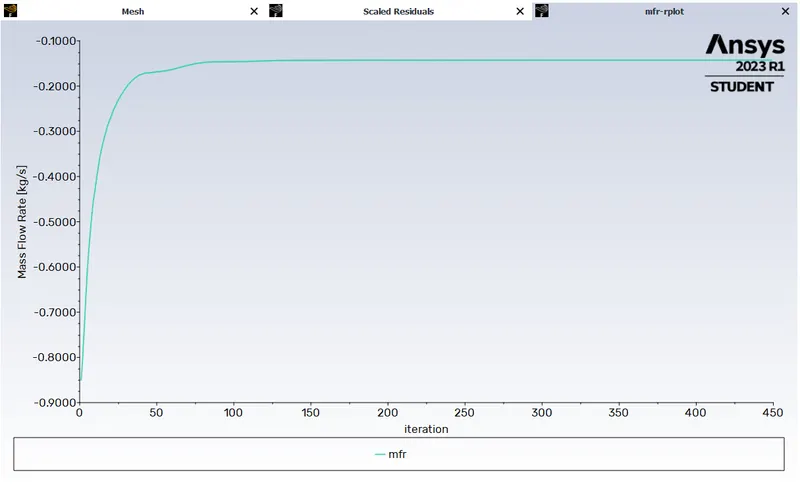
Mass Flow Rate plot:
Solution converged:

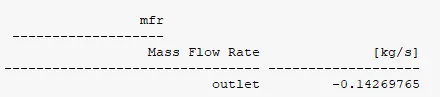
Mass flow rate:
Pressure Contour:
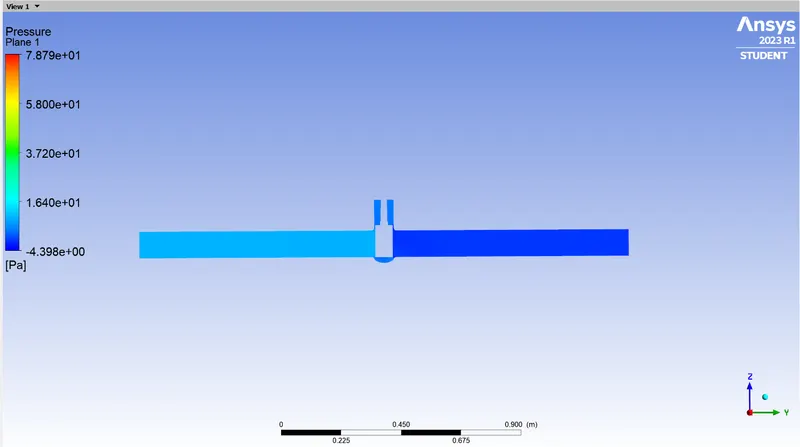
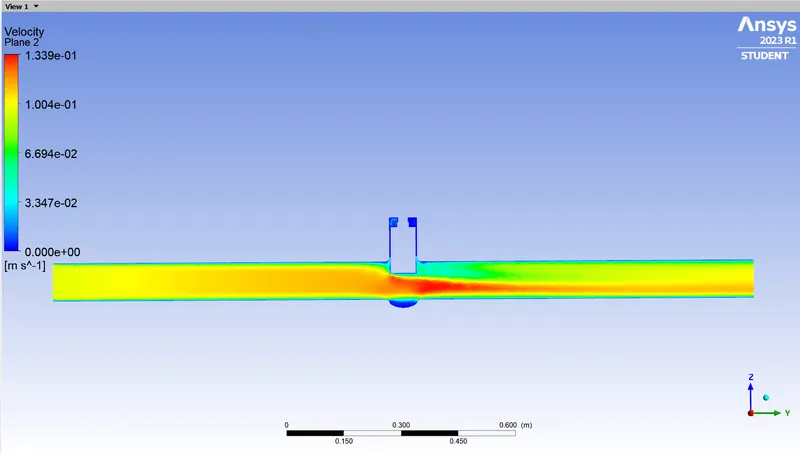
Velocity Contour:
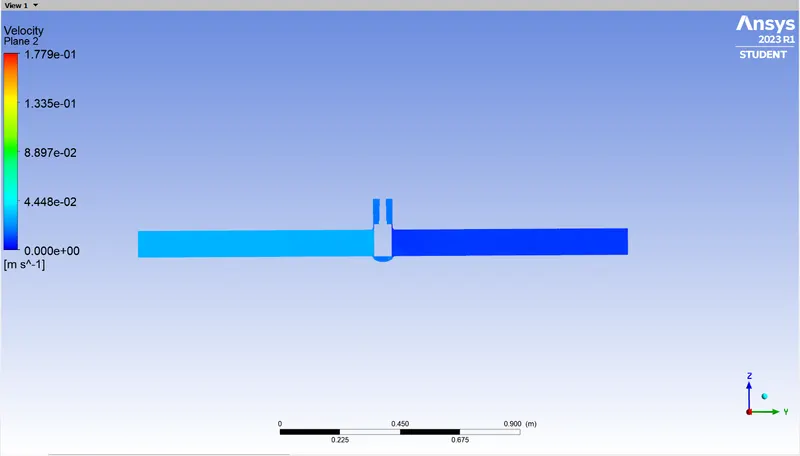
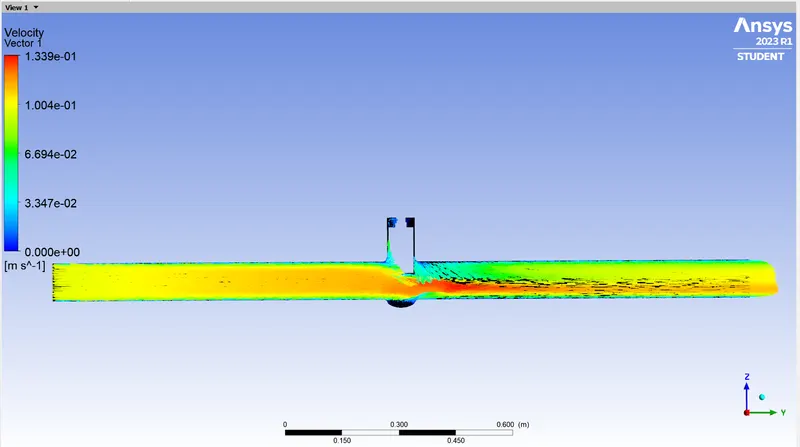
Velocity Vector:
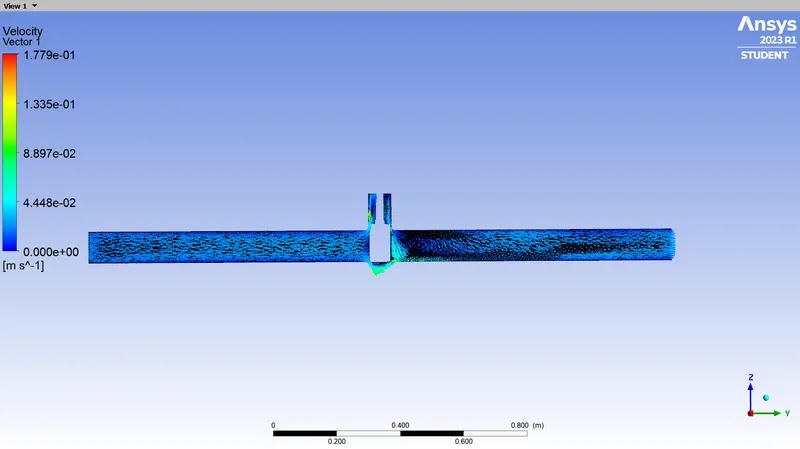
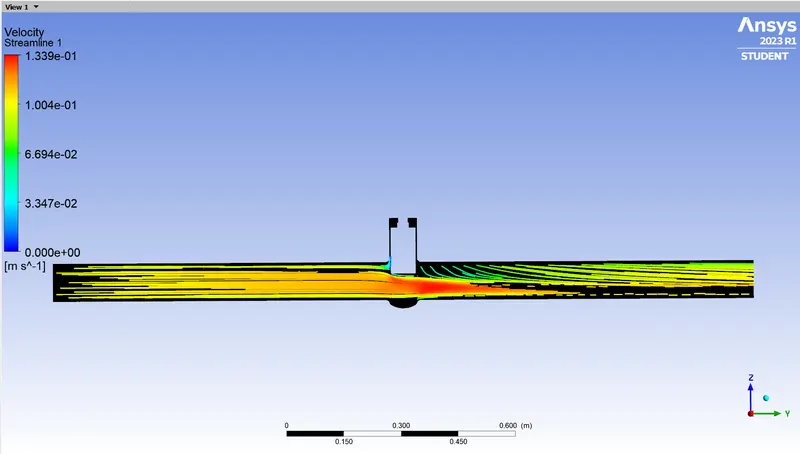
Velocity Streamline:
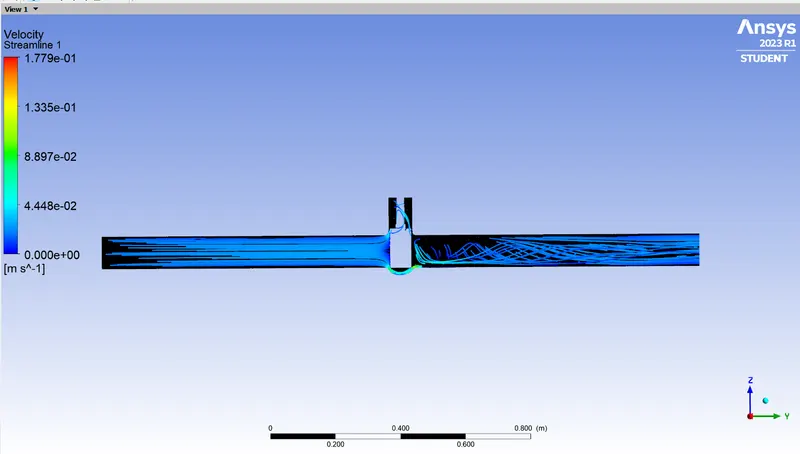
2) Setting the opening of the gate valve disc as 20 mm.
Scaled Residuals:
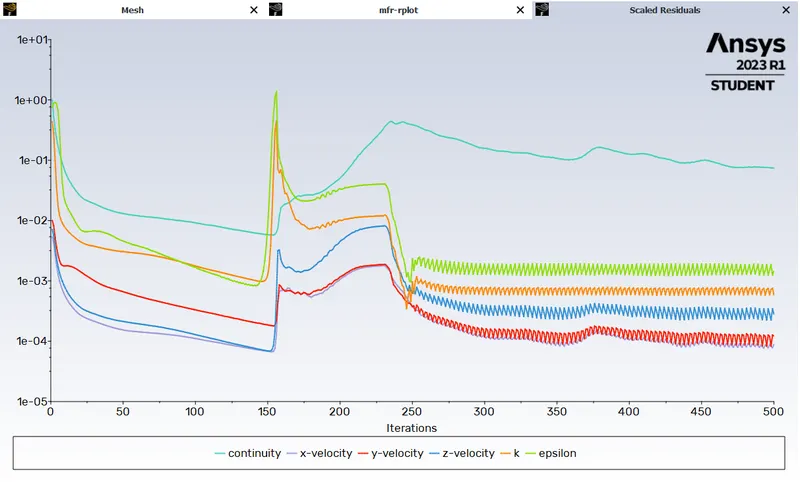
Mass Flow Rate plot:
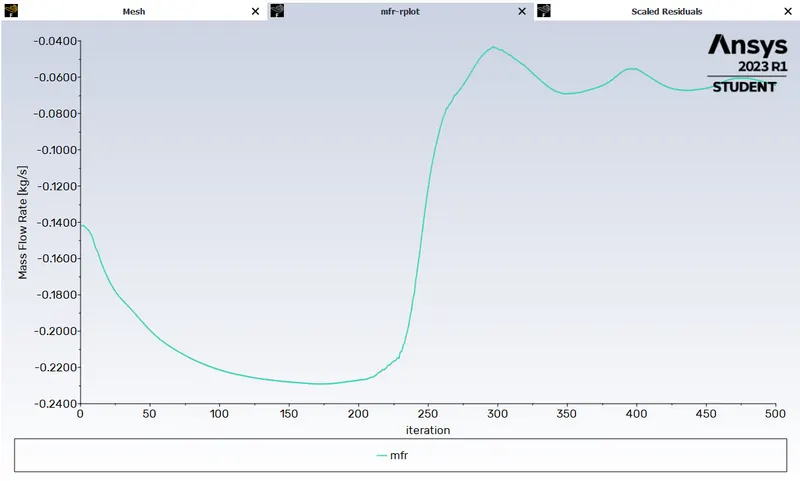
Pressure Contour:
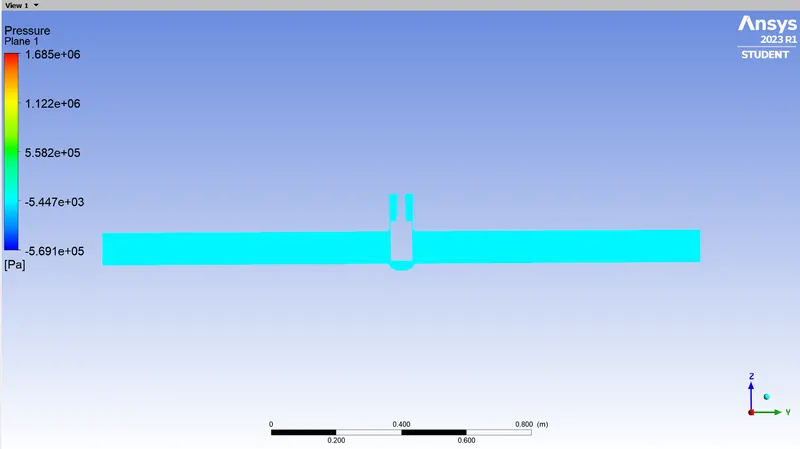
Velocity Contour:
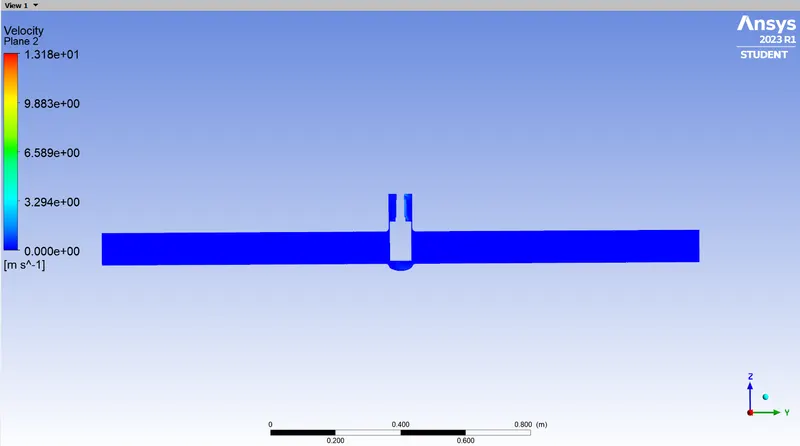
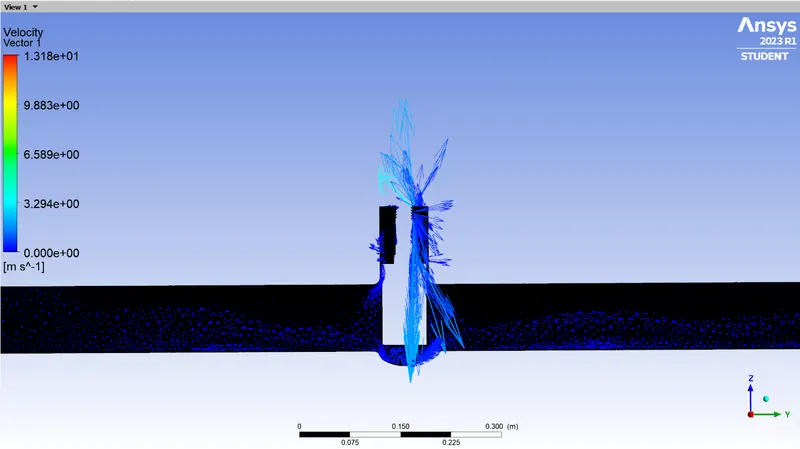
Velocity Vector:
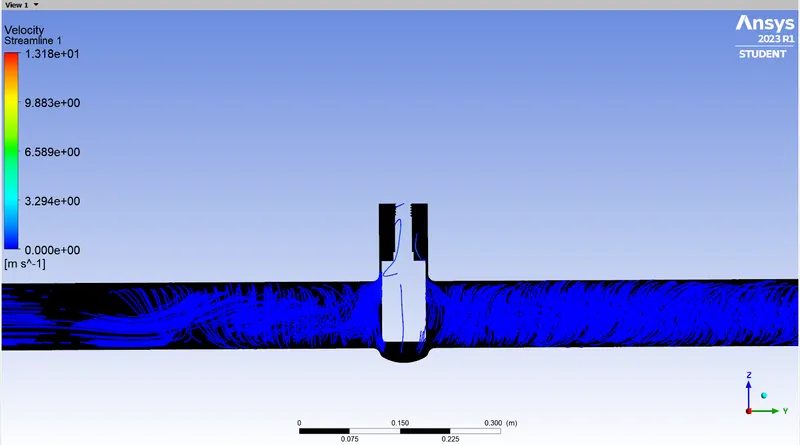
Velocity Streamline:
3) Setting the opening of the gate valve disc as 40 mm.
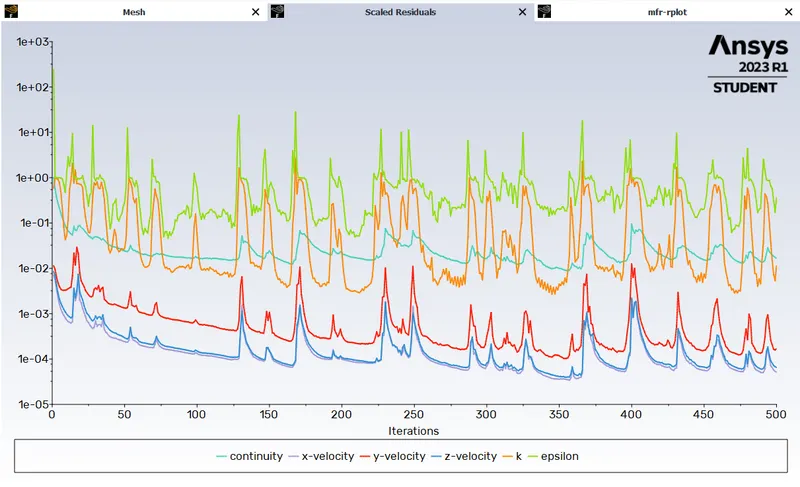
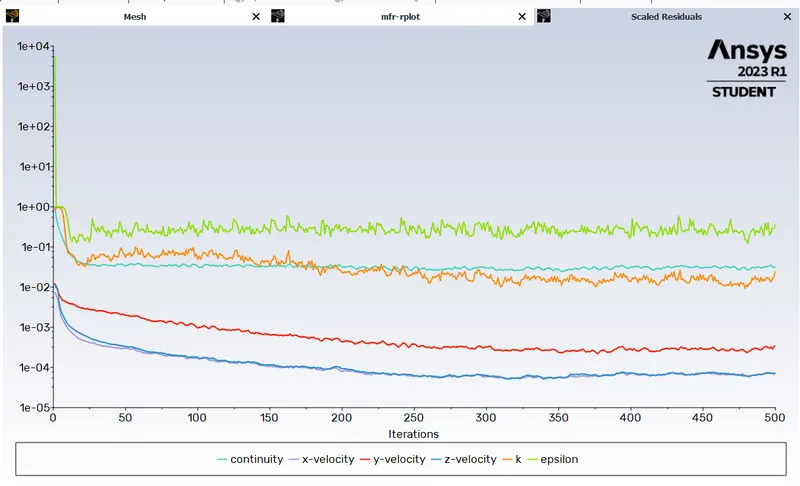
Scaled Residuals:
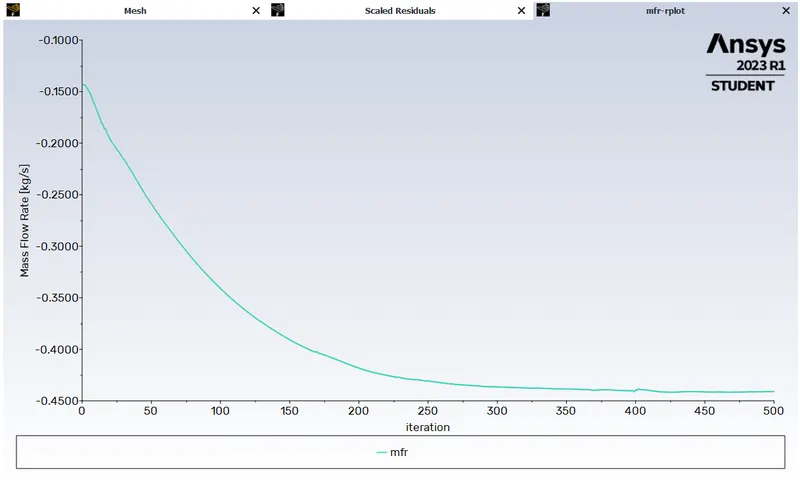
Mass Flow Rate plot:
Pressure Contour:
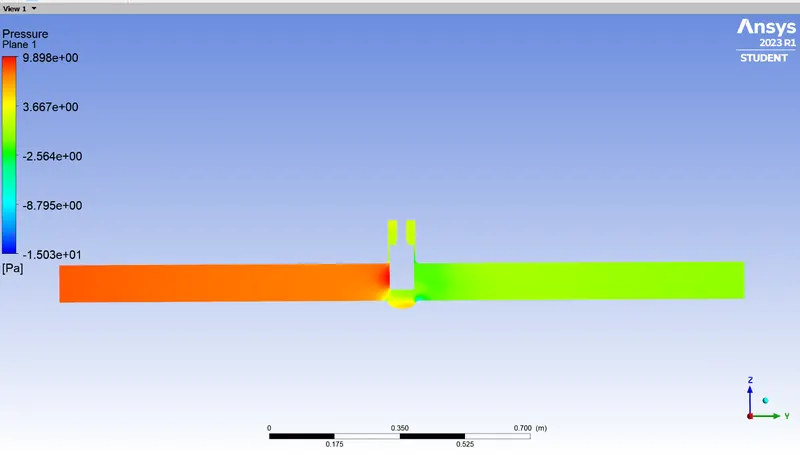
Velocity Contour:
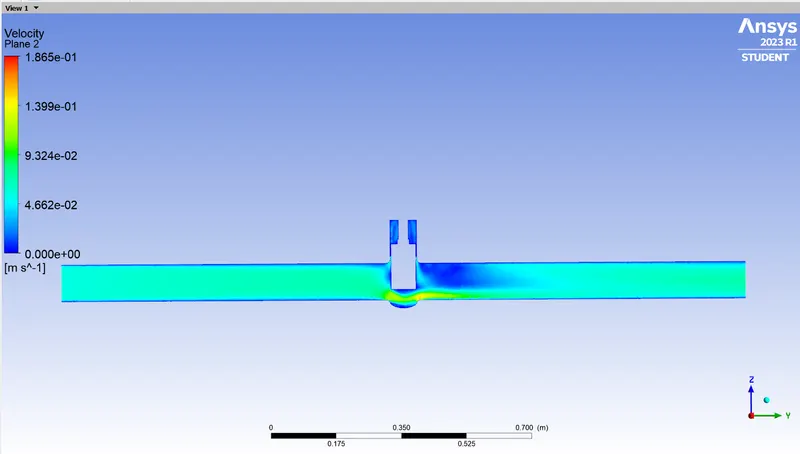
Velocity Vector:
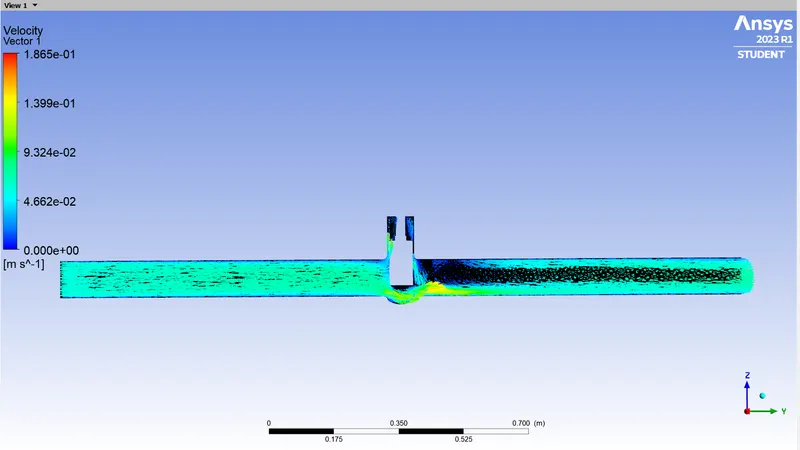
4) Setting the opening of the gate valve disc as 60 mm.
Scaled Residuals:
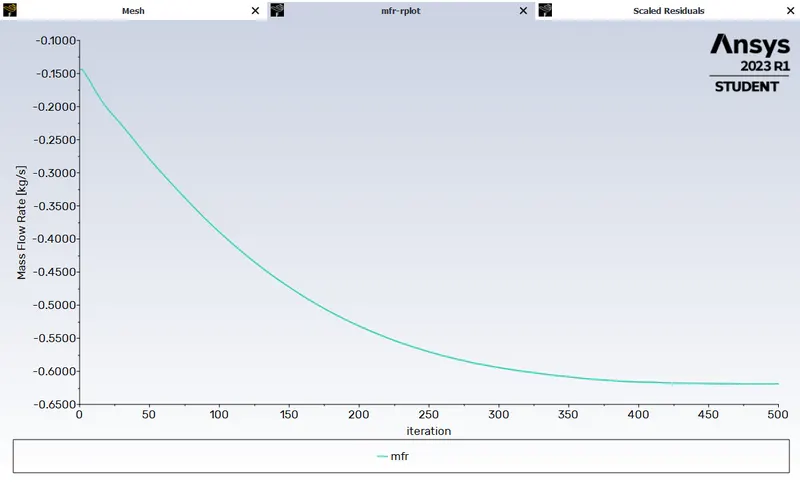
Mass Flow Rate plot:
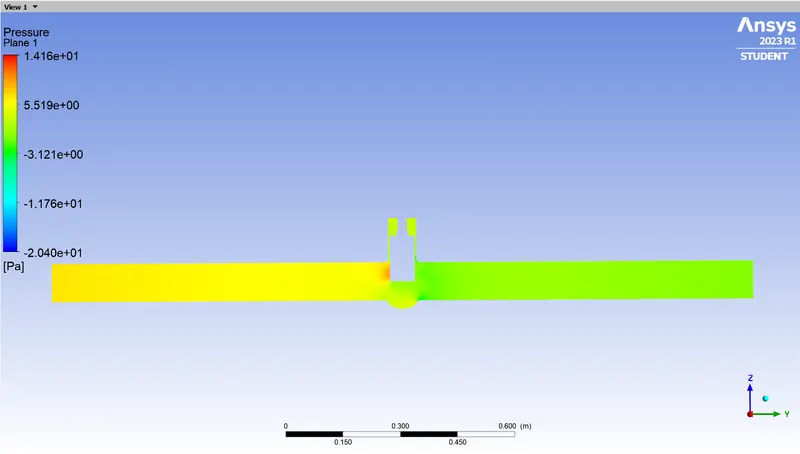
Pressure Contour:
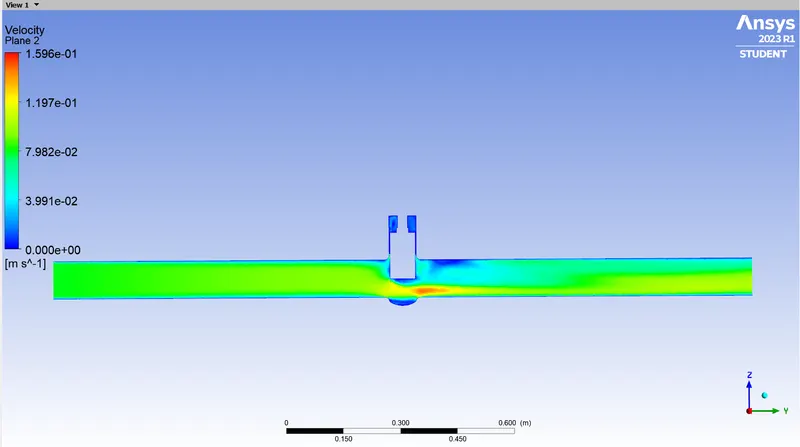
Velocity Contour:
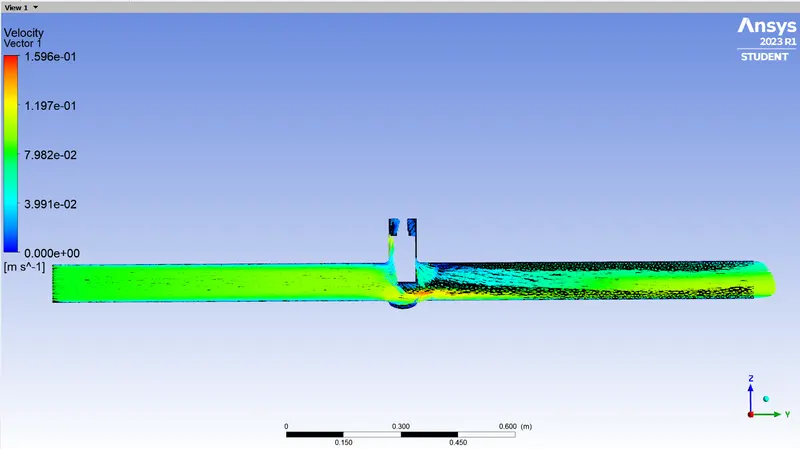
Velocity Vector:
Velocity Streamline:
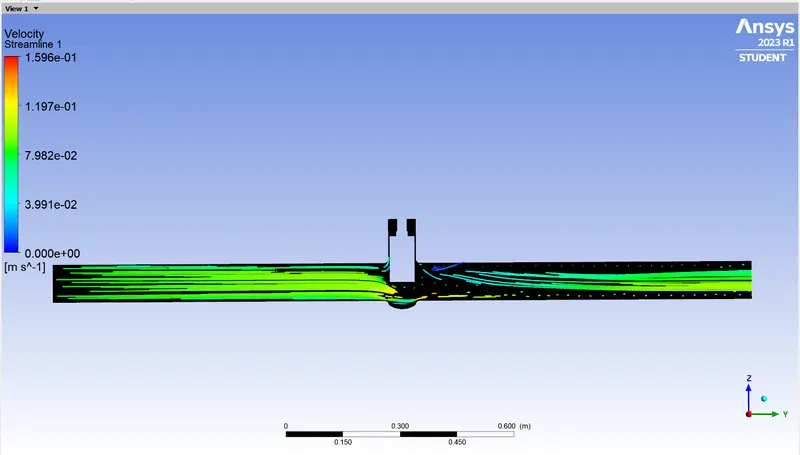
5) Setting the opening of the gate valve disc as 80 mm.
Scaled Residuals:
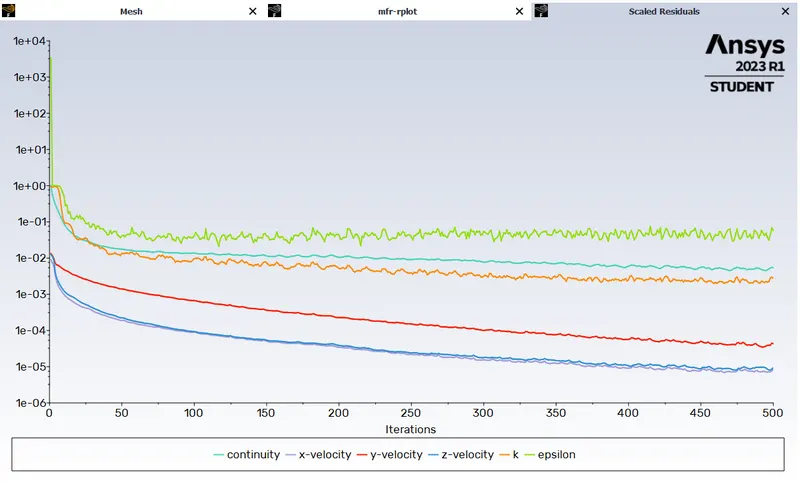
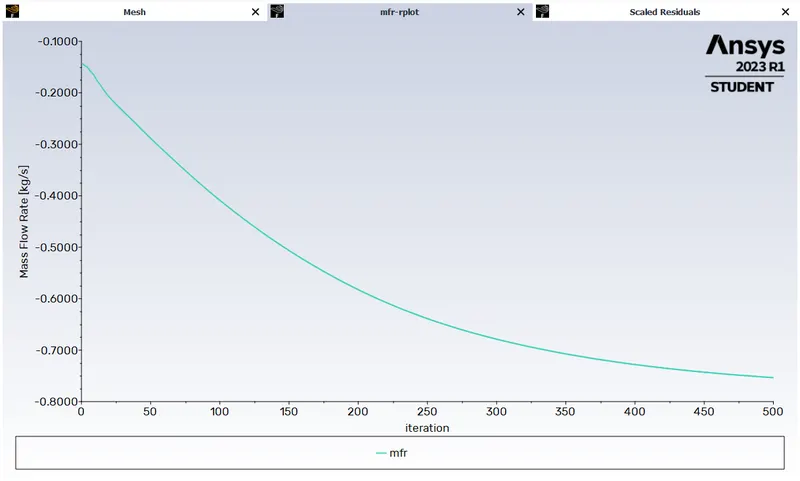
Mass Flow Rate plot:
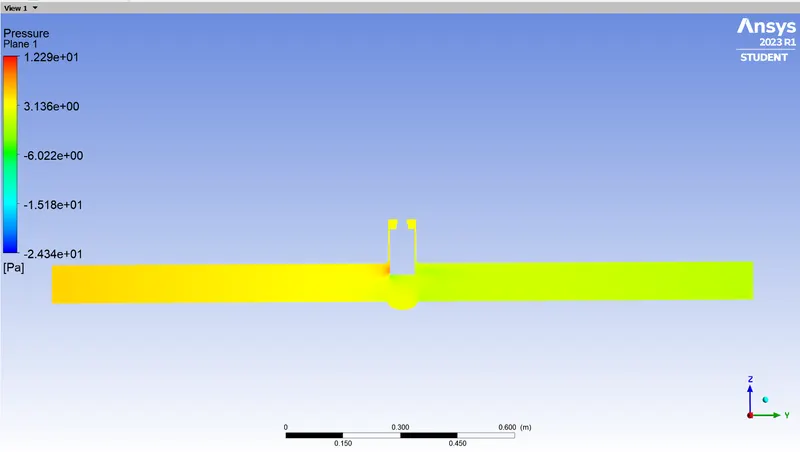
Pressure Contour:
Velocity Contour:
Velocity Vector:
Velocity Streamline:
CONCLUSIONS:
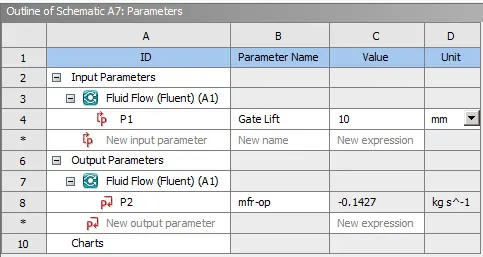
- The different parameters of the simulation is shown below:
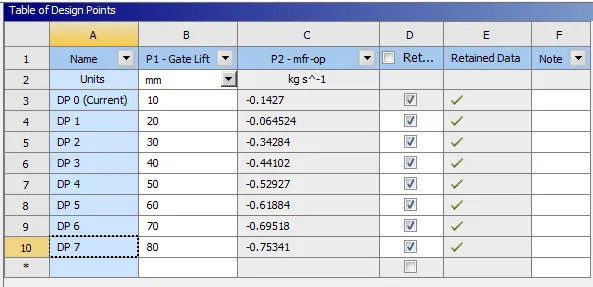
- The table for the different mass flow rate obtained with respect to gate disc lift is shown below:
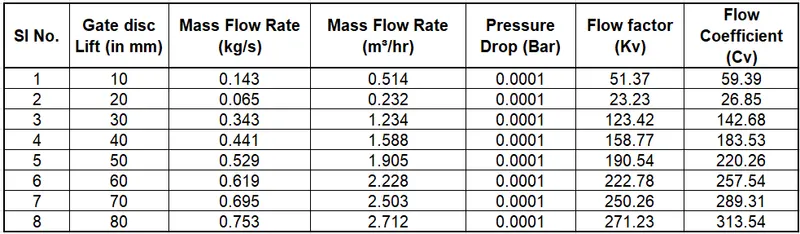
- The table for Flow Factor(Kv) and Flow Coefficient (Cv) is calculated and shown below:
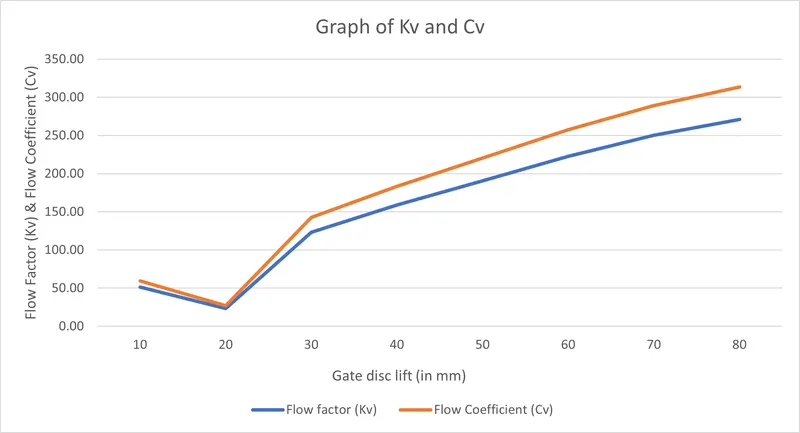
- The graph of Kv and Cv with respect to gate disc lift is also plotted and shown below:
- The negative mass flow rate is due to the mass exiting the outlet.
- From the above table and graph it can be concluded that as the Mass flow rate in the valve increases, the flow coefficient (Cv) increases and the flow factor (Kv) also increases.