Week 9 - Parametric study on Gate valve.
AIM: To perform a parametric study on the gate valve simulation by setting the opening from 10 % to 80% and Calculate the flow coefficient and flow factor for each opening and plot the graph.
INTRODUCTION:
The gate valves are used to regulate the flow of the fluid inside the pipe line.Gate valves are used to shut off the flow and allow the flow. When fully open, the typical gate valve has no obstruction in the flow path, resulting in very low flow resistance. The size of the open flow path generally varies in a nonlinear manner as the gate is moved. This means that the flow rate does not change evenly with stem travel. Depending on the construction, a partially open gate can vibrate from the fluid flow.
THEORY:
A parametric analysis, also known as a sensitivity analysis, is the study of the influence of different geometric or physical parameters or both on the solution of the problem. in this parametric study the gate valve is lifting gradually from 10% to 80%.parametric analysis is a common exercise employed by production engineers in well modeling and decision making on the design.
SLOVING AND MODELLING APPROACH:
1. First i open the workbench and then i drag the anasys fluent into the work space. then i open then geometry on the popup and i open the spaceclaim and import the geometry into the spaceclaim.
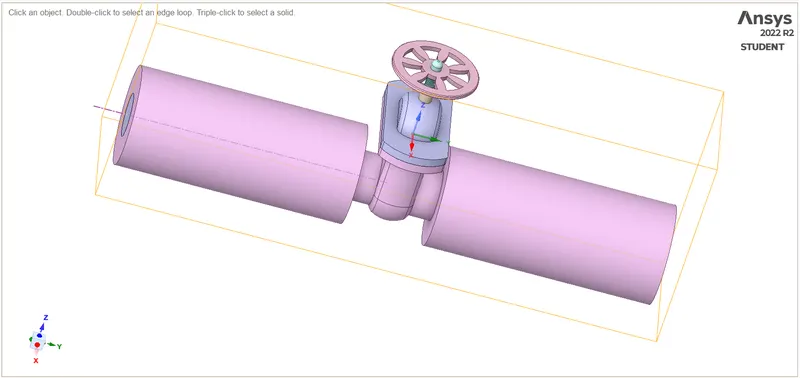
fig: raw model.
2.then i have extracted the inner volume of the geometry by using the option called volume extraction. after the extraction the used option called suppress for physics to disable geometry not used in the simulation.
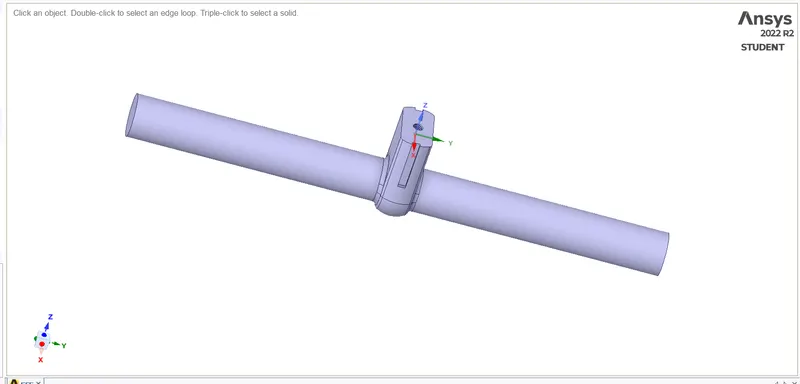
fig: extracted volume of the gate valve.
3. then i selected the valve of the gate valve and i selected the option move to move upwards to 10mm then i show me P in the to set the parametric setup of the valve lifting. then i show me the parameter set on the main window.
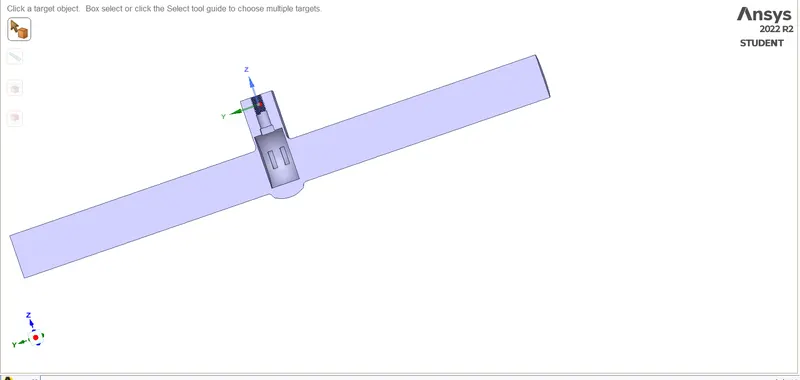
fig: valve lifted to 20mm.
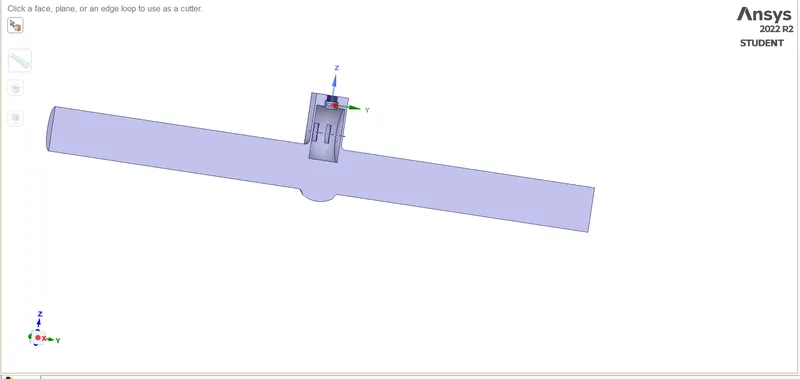
fig: valve lifted to the 80mm.
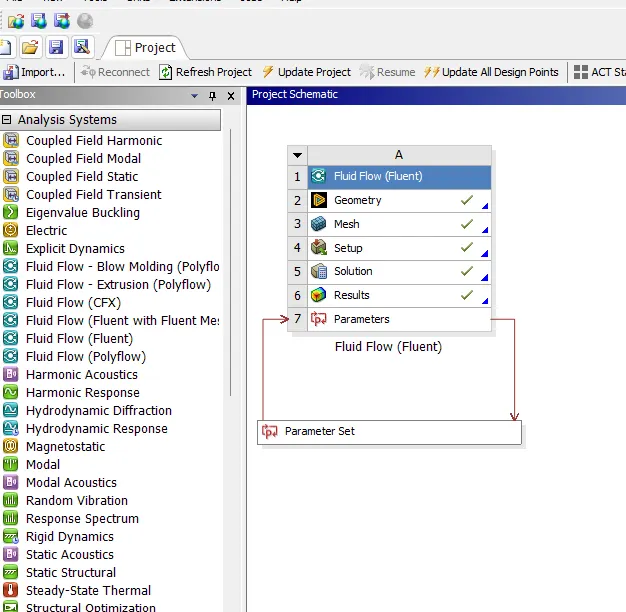
fig: parameter set.
4.then i went to the meshing part here i have generated the mesh with default mesh size. then i have given the name selection of the geometry inlet,outlet and wall of the gate valve.
case 1
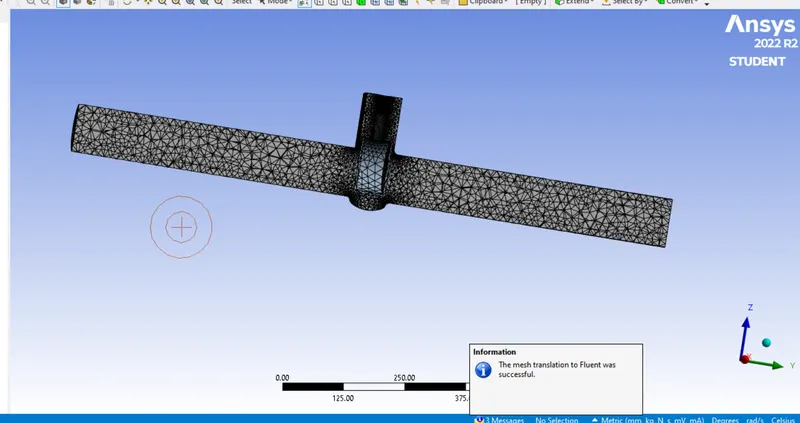
fig: meshed geometry
case 2
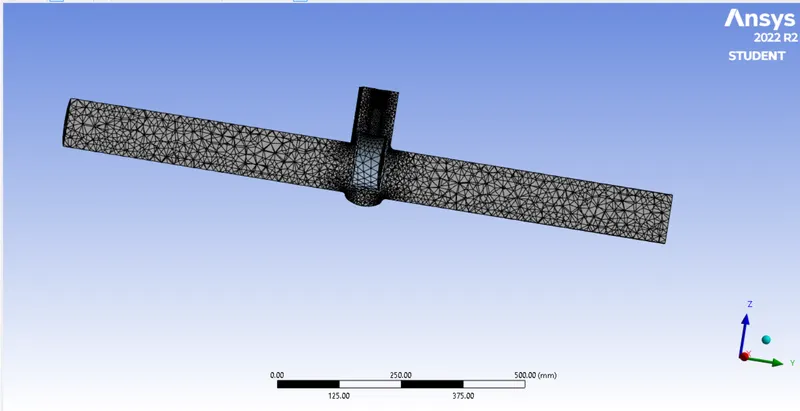
fig: meshed geometry.
case 3
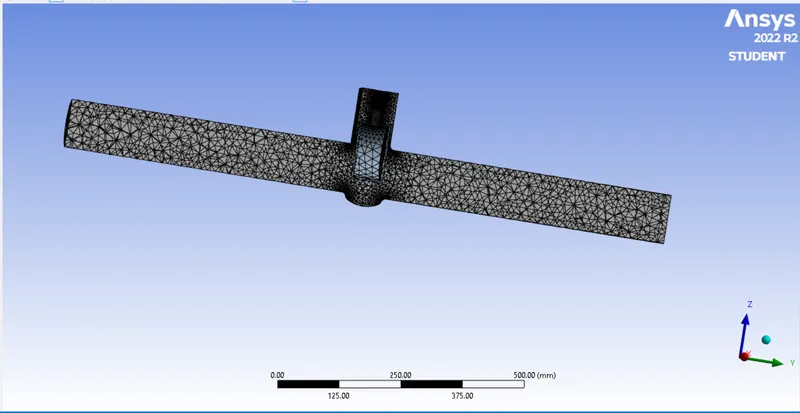
fig: meshed geometry.
case 4
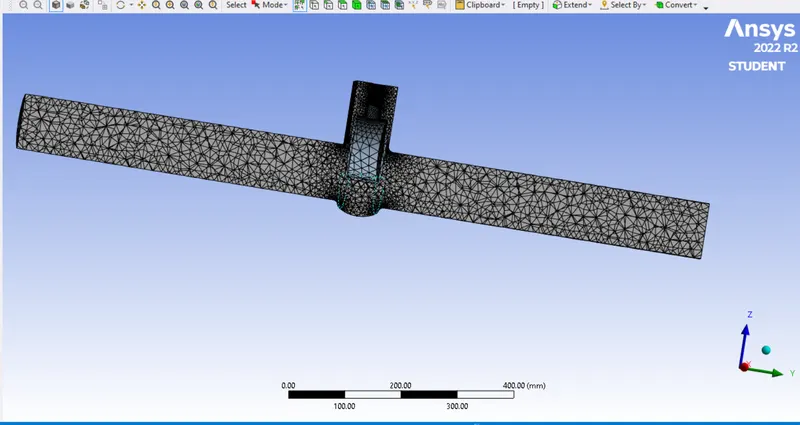
fig:meshed geometry.
case 5
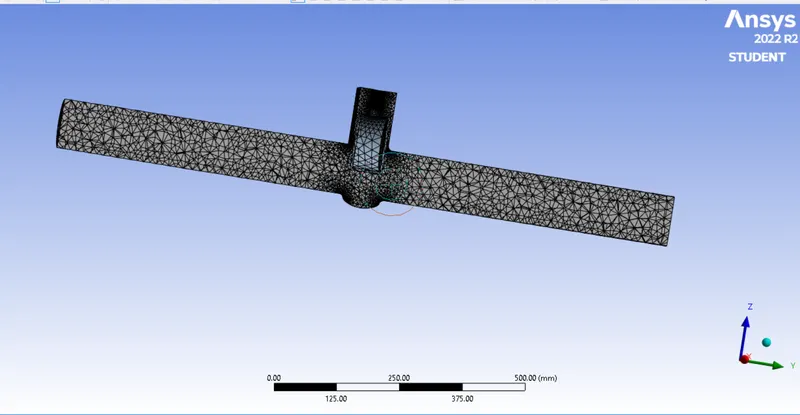
fig: meshed geometry
case 6
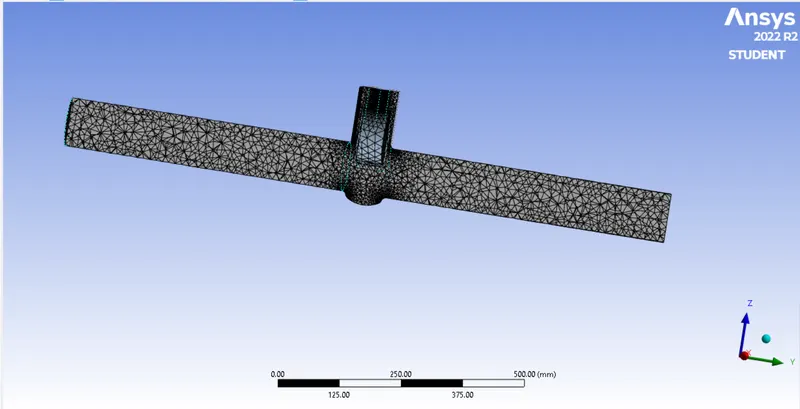
fig: meshed geometry
case 7
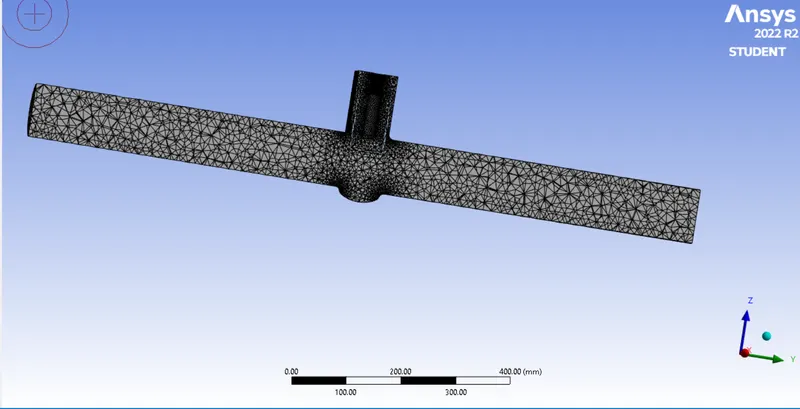
fig: meshed geometry.
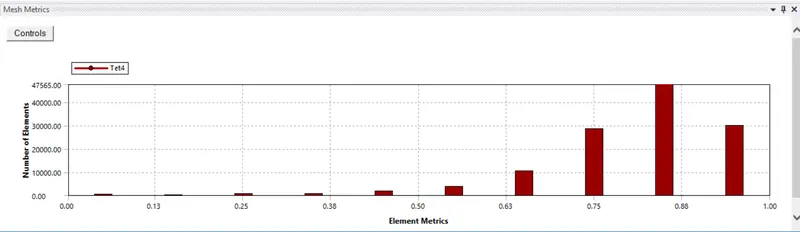
fig: mesh quality
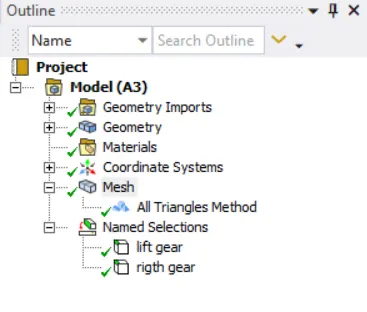
fig: mesh setup.
5.then i have given the name selection of the geometry has inlet ,outlet and wall.
6. then i have went to the setup to start the simulation here i have given the input condition for the simulation.i have given the gravity in Z-axis is -9.81,then i have given the viscous model of K-epsilon RNG model of the swirl dominated flow.
7.then went to the material mange here i have given the water is the material for the simulation to flow through gate valve. then went to the inlet to condition here i deleted the air and inlet pressure 10 pa.
8.then i went to the solution to generat the mass flow report, here select the defination under the solutions given the surface report and i selected the mass flow rate.and given the the print to console and create output parameter. then i initialized the solution then i run for 300 iteration.
OUTPUT:
CASE 1
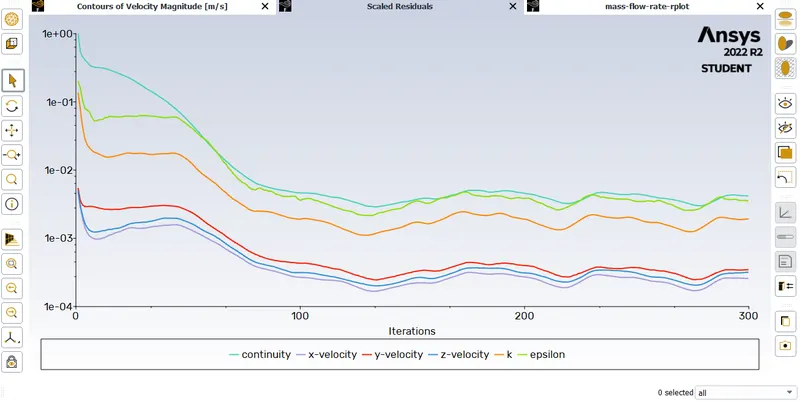
fig: residual plot.
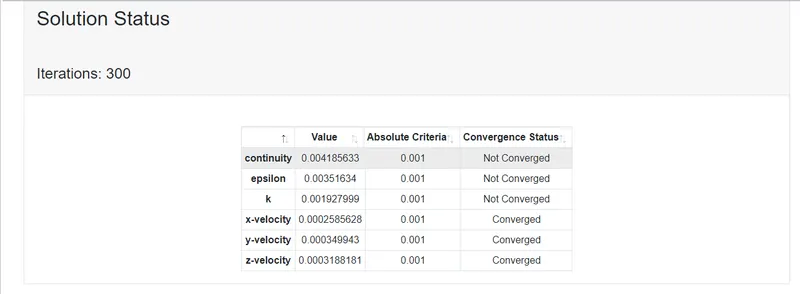
fig: converged.
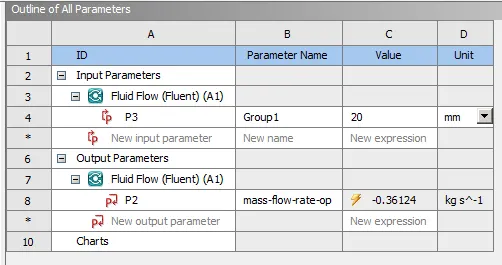
fig: parameter outline.
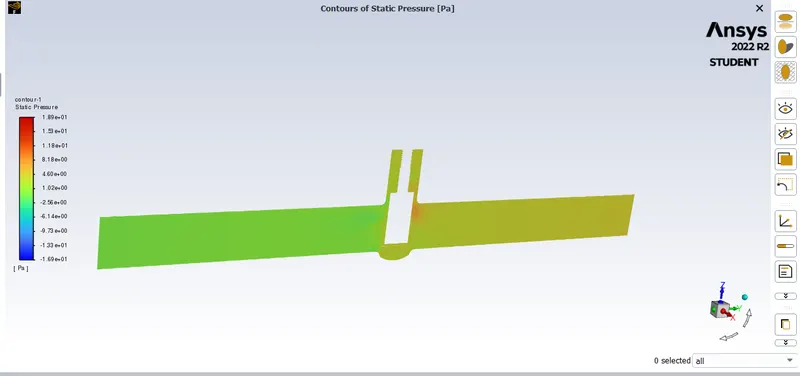
fig: pressure contour.
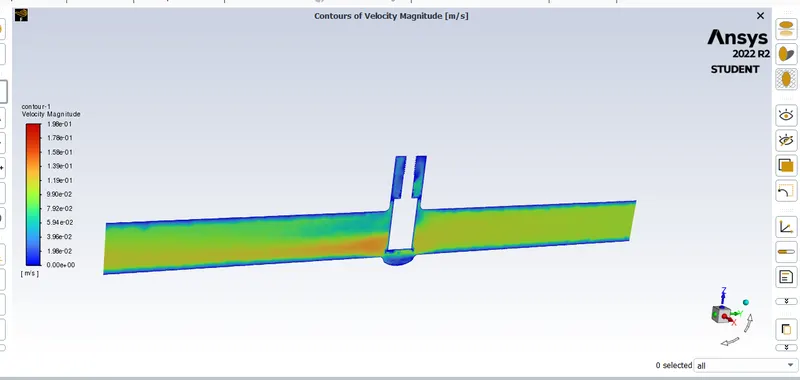
fig: velocity contour.
9. then i show the window of the parametric on the space then i open the parameteric i set the lifting of the valve from 10mm to 80mm.
fig: parameter set
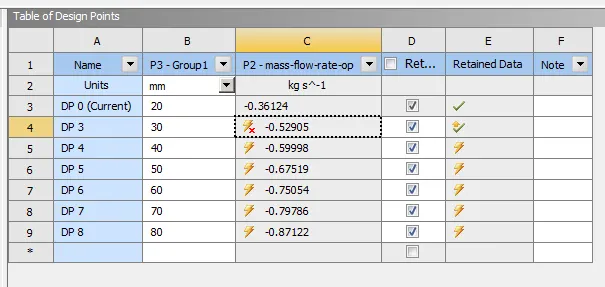
fig: parametric setup of valve lifting.
CASE 2
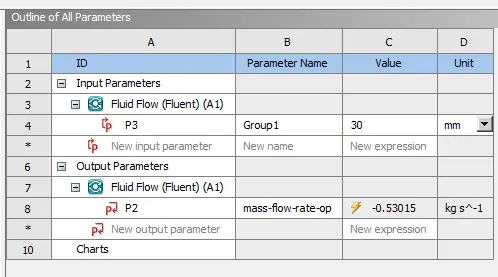
fig: parameter outline.
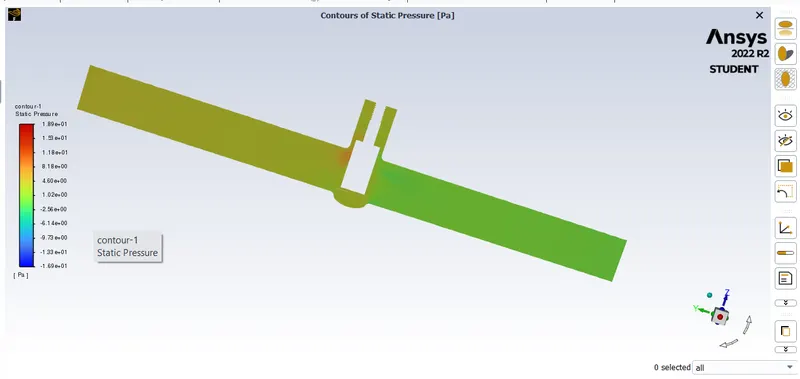
fig: pressure contour.
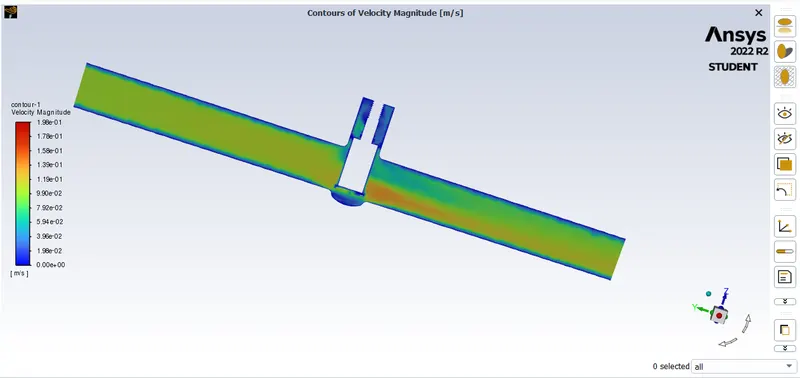
fig: velocity contour.
CASE 3
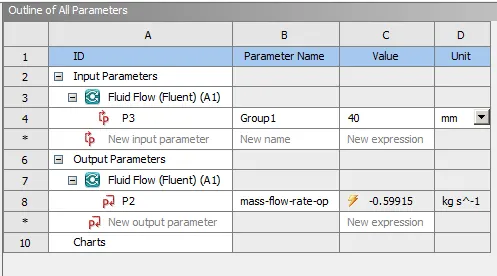
fig: parameter outline
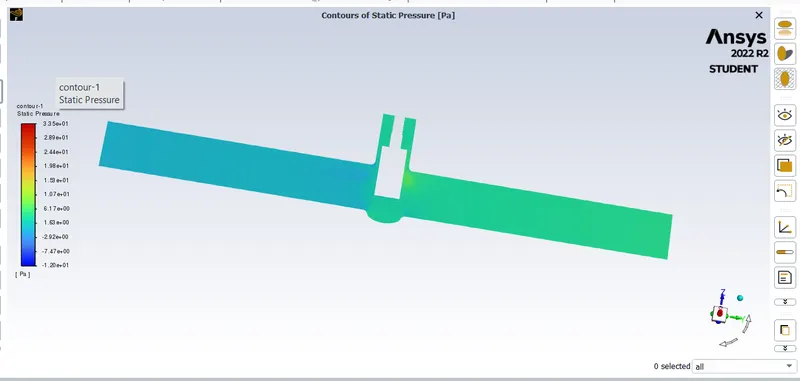
fig: pressure contour.
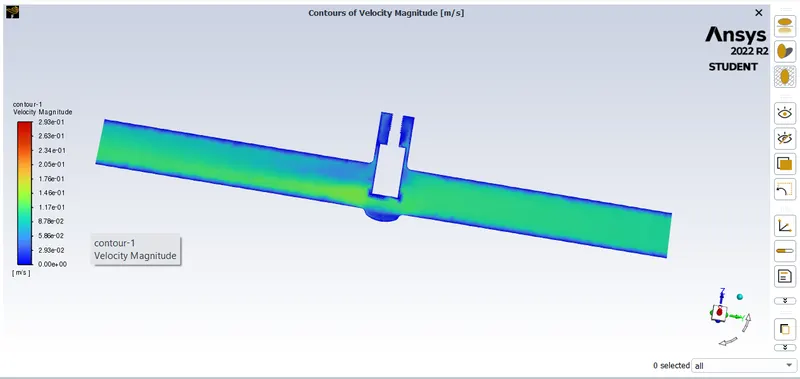
fig: velocity contour.
CASE 4
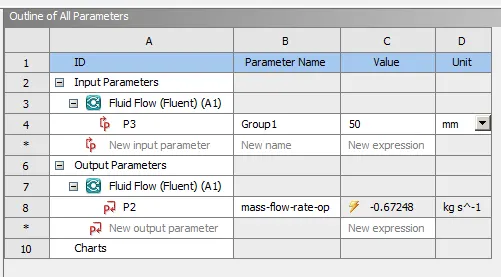
fig: parameter outline
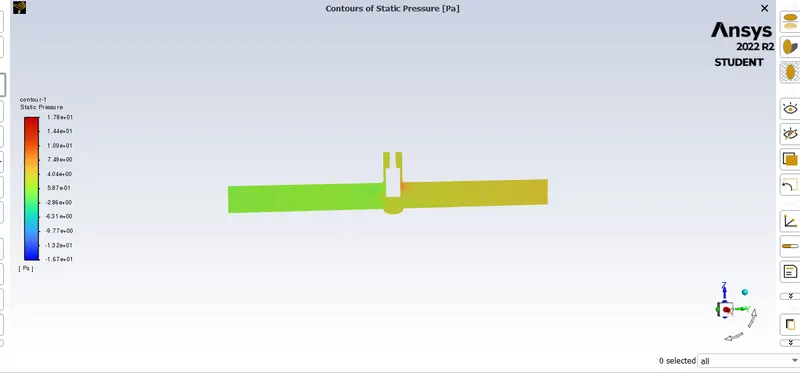
fig: pressure contor.
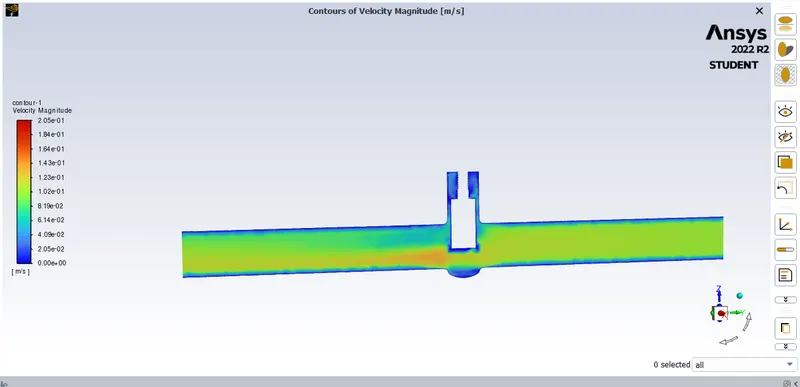
fig: velocity contour.
CASE 5
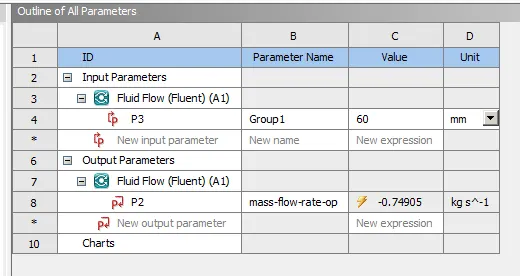
fig: parameter outline.
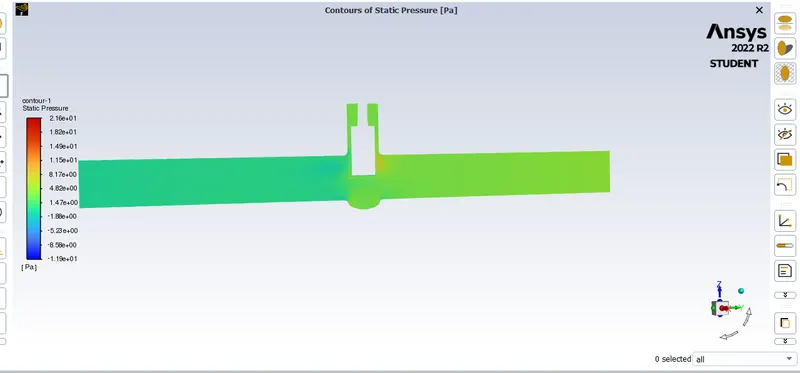
fig: pressure contour
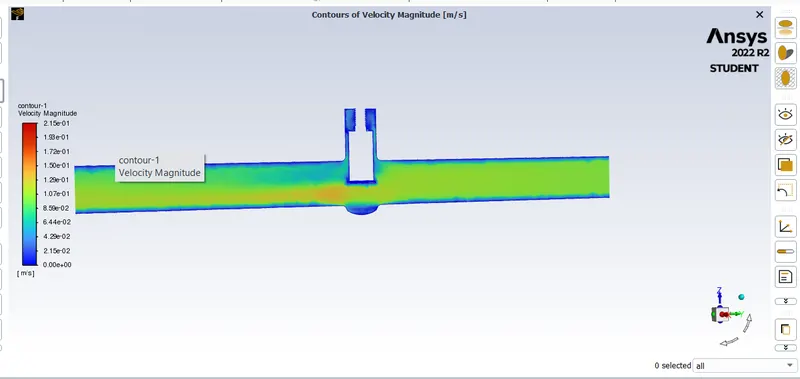
fig: velocity contour
CASE 6
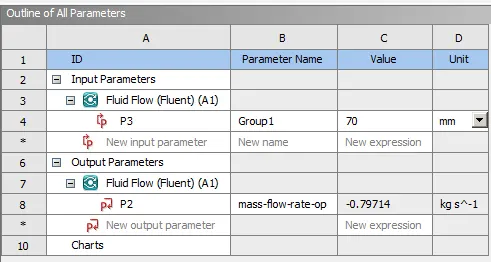
fig: parameter outline.
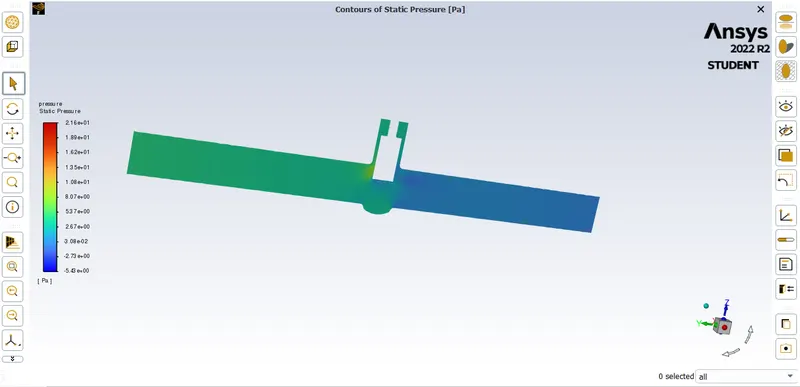
fig: pressure contour
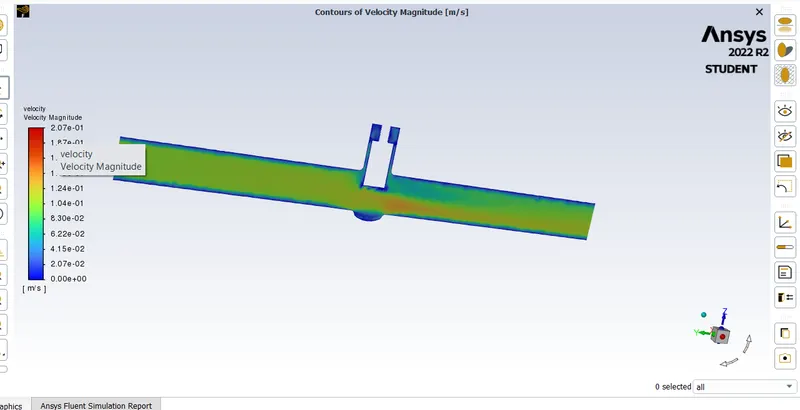
fig: velocity contour
CASE 7
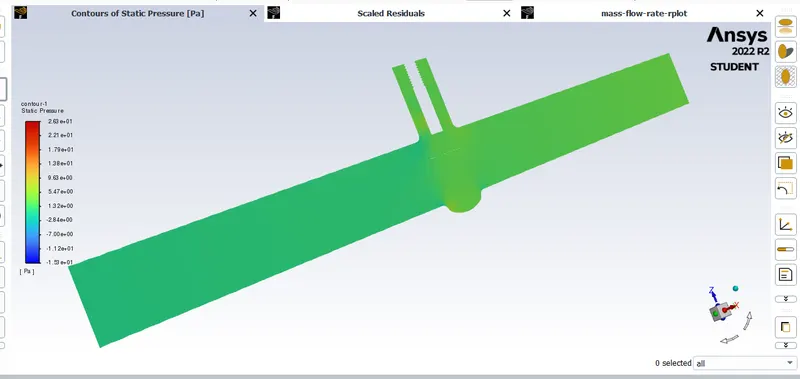
fig: pressure contour
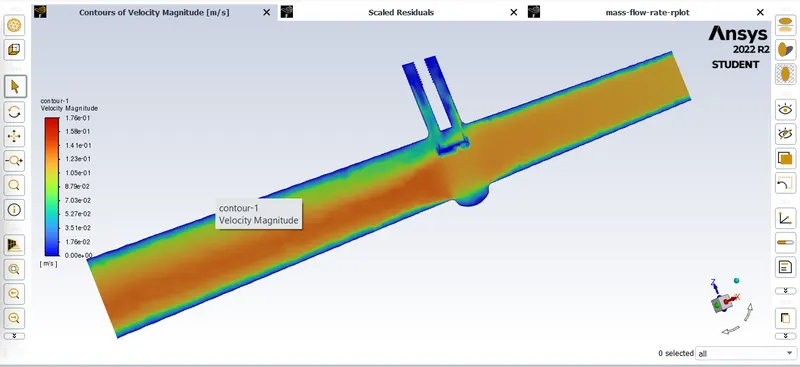
fig: velocity contour
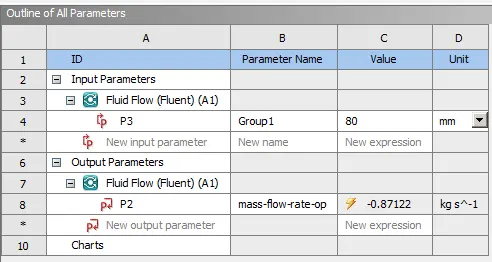
fig: parameters outline
CALCULATION:
flow coefficient(Cv):
Cv= QQ√s.g/Δp
where:
- Q is the rate of flow (expressed in US gallons per minute)
- SG is the specific gravity of the fluid (SG for water= 1)
- ΔP is the pressure drop across the valve (expressed in psi).
flow factor(Kv):
Kv=Q√s.g/Δp
where:
- Q is the rate of flow (expressed in m^3/h)
- SG is the specific gravity of the fluid (SG for water= 1)
- ∆P is the pressure drop across the valve (expressed in bar).
Kv can be calculated from Cv using the equation:
Kv=0.865⋅Cv
RESULT:
| S.NO | parameteric distance | Δp (pa) | mass flow rate | volumetric flow rate | Cv | Kv |
| 1 | 20 | 10-5.44 | 0.3612 | 4.7677 | 1.0455 | 1.2085 |
| 2 | 30 | 10-5.44 | 0.5290 | 6.9824 | 1.5331 | 1.7722 |
| 3 | 40 | 10-5.44 | 0.5999 | 7.9186 | 1.7365 | 2.0073 |
| 4 | 50 | 10-5.44 | 0.6751 | 8.9112 | 1.9542 | 2.2590 |
| 5 | 60 | 10-5.44 | 0.7505 | 9.9055 | 21723 | 2.5111 |
| 6 | 70 | 10-5.44 | 0.7978 | 10.530 | 2.3092 | 2.6694 |
| 7 | 80 | 10-5.44 | 0.8712 | 11.498 | 2.5216 | 2.9149 |
GRAPH:
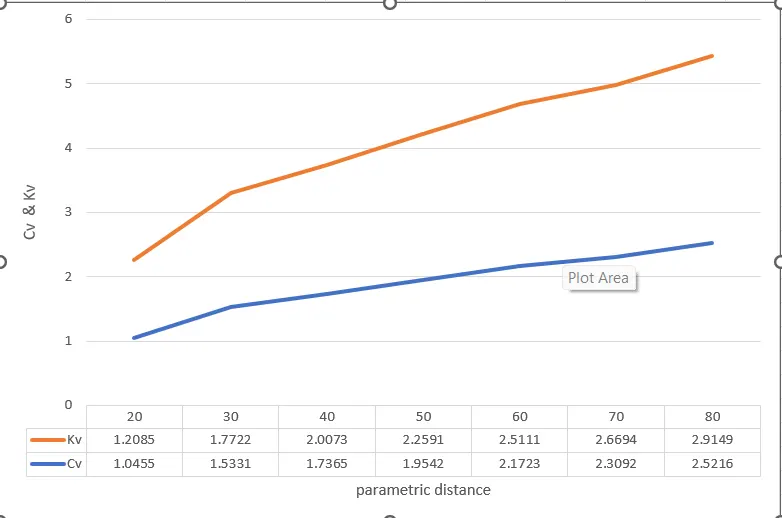
CONCLUSION:
here i conclude that the low lift height refers to the higher pressure drop and thus low flow rate through the valve.the negative mass flow is due to the mass exiting the outlet. With the help of the parameters the solving time and effort can be reduced drastically. Flow factor and coefficient increses as the mass flow rate through the valve increases.