Parametric study on Gate valve.
As a child, whenever I washed my hands, I was curious how the tap worked. How is the flow controlled by just rotating the hand wheel? In this project we are going to see how these taps work and what is the impact of rotation of the handle.
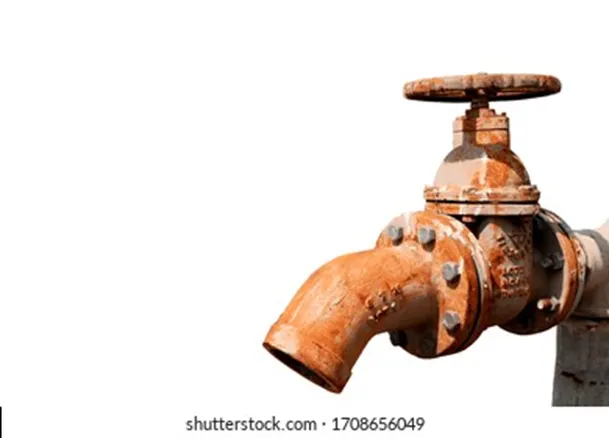
A typical old modelled gate valve tap (I lived in a pretty old house) would look as shown below.
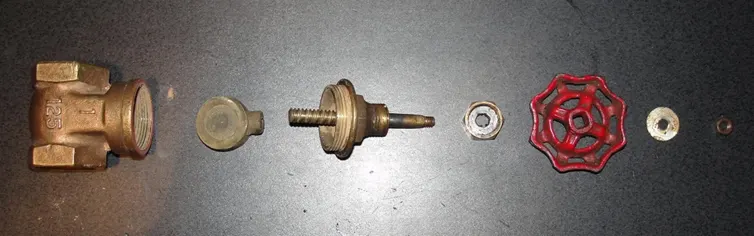
These are actually gate valves used as taps. Their internal structure is as shown below. The parts shown below, starting from left, are fluid flow channel/body, gate/disc, Spindle and bonnet, hand-wheel assembly.
Though the example above is of a small residential tap, gate valves have a huge application in industries. Almost every industry relies on gate valves in direct or in-direct way. So, a study of the gate-valves is important.
Pre-processing
Geometry
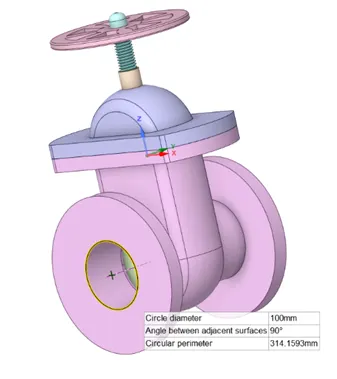
Pull the structure to lengthen the fluid flow channel as shown below. Instead of simulating the rotation of the hand-wheel, we would directly raise the disc by desired amount. This is to simplify the problem.
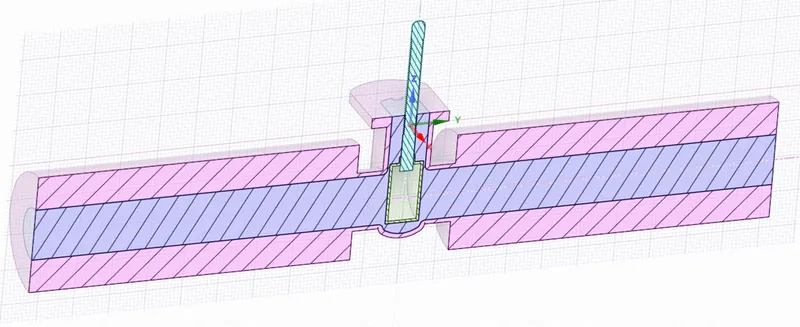
Normally, we would now Mesh the structure and run the case and come back and lift the disc some more and repeat the process. There is a work around for this process. It is called as parameter grouping. We specify the parameter and the amount of change in the parameter and run the case. The set-up will run for all the cases. This does not reduce computation time, but it surely reduces human efforts.
For process of parameterizing, click here
Meshing
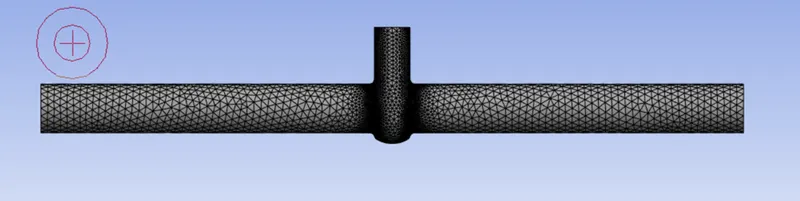
Generate the Mesh as desired. In this case, the default mesh created by Ansys was used, without any additional methods. Give named selections to the inlet and outlet.
Case Set-up
• Viscous model – k -Epsilon Realizable with scalable wall function
• Enable Gravity
• Steady state Analysis
• Fluid – Water
• Inlet condition – Pressure inlet = 10 Pa
The selection of viscous model was such because the flow falls in turbulent region. The velocity of the flow can be calculated by standard initializing the solution. Further the Reynolds number can be calculated.
`Re= (rho*v*d)/mu`
`Re=(998.2)*(0.1415488)*(0.1)/0.001003`
`Re > 2000`
Run for 250 iterations.
Results
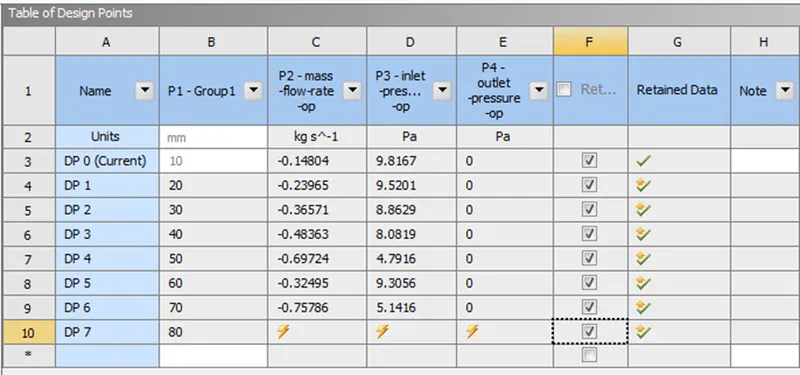
The mass flow increases linearly till a lift of 40mm. After than the mass flow increases much higher than before for 50mm of lift and then falls rapidly for a lift of 60mm. This definitely seems wrong because the flow is less restricted at higher lift of the gate, which means the mass flow rate should increases, contrary to the results. To find the problem, the case lift = 50 mm was run individually for 250 iterations to find out that flow was not converged. The solution was made to run for another 250 iterations, yet no convergence was seen as the mass flow rate did not maintain a constant value.
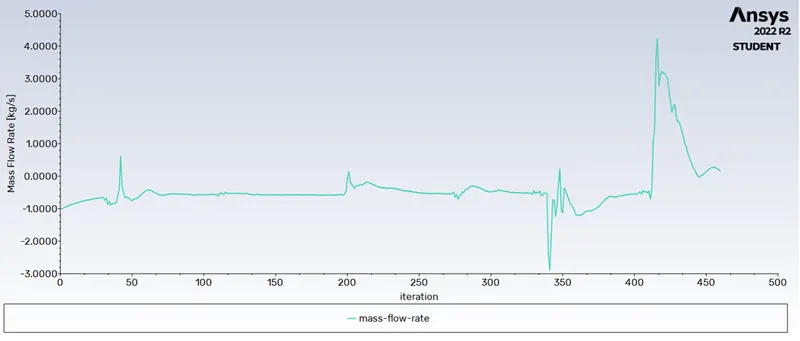
The Mesh was refined to check if the mesh was the problem.

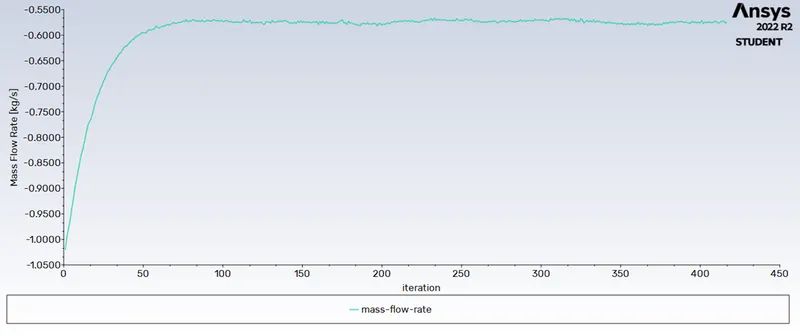
The solution was re-run for 450 iterations and the mass flow rate was found to be constant, thus having achieved convergence.
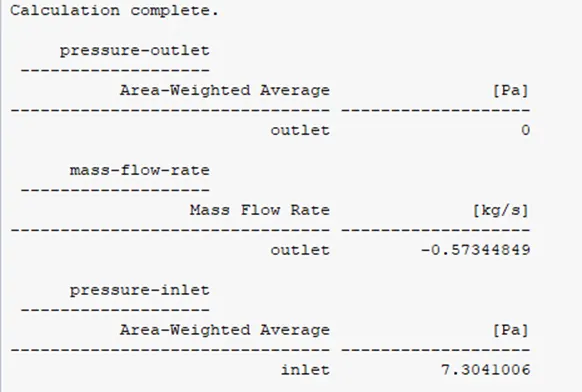
A parameterized study was again set-up for the remaining cases and was run. Unfavorable results were seen for lift cases of 70 mm and 80 mm.
The Meshes were further refined and individual cases were run for the left-over cases, the results were as shown below.
For 60 mm lift
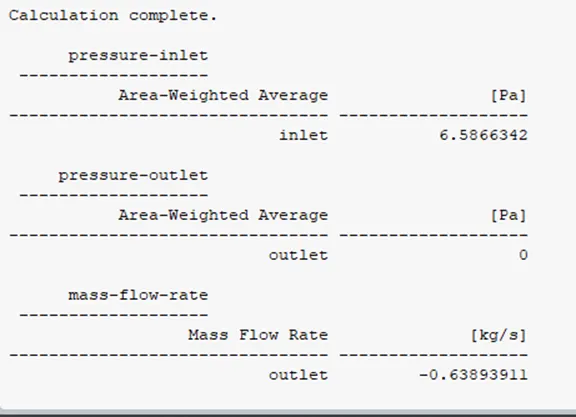
For 70 mm lift
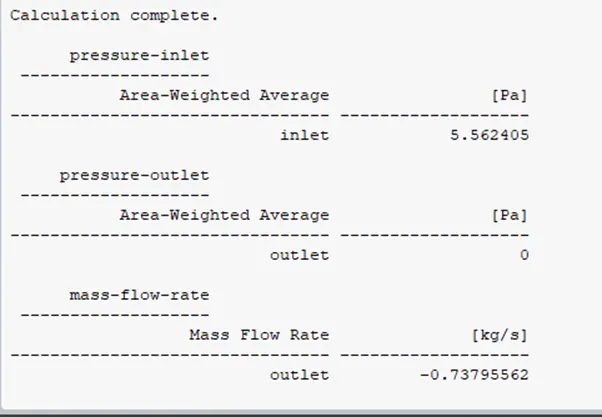
For 80 mm lift
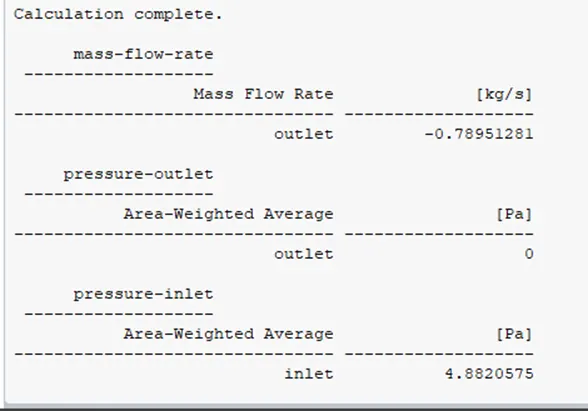
The results were accumulated and the Flow factors and Flow coefficients were calculated in MS
Excel, as shown below.

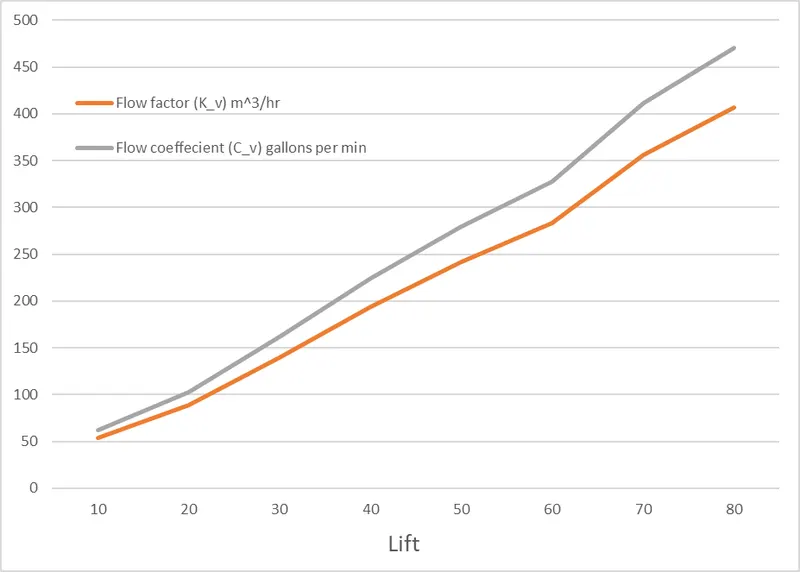
Flow factor and flow coefficient are basically the same thing, but in different units. They are the measure of the efficiency of a device to allow the flow of fluid. They describe the relation between pressure drop across the orifice and the mass flow rate through it.
`C_v=Q(root(2)((SG)/(DeltaP)))` and `K_v=Q(root(2)((SG)/(DeltaP)))`
C_v in US galloon format and K_v in SI format.
Inference
• As the lift of the gate increases, the mass flow rate, flow factor and flow coefficient increase.
• Alternatively, we can also say that at lower lifts, the pressure drop is higher, thus low mass flow rate.
• As, the lift increased, the solution demanded much more refined mesh for sensible results.